Introduction
Flow in the axial compressor is quite complex because it contains kinds of unsteady flow structures such as the tip leak flow (Booth et al., 1982), the rotor-stator interacting (Liu et al., 2019a, 2023), the corner separation flow (Zhong et al., 2024) and boundary layer transition (Liu et al., 2024c). Among them, tip leakage flow (TLF) is a typical compressor secondary flow caused by the pressure difference between the blade's pressure side and the suction side. The leakage jet interacts with the passage flow and forms the tip leakage vortex (TLV). TLF has a significant effect on the efficiency (Inoue et al., 1986), flow stability (Adamczyk et al., 1993; Tan et al., 2010), and noise generation of the compressor (Hsiao and Chahine, 2005). With the development of the compressor design toward more compact and higher loading, the effect of the TLF is increasingly significant.
Computational fluid dynamics (CFD) has become an important tool for studying compressor flow. In the current design process, the Reynolds-averaged Navier-Stokes (RANS) method is widely used because it is cheap in consumption, and many endeavors have been made to modify turbulence models (Li and Liu, 2022; Liu et al., 2011, 2020, 2023, Liu et al., 2024c). Alternatively, high-fidelity CFD methods, including direct numerical simulations (DNS) and large eddy simulation (LES), can supply detailed information on flow structures, which is critical for flow physics studies and flow control (Xie et al., 2023). Recently, hybrid methods, which combine the advantages of the Reynolds-averaged Navier-Stokes (RANS) and LES, have drawn increased attention. Hybrid methods use the RANS model to solve the flow within the boundary and use the LES at the main flow. Therefore, it can reach a high accuracy using a much lower computational consumption. Commonly used hybrid methods include DES (Spalart et al., 1997), DDES (Spalart et al., 2006), and GAS (Wang and Liu, 2022). DDES has already been used to study the unsteady flow characteristics of the tip leakage flow in a compressor rotor, and the results are compared with URANS results (Liu et al., 2019b). Then, a physical flow model aimed at simulating the TLF is proposed to reproduce the flow shear mechanism between jet flow and the main flow of tip leakage vortex roll-up (Gao and Liu, 2019). Flow visualization technology, including the pathline and streakline, has also been used to analyze the vortex transportation of the tip leakage vortex under different working conditions based on the results from DDES (Hou et al., 2022). The vortex structures and vortex instability are found to be crucial to describing the TLF, and the advanced vortex identification methods are important tools for studies of TLV, such as the local trace criterion
The TLF has been found to be highly unsteady in many previous studies (Zhang et al., 2006; Tong et al., 2007), and its unsteady characteristics affect the noise, blade vibration, and loss generation (Wisler, 1985). Many types of unsteadiness have been reported for TLF. The dynamic interaction of the incoming main flow and the tip leakage flow could induce self-induced unsteadiness in the TLF (Du et al., 2010), and the oscillation of the TLV could also be attributed to an induced vortex and the shock-vortex interaction (Hah et al., 2006). Vortex breakdown is another unsteady flow feature. The breakdown of the TLV could enlarge the blockage region in the tip region (Wang et al., 2021). The stability of the compressor rotor is also related to the unsteadiness of the TLV (Furukawa et al., 1999). Rotating instability vortex are found to be the leading cause of unsteadiness during the development of rotating instability in a low-speed axial flow compressor (März et al., 2002). Therefore, detailed studies on the unsteadiness of TLF are needed to develop new modeling and flow control techniques.
However, extracting key flow features from unsteady flow fields is also challenging because the dataset is massive for high-fidelity simulation results or experimental results. With the progress of computer technology, data-driven approaches have become increasingly prevalent in fluid mechanics, including deep learning, reinforcement learning, modal analysis, etc. These techniques are crucial in feature identification, flow field prediction, and flow control (Liu et al., 2024a,b). Recently, dynamic mode decomposition (DMD) (Schmid, 2010) has been proposed as a data-driven approach to analyze unsteady flow. DMD belongs to the mode analysis method derived from Koopman's theory (Rowley et al., 2009). DMD can extract coherent spatiotemporal structures from time series data. Then, a low-dimensional linear model describing the evolution of these dominant coherent structures can be built. Compared with proper orthogonal decomposition (POD), DMD can provide spatial information in each mode and temporal information embedded in each eigenvalue. This advantage leads to the extensive usage of DMD in analyzing flow phenomena and modeling flow dynamics (Taira et al., 2017; Kunihiko et al., 2020). Application of the DMD or other mode analysis methods has already been conducted in turbomachinery flow, such as the analysis of the pressure pulsation in centrifugal compressor dynamic structures (Zhang et al., 2022) and the analysis of the experimental data to describe the transition process of separation flow (Lengani et al., 2016). Additionally, DMD is also helpful in the development of the reduced order model (ROM) and has been used in isolated airfoils and turbomachinery cascades (Florea and Hall, 1998; Dowell et al., 1999). Since the TLF has abundant unsteady motions, DMD is also valuable for analyzing its flow feature.
This work investigates the unsteady characteristics of the TLF in a rotor based on the unsteady flow field dataset simulated via the DDES. The
Case description and numerical method
Test case description
The axial rotor studied in this work is a low-speed compressor that has been tested using the stereoscopic particle image velocimetry (SPIV) method in a low-speed large-scale axial compressor test facility at Beihang University (Liu et al., 2006). The schematic of this experimental rig and the SPIV measurement locations are shown in Figure 1, and the details of the design parameters are summarized in Table 1. The flow in this test compressor, such as the mechanism of the formation and development of the TLV, has also been discussed in our previous papers (Hou and Liu, 2023; Hou et al., 2022). The design point of this rotor is defined as the mass flow coefficient of 0.58, and the near-stall point is defined as the mass flow coefficient of 0.39. The numerical result is validated in our previous work, and the DDES results show a good accordance with the experimental data (Liu et al., 2006).
Figure 1.
Schematic Layout of the SPIV Measurement Cross Sections of the Axial Rotor (Liu et al., 2008).
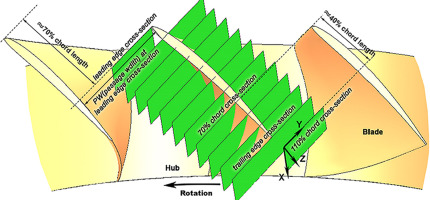
Table 1.
Parameters of the rotor.
Numerical method
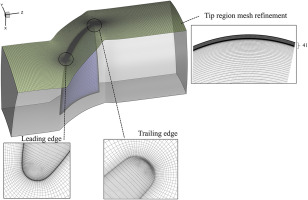
The software Numeca Autogrid 5 is used to generate a high-quality structure grid. The grid of the rotor blade uses the O4H-type topology. To better capture the structure of TLF in the tip region, the grid within 20% of the span height to the shroud is refined with a maximum expansion ratio of 1.05. and the grid spacings are kept as Δx + <120, Δy + <110, and Δz + <1, respectively. The total number of grid points is 6.17 × 10⁶, and details of the final grid are shown in Figure 2.
The numerical simulations use the pressure-based implicit solver from the commercial solver Ansys Fluent and the iterative time advancement solution method is used. The SIMPLE algorithm is used for the simulation. A central differencing scheme is employed for spatial integration, and the implicit second-order time integration is adopted for temporal discretization. The time step for the outer time marching is set to 3 × 10⁻⁶ s, which is approximately 1/1,000 times the blade passing the time (TBP), and 30 iterations are set at each inner iteration. The first sample time of the DDES is considered to be
Dynamic model decomposition
DMD was developed based on the theory of the Koopman operator (Rowley et al., 2009; Schmid, 2010). It is a popular method to extract the temporal-spatial coherent structure in unsteady flow and develop reduced-order modeling (Dowell et al., 1999). Compared with the traditional POD method, DMD could supply more information in the temporal domain. The algorithm of the DMD is introduced as follows. First, snapshots of data must be collected, and these data are arranged as columns of matrices X and Y as follows:
Then, the relationship between the snapshots can be considered linearly, as follows
The eigenvalues and modes of DMD are defined as the eigenvectors of A. The reduced SVD of X is performed, letting X be denoted as:
Then let
Solve the eigenvalues
Then, the DMD mode
If we need to rebuild the flow, the initial variant
where
where
Vortex identification method
To study the vortex structures of the TLF, the VR Helicity (Tang and Liu, 2022) and
The local trace criterion
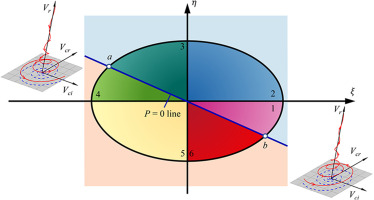
Furthermore, a projection plane with a divided elliptical region is constructed with
Flow structure of tip leakage flow
3D vortical flow structures identified by the
Figure 4.
Vortex Structure Under an Instantaneous Flow Field at the Near-Stall Condition. (a) Isosurface of LTcri = 5 × 10⁶ (s−2) and (b) Isosurface of VR helicity = ±5,000 (s−1).
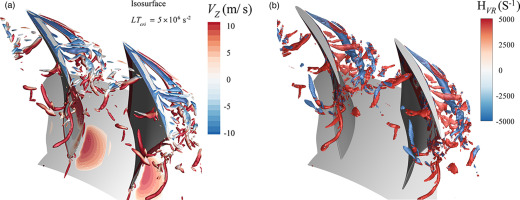
In the graphic of the VR helicity method shown in Figure 4b, the threshold has an absolute value of 5,000 s−1. The isosurface colored in blue represents the negative values, and the isosurface colored in red represents the positive values for the helicity methods. The primary tip leakage vortex corresponds to negative values, and the second vortex corresponds to positive values due to the relative movement of the casing. Strong shear in the blade tip region induces a different rotation direction between the primary and second vortex. Furthermore, the normalized helicity methods can extract both strong and weak vortices.
To further study the unsteady motion of the TLF. A streakline and four pathlines, which are selected to represent typical flow particles in the TLF, are drawn in Figure 5a and b, respectively. The streakline and pathline are extracted by recording the path of fluid particles being released at a series of instantaneous times for a specific period (David and Robert, 1995; Hou et al., 2022). Based on the streakline, the primary TLV behaves as an oscillation in a limited range as it is just generated. Downstream, a helical roll-up occurs, and then the TLV suddenly breaks down. At the same time, flow particles disperse in a much larger region than the primary vortex. Figure 5b displays four pathlines passing through the tip leakage vortex, and the axial velocity colors the pathline. Pathline-1 and pathline-2 represent the particles that pass through the primitive TLV and are kept in the original passage. Pathline-3 and pathline-4 represent the particles passing through the primitive TLV and then enter the adjacent passage. Here, pathline-2 is selected for further analysis in Section 4 because it represents the motion of most particles within the TLF at the tip region.
Figure 5.
Streakline and Pathlines of the TLF Under the Near Stall Condition. (a) Streaklines (released at the TLV core) and (b) Four typical pathlines of TLV.
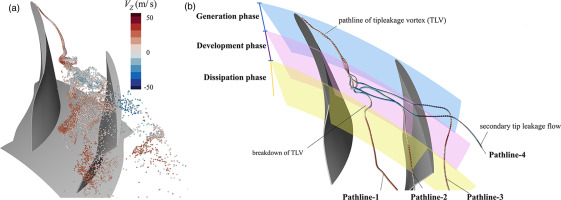
Based on the analysis of the vortex structure and the streamlines, the evolution of the TLV can be divided into three phases (Hou et al., 2022) as shown in Figure 5b. The first phase is the formation or generation phase of the primary TLV, and the second phase is the development of TLV. The breakdown of the primary vortex occurs at the end of the development phase. The third phase is the dissipation process, where the TLF is mixed with the primary passage flow. From the above analysis, the vortex identification method and the streakline can provide much information on a predetermined instantaneous period. However, they cannot extract the spatial-temporal coherent structure for an extended period. As a comparison, the DMD algorithm can deal with the gathered flow field both in space and time, which is crucial to describe the detailed unsteady motion of the TLF.
DMD analysis
This section analyses the 3-dimensional unsteady flow field of this rotor based on the DMD for two single variables at the near stall condition. The time-space matrix for the variable of static pressure P, and the time-space matrix of the radial velocity
Overview of DMD characteristics of the TLF
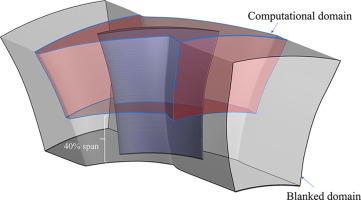
A partial computational domain that contains the tip region is used to reduce the memory requirements, and the location is shown in Figure 6. The total grid number of the computational domain is 3.81 million. In the calculation of DMD, 1,500 snapshots are used, the time interval between two snapshots is
DMD modes in this work are sorted in positive order based on their frequency. This means that the mode with the lowest frequency is marked as mode 1 (the stationary mode), and mode 1 corresponds to the time-averaged flow field in this case. The mode appears in conjugate mode pairs, which share the same altitude and the opposite real value. Mode energy is also calculated to measure the amplitude of the fluctuation corresponding to this mode, which is defined as the time average of the square of each component, as follows:
where n is the total number of discrete grid points m is the total time snapshot of the dataset, in this work, n is 3.81 million and m is 1,500. Details of the dataset parameters of DMD are shown in Table 2.
Table 2.
Dataset parameters of the DMD analysis.
| Case | Variable | Grid number | Total snapshots | Time interval (TINT) | TS/TBP |
|---|---|---|---|---|---|
| 1 | 1,500 | 15.3 | |||
| 2 | 1,500 | 15.3 |
Figure 7a shows the diagram of the mode frequency and mode energy of static pressure, the abscissa represents the mode frequency (normalized by the blade passaging frequency, BPF), and the ordinate represents mode energy. Table 3 lists the details of the mode parameters. The mode with 0.57 BPF has the largest mode energy for static pressure, which accounts for 18.1% in total, and the following are modes with frequencies equal to 0.91 BPF and 3.54 BPF. For the radial velocity
Figure 7.
Mode Characteristics of the Static Pressure and Radial Velocity. (a) Frequency-energy diagram of static pressure P and (b) Frequency-energy diagram of the radial velocity W r

Table 3.
Mode parameters.
| DMD Mode | Frequency (BPF) | Energy proportion | |
|---|---|---|---|
| 13/14 | 0.25 | 4.0% | |
| 17/18 | 0.57 | 18.1% | |
| 27/28 | 0.91 | 6.3% | |
| 103/104 | 3.54 | 6.2% | |
| 10/11 | 0.35 | 10.3% | |
| 26/27 | 0.85 | 7.7% | |
| 42/43 | 1.35 | 18.6% | |
| 70/71 | 2.26 | 47% |
Figure 8a–c show the isosurface of three typical modes shape of the static pressure P (the value rebuilt by the selected mode at an instantaneous). Mode 2 is located at the suction of the mid-span near the surface at the tip region. Mode 13 is located around the trajectory of the primary tip leakage vortex and the pressure surface of the adjacent rotor. Mode 27 is located around the blockage cell near the pressure surface. The frequencies of mode 2, mode 13, and mode 27 are 0.1 BPF, 0.57 BPF, and 0.91 BPF, respectively. Based on the mode shape and location, it indicates that mode 2 corresponds to the pressure fluctuation around the suction surface. Mode 13 corresponds to the fluctuation caused by the oscillation of the primary TLV. Mode 27 corresponds to the fluctuation of the TLV and the interaction between TLF and the pressure surface. Figure 9a–c show the isosurfaces of mode 10, mode 26, and mode 43 of the radial velocity
Figure 8.
Mode Shape of the Static Pressure P (Pa). (a) Mode 2 (0.1 BPF) isosurface of P 2 ′ = ± 20 P 13 ′ = ± 300 P 27 ′ = ± 100

Figure 9.
Mode Shape of the Radial Velocity W r W r 12 ′ = ± 20 W r 26 ′ = ± 10 W r 70 ′ = ± 30

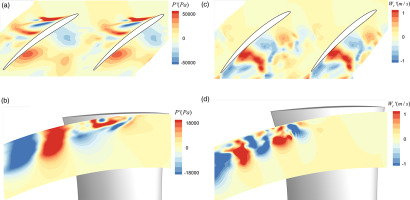
Figure 10a–c show the distribution of mode 13 of the static pressure P at 95% span and a meridian surface. At a 95% span, the area with high amplitude is located approximately around the trajectory of the primary TLV. This indicates that the unsteady motion at the generation phase of the TLV oscillates in the tangential direction. Figure 10b and d show the distribution of mode 26
Mode analysis along the pathline
The mode shapes shown above indicate that the TLF is composed of unsteady flow structures with different temporal-spatial scales. The time-space diagram
Figure 11.
Time-space Diagram of W r W r W r W r W r
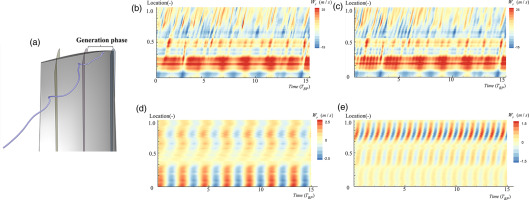
Then, the time-space diagram of the original and rebuilt signal at the development phase of the line is displayed in Figure 12b and c, and the location of the development phase in the streamline is shown in Figure 12a. At this phase, the primary TLV interacts with other flow structures, such as the vortex rope (Hou et al, 2022), and it finally breaks down into vortices with smaller scales. Figure 12c and d show two primary modes rebuilt by modes 13 and 27. This indicates that the frequency of the primary mode is much higher than that of the generation stage, which is approximately 1.35 BPF and 2.26 BPF, respectively.
Figure 12.
Time-space Diagram of W r W r W r W r W r
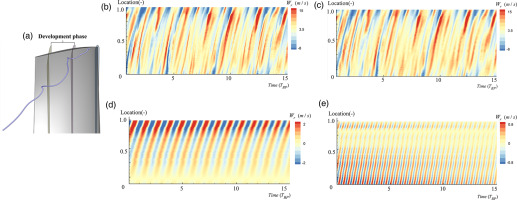
Figure 13b and c show the original and rebuilt spatial-temporal signal
Figure 13.
Time-Space Diagram of W r W r W r W r W r
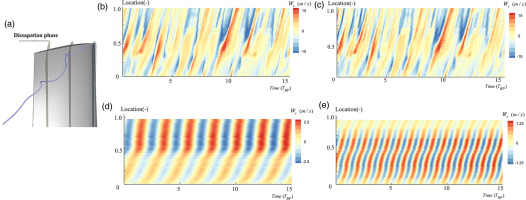
The above analysis indicates that the TLV has three typical unsteady characteristics at its generation, development, and dissipation phases. In the generation phase, the primary TLV has an oscillation motion with a frequency of about 0.35 BPF. Then at the development phase, some small-scale flow structures are generated due to the breakdown of the primary TLV, and the periodicity of the fluctuation is weakened. Finally, the periodicity of the fluctuation is rebuilt in the dissipation phase, with a frequency of approximately 0.85 BPF.
Effect of the DMD mode on the vortex structure and loss generation
This section studies the effect of the DMD mode on the formation of vortex structures and loss generation. The flow field is rebuilt using different numbers of the DMD mode, and then the
To recover the entire velocity vector flow field, DMD is conducted on the variable matrix X, which is defined as follows:
where
Effect of modes on the vortex structure
Based on the results shown in Section 4, the motion of vortices with TLF is unsteady, especially at the development and dissipation phases. On the other hand, the unsteady flow field can be rebuilt by different modes corresponding to different spatial-temporal flow structures. Figure 14 shows the isosurface of
Figure 14.
Vortex Structures at an Instantaneous Flow Field. (a) Rebuilt by mode 1, (b) Rebuilt from mode 1 to mode 3, (c) Rebuilt from mode 1 to mode 6, (d) Rebuilt from mode 1 to mode 100, and (e) Original unsteady flow field.

Based on the LTER indication, vortices with different vortical flow patterns can be distinguished. Figure 14a shows the time-averaged TLV is in the expansion state as it just generates, and then the TLV turns into the compression state at approximately 10% chord downstream. As the mode number used to rebuild the flow field increases to three, vortices in the compression state occur at the end of the primary TLV. Those small-scale unsteady vortices recovered by mode 3 to mode 6, primarily located in the vortex interaction and breakdown regions, are in the expansion state.
Effect of modes on the entropy production
Vortex flow can produce irreversible viscosity loss and, therefore, has a large effect on the efficiency of the rotor. The loss induced by viscosity can be quantitated by the viscosity entropy production rate (Moore and Moore, 1983), which is defined as follows:
where
Conclusion
This work investigates the unsteady tip leakage flow of a rotor under the near-stall condition. First, DMD is used for the 3D flow field calculated via DDES to extract the spatial-temporal structures. Next, the unsteady characteristics are analyzed based on the different modes. Finally, the effect of flow unsteadiness on the vortex structure and loss generation is analyzed. The conclusions of this work can be drawn as follows.
In the generation phase of the TLV, the unsteadiness behaves as the oscillation of the primary TLV. In the development phase of TLV, the unsteadiness of TLV behaves as the interaction between the primary TLV and other vortex structures. In the dispassion phase, TLV finally breaks down into small-scale unsteady vortices.
Unsteady motions of the tip leakage vortex can be reflected by the different DMD modes. The unsteady fluctuation of the vortex rope has a relatively lower frequency, and it is reflected by the first 2 modes. The unsteady motion of the main TLV has the highest fluctuation amplitude and corresponds to pressure mode 13. DMD can also provide information about the frequency and amplitude of different unsteady motions.
Vortex structures and loss generations can be divided into steady and different unsteady components through DMD. In the generation phase, entropy production is primarily composed of its steady component. Conversely, vortex structure and loss generation are mainly composed of unsteady components after the primary TLV breakdown.
Nomenclature
BPF
blade passing frequency
TBP
blade passing time
TLF
tip leakage flow
TLV
tip leakage vortex
W
relative velocity
entropy production
f
frequency
vi, vj, vk
velocity components for the spatial point
velocity fluctuation
molecular viscosity [kg/(m·s)]
vorticity vector
strain rate tensor
eigenvector of
eigenvector of
eigenvector of
r
radial direction
z
axial direction
t
tangential direction

