
Introduction
In practical operation, inlet distortion is one of the key factors that induce flow instability of compressor. Since the compressor is a component directly connected with the air inlet, the influence of inlet distortion is remarkable in the compressor flow field and performances. Actually, the compressor performances and stable operating range will be greatly degraded. Therefore, researchers have carried out a series of studies on the impact of inlet distortion on the compressor stability (Li et al., 2020) and the feasibility of stability improvement methods (Dong et al., 2015) under the inlet distortion conditions.
The inlet distortion is mainly manifested in the non-uniformity of the inlet parameters, which can be divided into total pressure distortion, total temperature distortion, static pressure distortion, and swirl distortion. It could also be clarified into steady and unsteady distortions according to whether the distortion parameters change with time (Hu, 2015). Particularly, the rotating distortion is a kind of unsteady total pressure distortion, and its corresponding physical background is as follows. In a dual-rotor or multi-spool compressor, when the rotating stall takes place in the low-pressure compressor, the stall cell will rotate circumferentially and propagate to the high-pressure compressor, leading to the rotating distortion at the high-pressure compressor inlet. In detail, when the high- and low-pressure rotors rotate in the same direction, the rotation distortion direction is the same as that of the high-pressure compressor. For the contrarotating engine, the rotating distortion direction is opposite to that of the high-pressure compressor. Since rotating distortion always takes place within the compressor system, corresponding researches have great value for solving the aerodynamic stability problem of a multi-rotor compressor.
A series of experimental studies have been carried out on rotating distortion. Schaffler and Miatt (1985, 1986) analyzed the aerodynamic interactions between the fan and the high-pressure compressor on a low bypass ratio engine. They found that even in a stable case, there was a pressure fluctuation at its outlet. The amplitude of the pressure fluctuation gradually increased during the throttling process and had a serious impact on the stability of the high-pressure compressor. The surge margin of the high-pressure compressor decreased by up to 22%. Longley et al. (1996) studied the influence of rotating distortion on the aerodynamic stability. They found that for the compressor with modal -type stall, there is a peak value of the stability margin attenuation, where the distortion plate speed was the same as the stall cell speed. For the spike-type compressor, there are two peaks, the second one of which corresponds to the propagation velocity of the stall cell. Resonance theory was adopted to interpret the mechanism of rotating distortion on compressor stability. Then, Peters et al. further conducted an experimental study on a five-stage axial flow compressor, and unrevealed the corresponding relationship between the rotation frequency of the distortion generator and the peak margin loss of the compressor system. Zhang (2007) and Nie et al. (2006) carried out an investigatoin on a low-speed single-stage compressor and found that the influence of rotating distortion on compressor stability is closely related to the rotational speed of the distortion plate. He also explained why the compressor stability margin deteriorated most seriously under the condition of rotating distortion which rotates with 0.5 forward rotor speed. Mao (2015) also conducted an experimental study on the mechanism of compressor instability, and proposed a model to predict the impact of rotating distortion on compressor stability. In general, above studies have systematically investigated the influence of rotating distortion, but there is hardly any detailed measurement of compressor flow field.
On the other hand, although numerical calculation is an important means to predict aerodynamic stability due to its high feasibility, there are few public reports on the numerical simulation of the effects of inlet distortion. In the late 1980s, Hynes et al. (1987) conducted a preliminary calculation and analyzed this problem through the characteristic analysis method. Zhang et al. (2009) carried out a two-dimensional incompressible simulation based on Moore Greitzer theory (Greitzer and Moore, 1986; Moore and Greitzer, 1986) to predict the effect of rotating inlet distortion. Later, Tu and Hu (2011) carried out a three-dimensional unsteady simulation based on the actuator disk model, which aimed at predicting the dynamic stall characteristics of the compressor and the effect of total pressure distortion on the compressor stability.
Although comprehensive experimental and numerical researches have been conducted concerning with the compressor aerodynamic stability, the physical background has to be further revealed. The mode decomposition methods, i.e., proper orthogonal decomposition (POD) and dynamic mode decomposition (DMD) could reorganize the unsteady flow field into discrete spatial modes. Therefore, the in-depth flow mechanism could be detected based on the observation of the leading modes. In the field of compressor aerodynamic stability analysis, several investigations have been conducted. For example, DMD method was applied to instantaneous flow fields of a centrifugal compressor in (Li et al., 2021). Intensive pressure fluctuations concentrated in the diffuser throat as a result of the detached shock. Meanwhile, it is found that the BPF/2BPF (blade passing frequency) corresponded to the impeller-diffuser interaction. DMD method was also adopted to extract the most dominant flow structures in a turbocharger centrifugal compressor volute under design and mild surge conditions. DMD results of a cantilevered compressor cascade showed that there existed three dominant periodic flow structures: the oscillation of the leakage vortex, a circumferential migration of a breakdown induced vortex and the fluctuation of the passage vortex. Both POD and DMD methods have been performed to analyze the flow structures appearing with surge. For the lowest mass-flow rate operating condition, low frequency modes describing the filling and emptying processes during surge have been found.
Therefore, mode decomposition method could play an important role in the stall mechanism study under the circumstances of rotating distortion. To this end, three-dimensional unsteady numerical simulation of rotating distortion was carried out for a low-speed single-stage compressor in the present study. The DMD methods have been used to decompose the unsteady flow field data within the compressor to obtain the dynamic mode frequencies and the corresponding mode spatial distribution. Then, the mechanism of compressor instability under rotating distortion condition and the characteristic flow field structures during stall development are further revealed.
Methodology
The three-dimensional model of a low-speed axial compressor with rotating distortion inflow is shown in Figure 1. Among them, I–IV is the entrance part. In detail, II is the position of the distortion plate, which is 750 mm upstream of the leading edge of the rotor. The 3D geometry of the distortion plate could be referred to Figure 2. III is the grid transition section; IV is the connection section with the rotor. V and VI indicate the rotor and stator sections, while VII is the exit section. The detailed parameters of our compressor are listed in Table 1. The compressor rotor has a design speed of 2,400 rpm and a design flow rate of 2.9 kg/s.
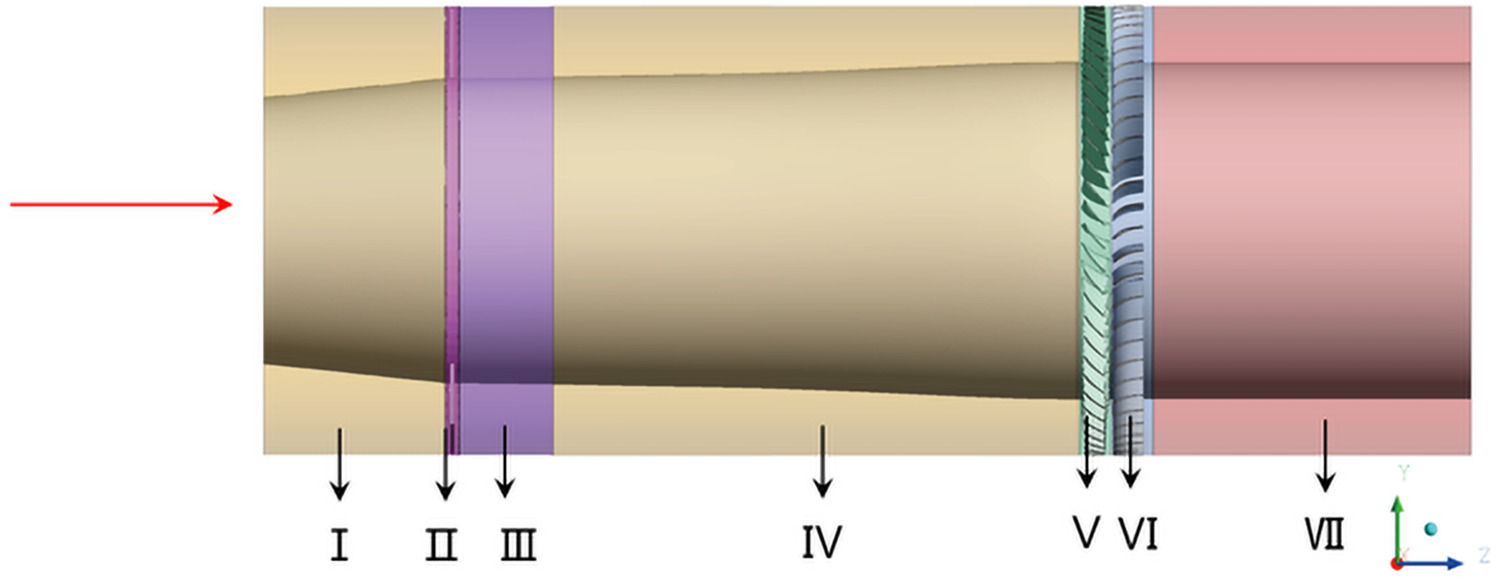
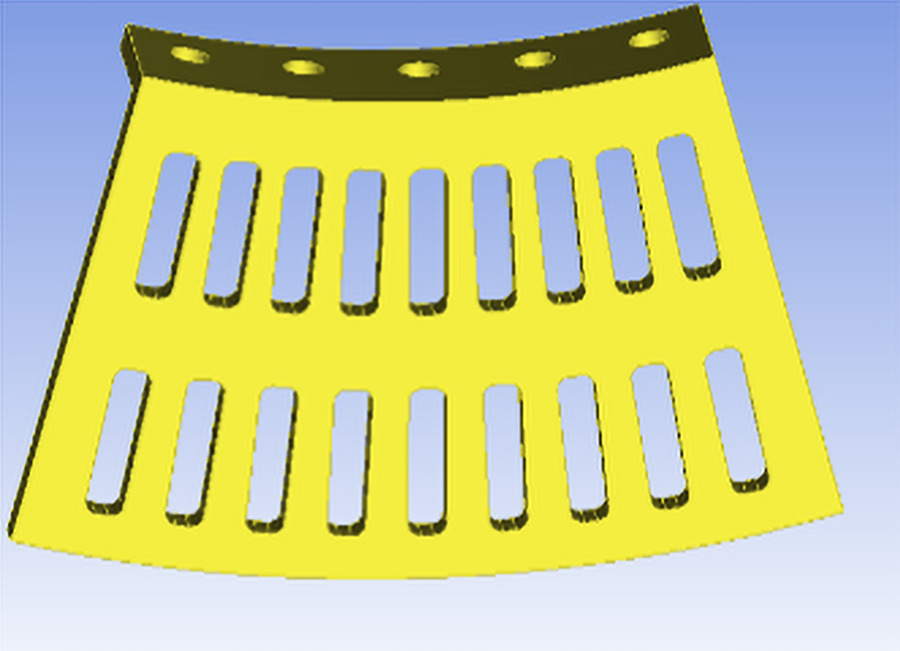
Table 1.
Key parameters of the compressor
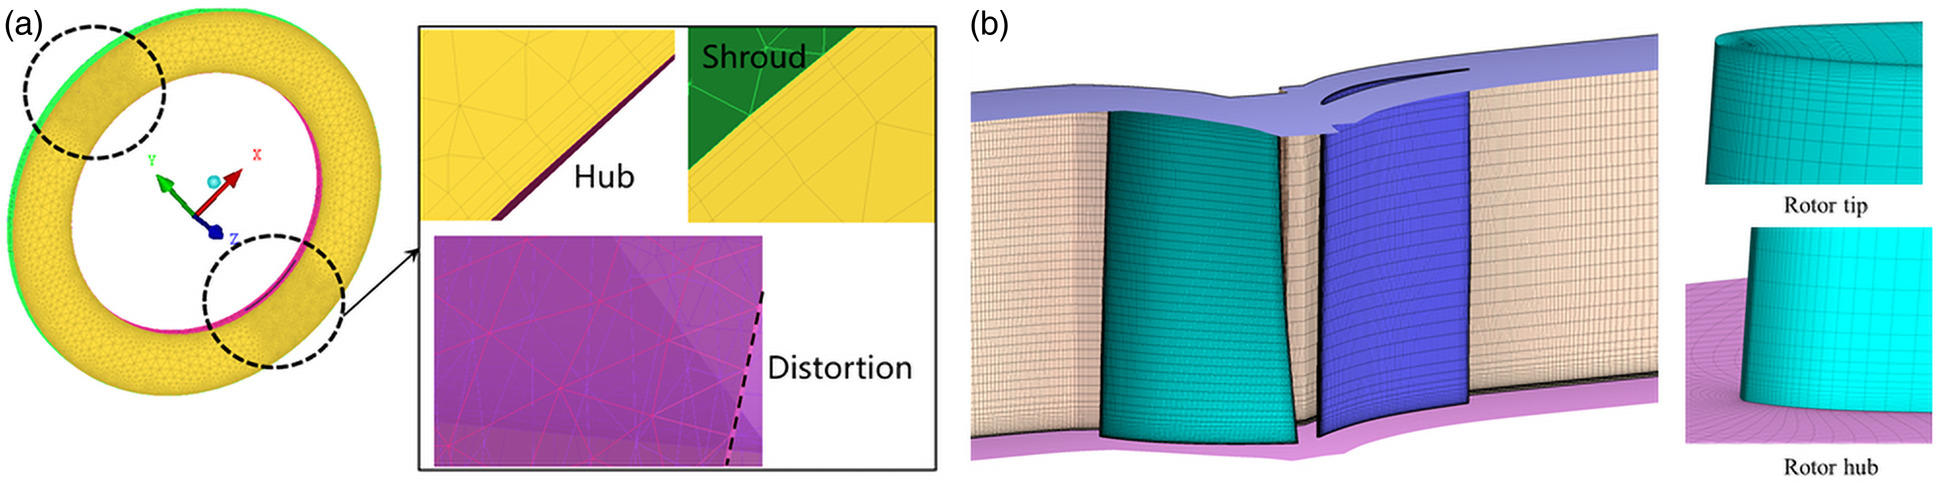
The mesh near the hub and shroud of the distortion plate are shown in Figure 3a. ICEM software is adopted to generate unstructured mesh near the distortion plate. The grid height of the first layer is around 0.075 mm, corresponding to y + ≈11. TurboGrid software is selected to generate the mesh near the rotor and stator in Figure 3b. The requirement of y + ≈11 is also implemented, leading to the first layer height of 0.038 mm. According to the mesh-independence study in the previous work (Zhang, 2020), there are 55 grid points in the spanwise direction with 15 grid points located in the tip clearance. Meanwhile, there are 120 grid points distributed in the streamwise direction. In general, the grid number within a single passage is about 0.6 million, while the total number within the full annulus is 37 million.
Figure 3.
Grid Distribution of the Distortion Plate and the Blade Model. (a) Distortion plate and (b) Blade passage.
The boundary conditions of the inlet are total temperature T = 288.15 K and total pressure P = 1 atm. The outlet boundary condition is defined by the averaged static pressure. Adiabatic and no-slip conditions are imposed on the wall surface, while periodic condition is implemented on the lateral boundaries for single-passage simulation. Sliding mesh approach is applied for full-annulus URANS calculations to model the rotating/stationary interfaces. The time step corresponds to one tenth of the blade passing frequency, and the convergence of residual is defined as 1.0 × 10⁻⁵. There are at most 30 iterations within one physical time step. k−ε turbulence model is adopted in all simulations, which is preferable for its robustness.
Results and discussion
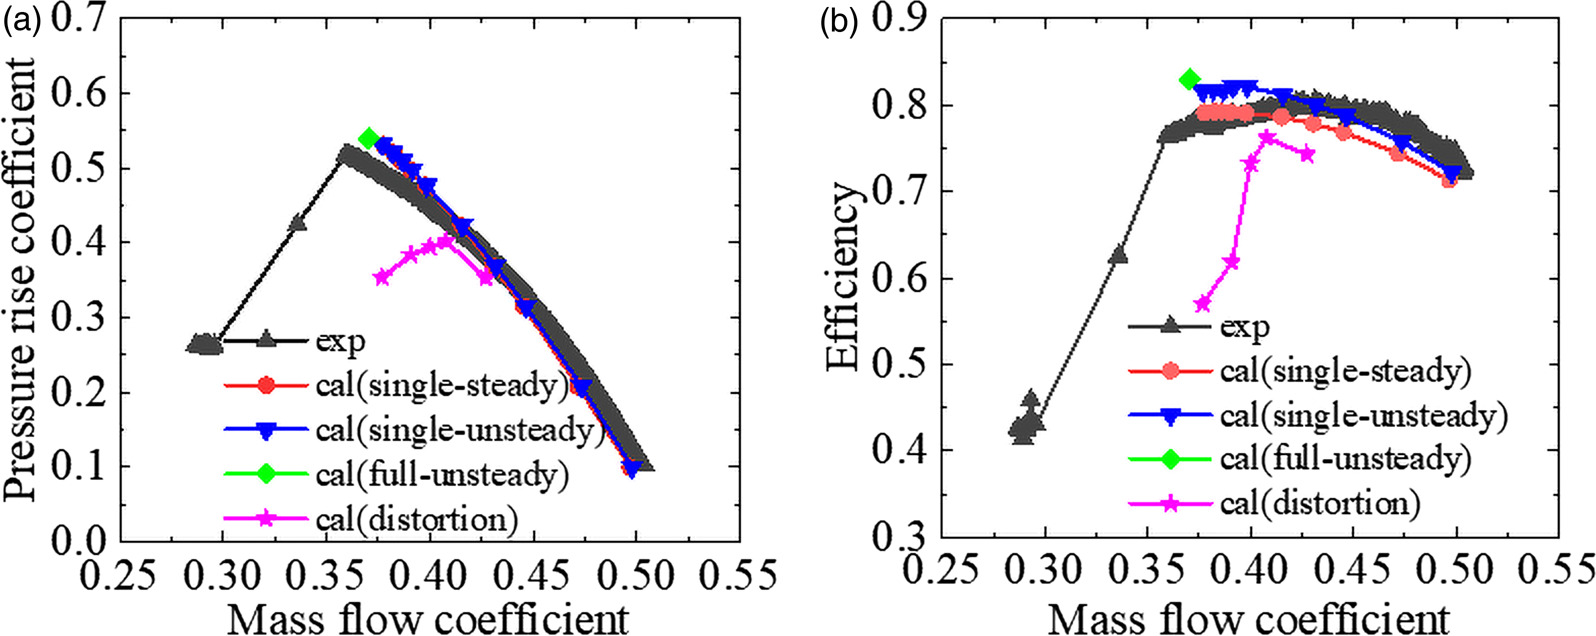
The compressor performance with uniform inflow and rotating distortion is presented in Figure 4. The black triangles represent the experimental results with uniform inflow.The numerical simulation of the low speed axial flow compressor with uniform inflow is carried out using single-passage steady, single passage unsteady, and full-annulus unsteady methods respectively. It can be seen that the relative error of static pressure rise coefficient obtained by numerical simulation and experiment is less than 3%, while the error of isentropy efficiency is no more than 6%. A more detailed comparison of experimental and numerical simulation of rotor outlet total pressure and axial velocity has been made in Zhang (2020). This adds to the confidence that the flow field with rotating distortion of this compressor can be predicted with CFD. The results of full-annulus unsteady calculation with a pair of rotating distortion plates are shown by the pink star in the figure, which include the near-stall condition and the rotating stall process. It can be found that rotating distortion can significantly reduce the stall margin of compressor, and the compressor performance is accordingly deteriorated.
Figure 4.
Compressor Performance with Uniform Inflow and Rotating Distortion. (a) Pressure rise coefficient. (b) Isentropic efficiency.
Stall mechanism of the compressor with uniform inflow
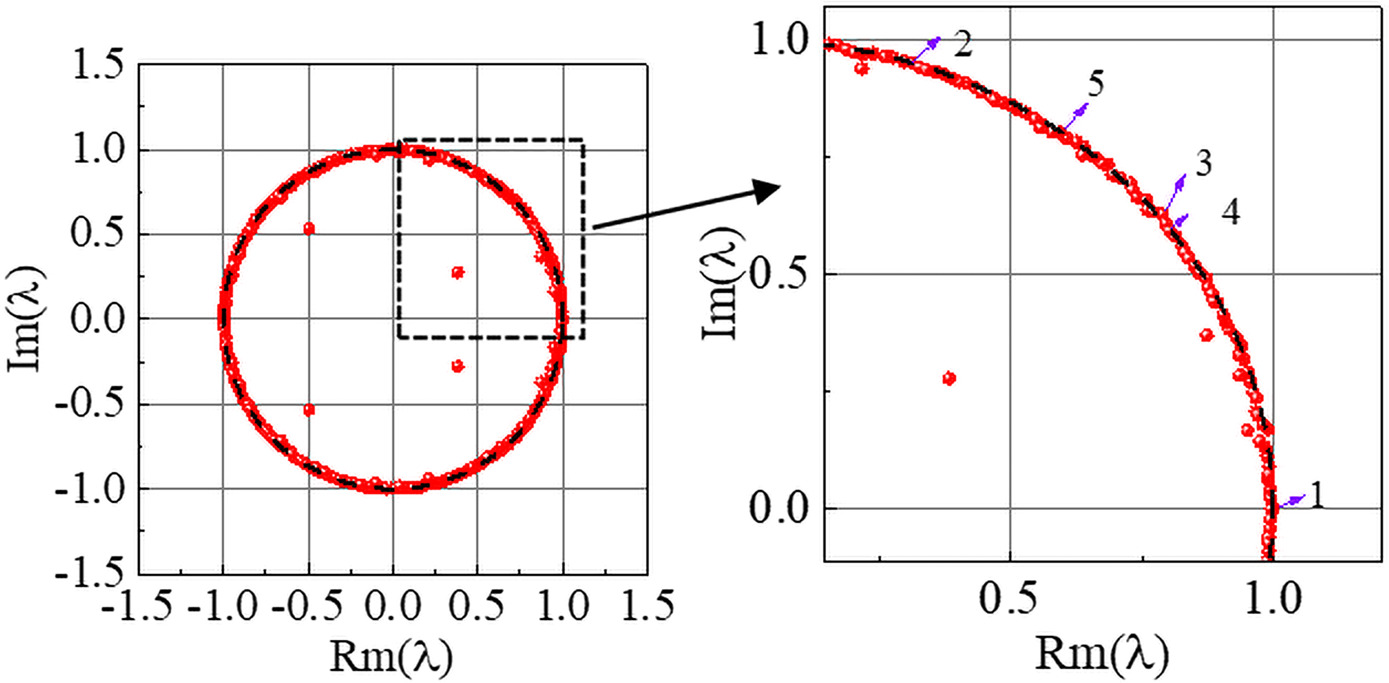
To clarify the flow structure and dynamic characteristics of the flow field in the onset of stall inception and the process of propagation of the stall cells, the full-annulus URANS results need to be resolved to obtain the main mode of the flow field. Therefore, based on the contour of static pressure at 98% span under near-stall condition, a total of 385 snapshots are extracted for DMD anslysis with uniform inflow. To obtain converged modes, the time step between the adjacent snapshots is chosen as 5 physical timesteps. Figure 5 illustrates the energy spectra of the DMD results. The horizontal axis is the frequency of the DMD mode, and the vertical axis is the energy ratio of the corresponding DMD mode. The frequency of the major modes is listed in Table 2. It can be seen that the energy ratio of 0.3–0.6 times BPF frequency band is higher than that of other modes. This frequency band is identical to the characteristic frequency of unsteady tip-leakage flow observed in axial compressors. The distribution of DMD eigenvalues on the complex plane at near-stall condition is shown in Figure 6. As shown by the black dotted line box in the figure, the position of the third order mode has been distributed outside the unit circle, indicating that there is a bit of critical unstable flow structure in the flow field.
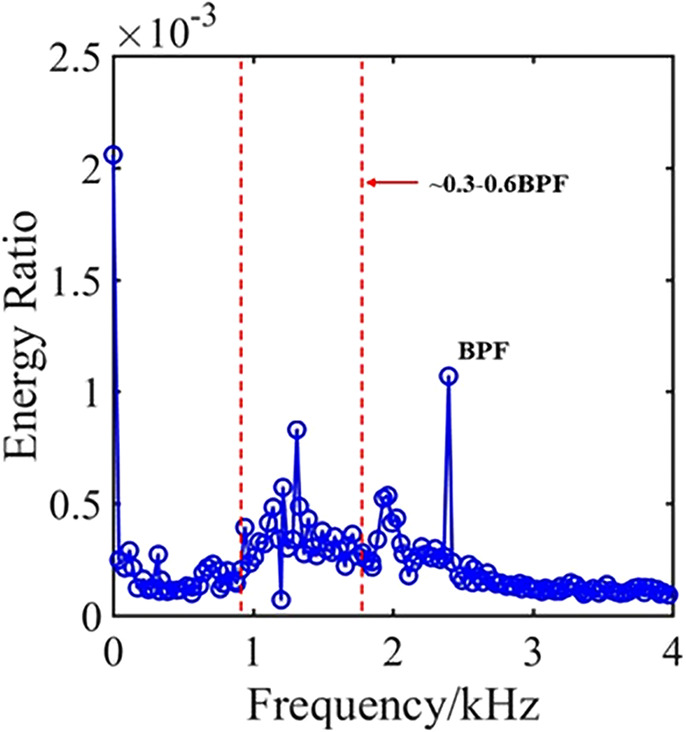
Table 2.
Frequency of the first four order mode at NS condition with uniform inflow
| Mode | Frequency |
|---|---|
| 1 | 0 |
| 2 | BPF |
| 3 | 0.55BPF |
| 4 | 0.5BPF |
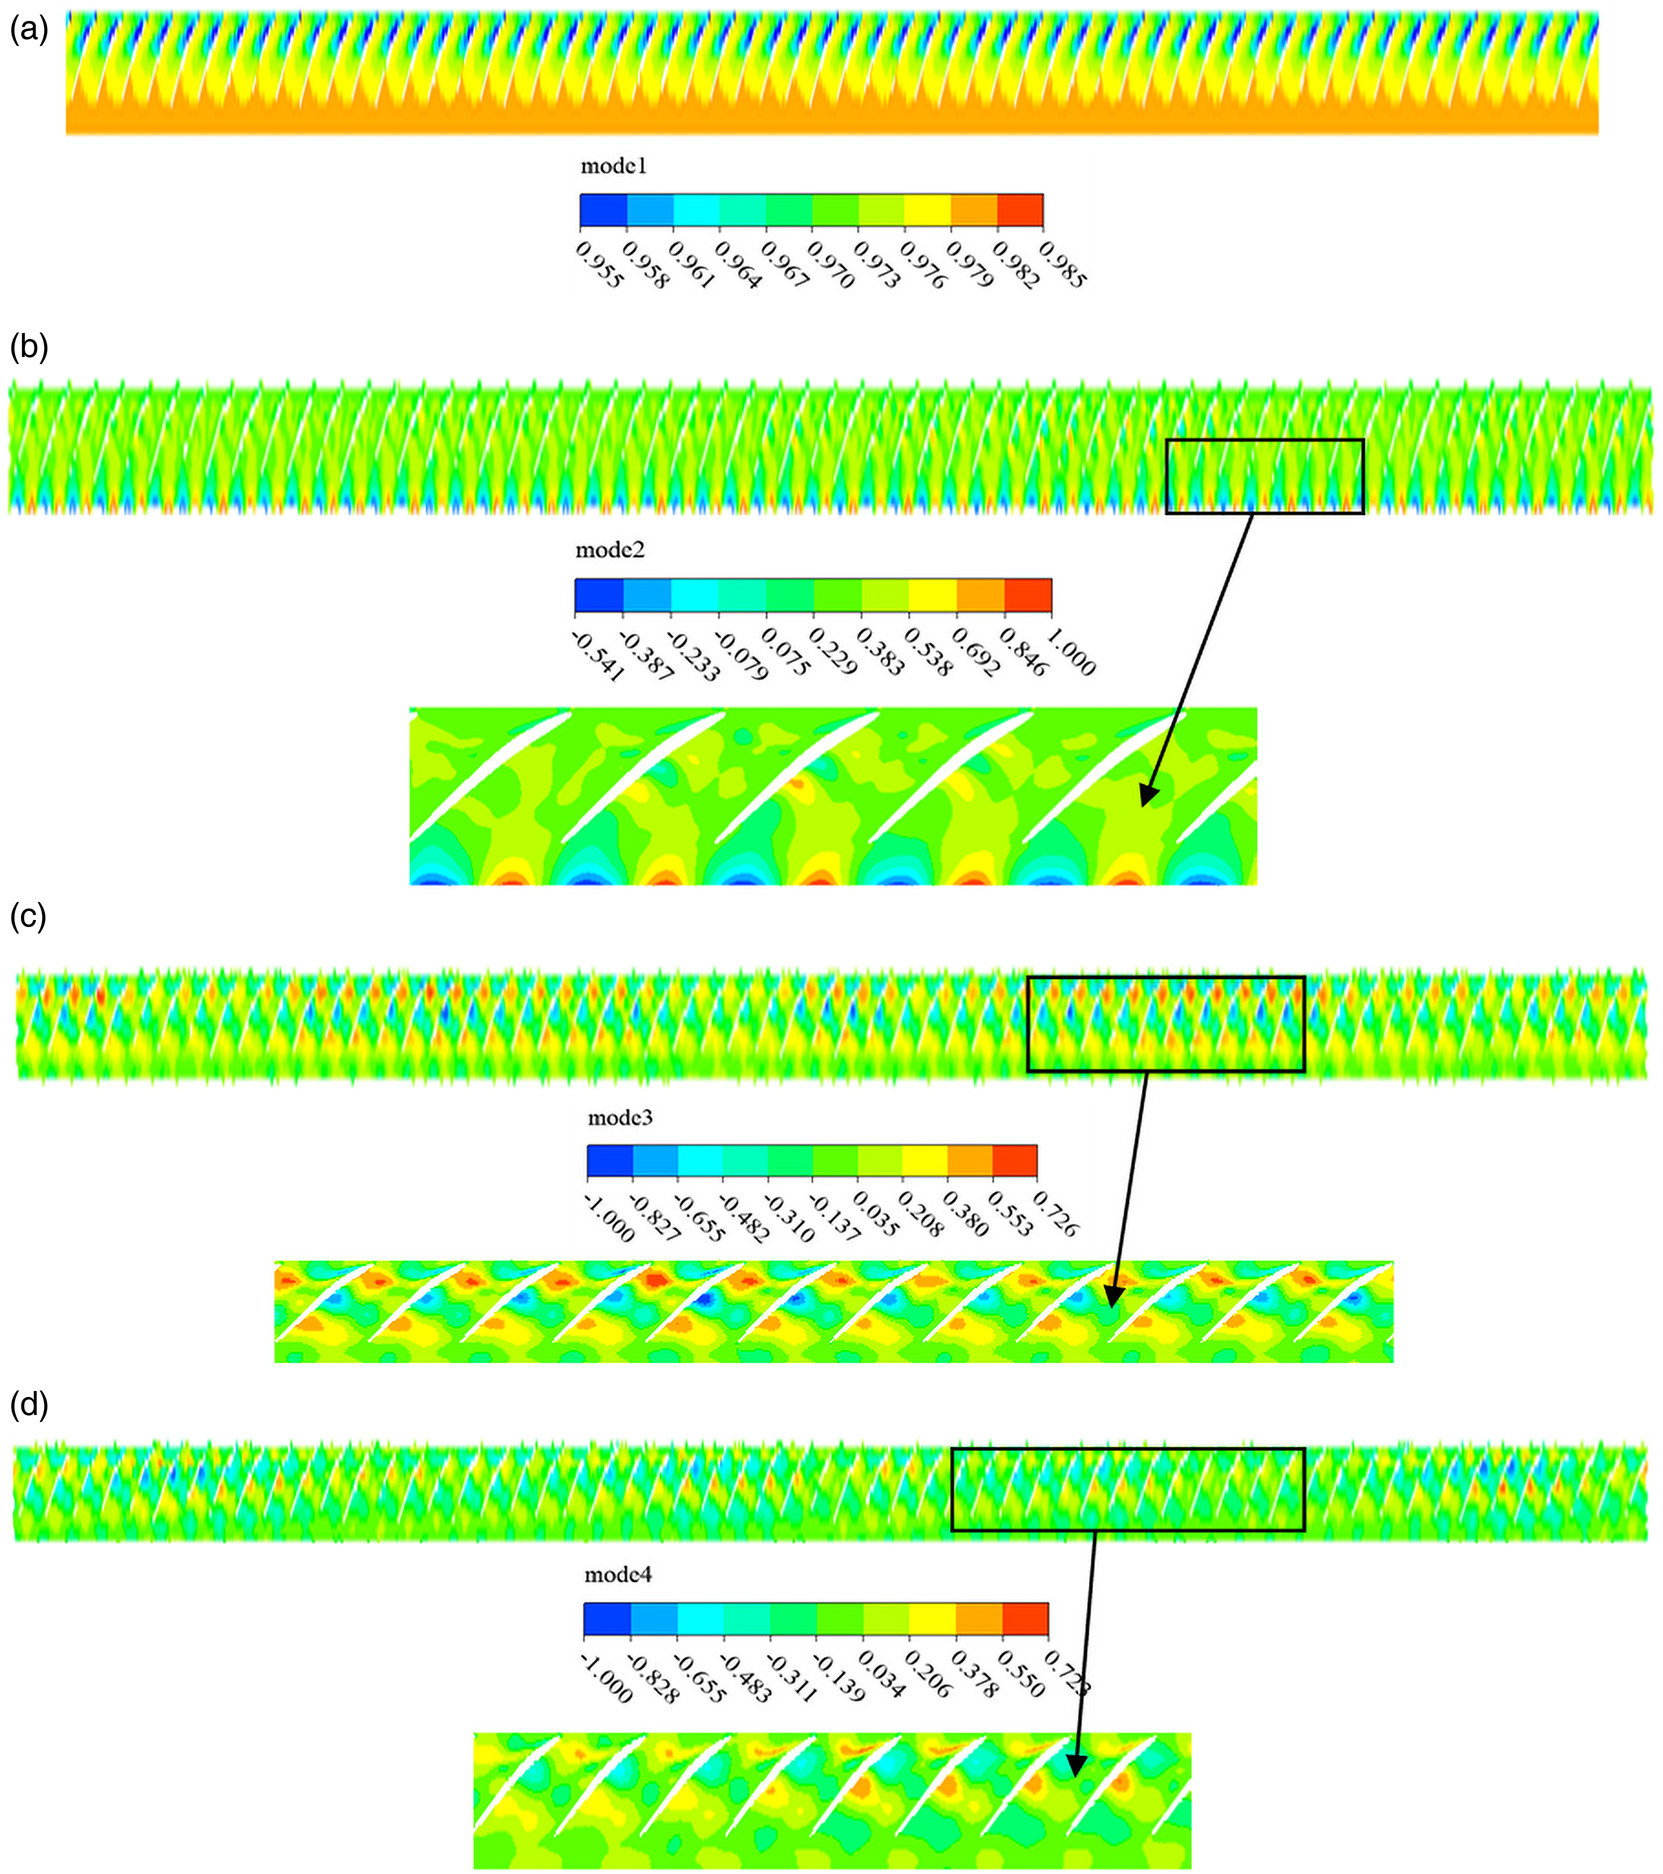
The static pressure contours of first four order modes at near-stall condition are presented in Figure 7. In Figure 7a, the distribution of pressure field in each passage is almost identical, and the first mode represents the averaged information of the unsteady flow field within a fluctuation period. The actual flow field can be regarded as a low-dimensional approximate flow field obtained by imposing various dynamic modes on the basic structure of the first mode. The second order mode represents the blade passing frequency. As shown in Figure 7b, the pulsation intensity of this mode reaches its maximum at the rotor outlet in each blade passage, and exhibits an alternating structure of jet flow and wake along the circumference. It is believed that the BPF mode is caused by the rotor–stator interaction, which proves that the DMD method is effective in this paper. The frequency of the third mode is 0.55BPF, which corresponds to the critical unstable mode in the flow field. From the leading edge of the blade, an alternating distribution of high- and low-pressure structure is formed along the pressure surface of the blade, resulting in the fluctuating characteristics of the flow field in the tip region. It can be seen from the fourth mode in Figure 7d that the disturbance formed by high and low-pressure region moves in the circumferential direction.
Figure 7.
Static Pressure Contours of First Four Order Modes at Near-stall Condition. (a) First order mode, (b) Second order mode, (c) Third order mode, and (d) Fourth order mode.
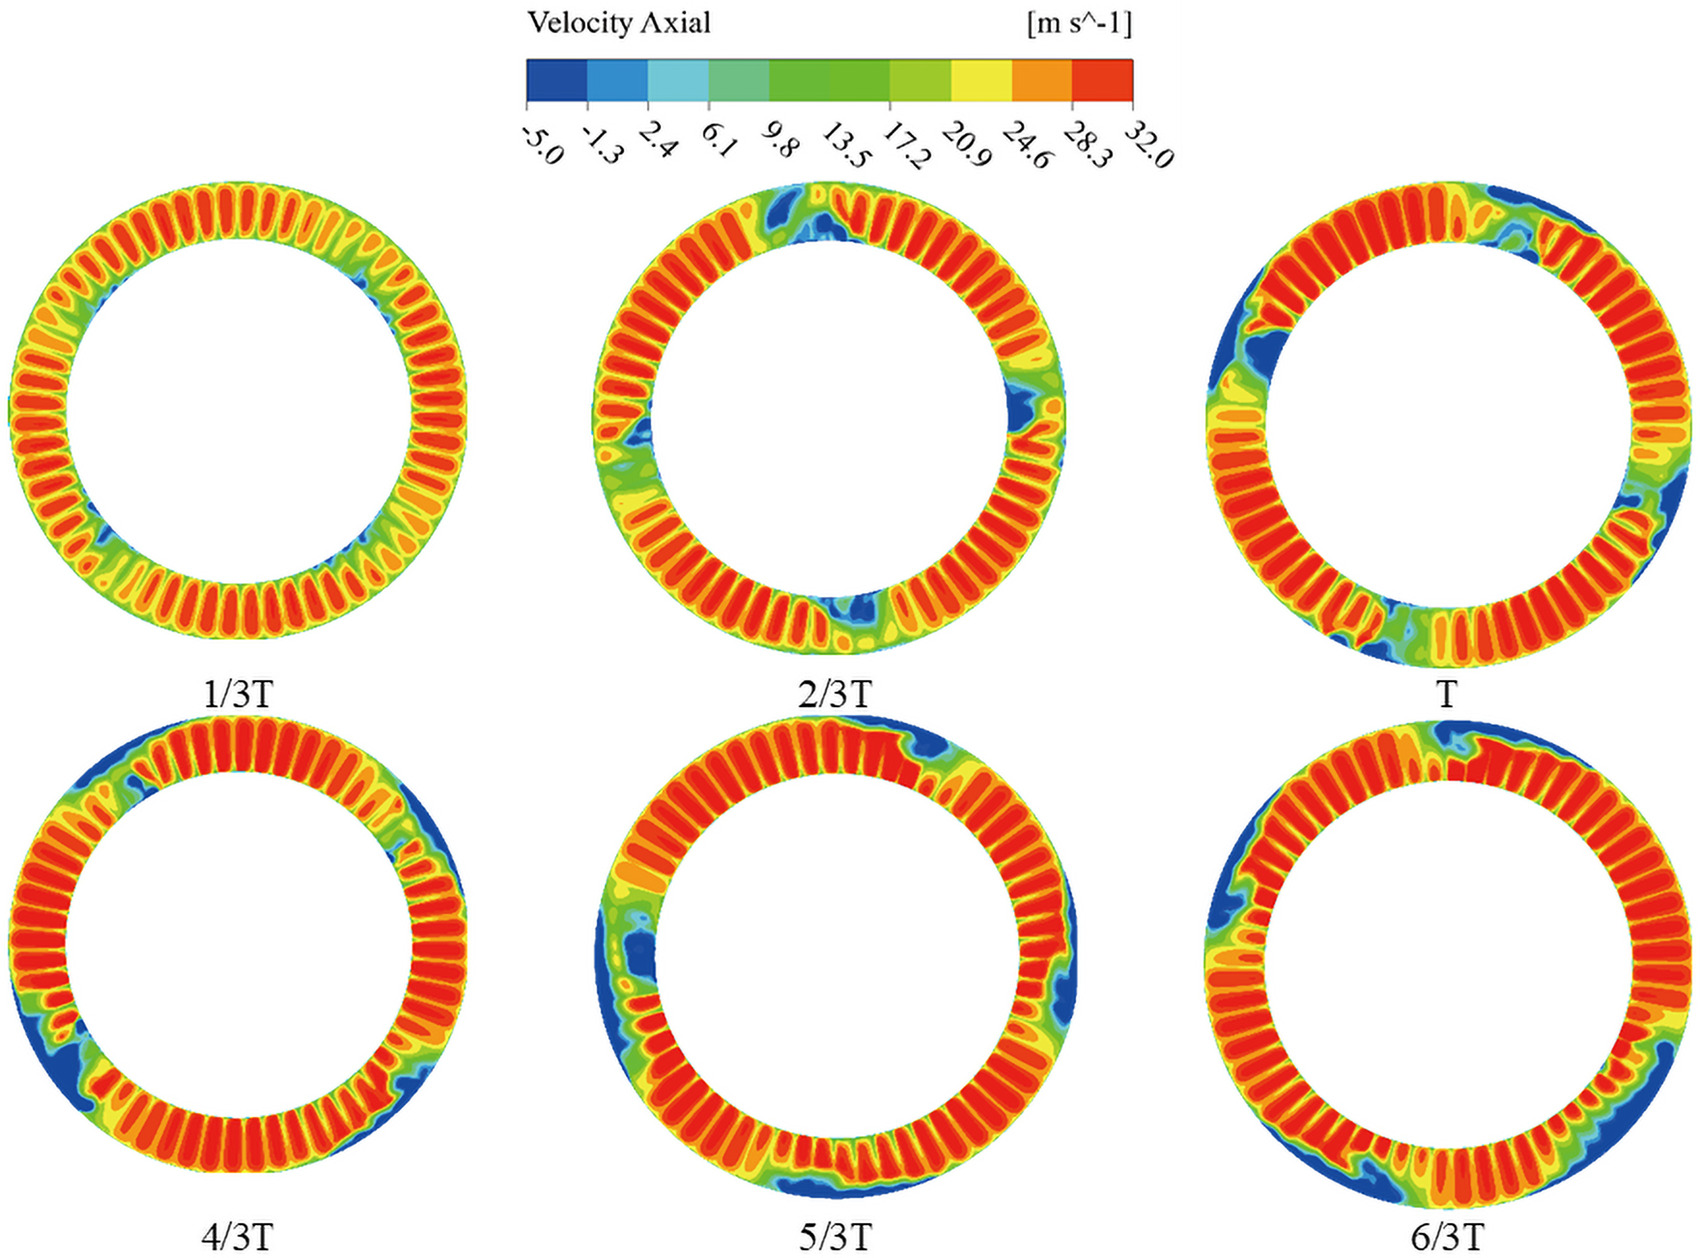
The throttle model is adopted at the compressor outlet to simulate accurately the stall process of the compressor. Figure 8 shows the contour of axial velocity at different time during stall process, which is extracted at the leading-edge (LE) section of the rotor with uniform inflow. Wherein, the rotating direction of rotor is counterclockwise. It can be found that four low-velocity regions first appear at the rotor hub, then gradually transmit to the tip of the blade and continue to develop as they propagate. Consequently, four stall cells occupying 6–7 blade passages are observed.
To identify large-scale flow structure in the stall process, 600 snapshots of the static pressure contour in total are extracted for DMD anslysis at rotor LE, and the time step
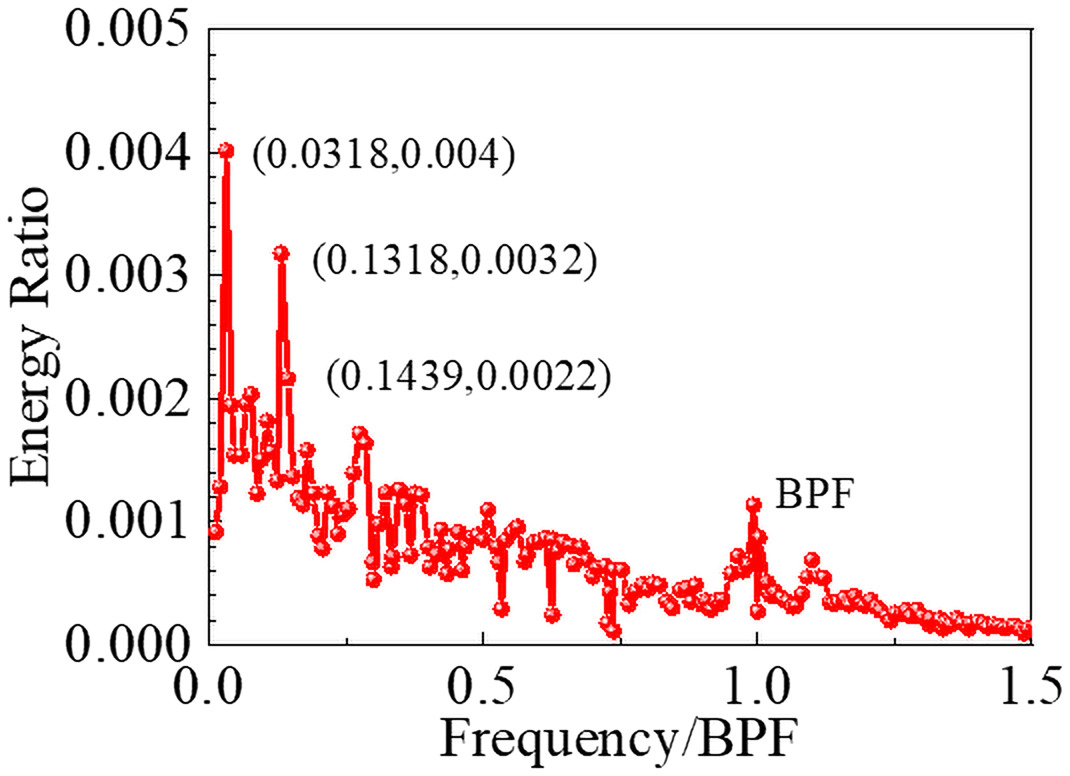
Figure 10.
Distribution of DMD Eigenvalues on the Complex Plane at Stall Condition. (a) DMD eigenvalues and (b) Enlarged view.
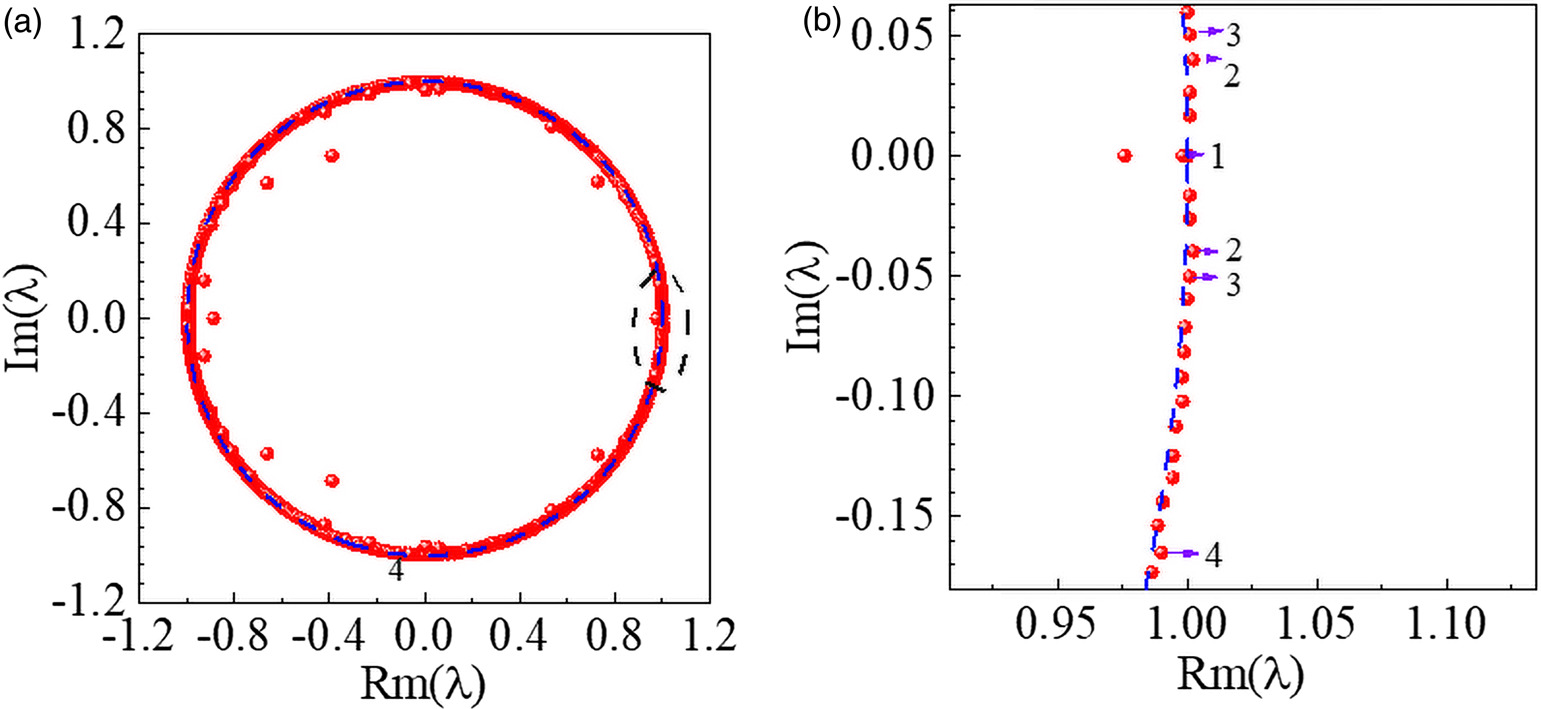
Table 3.
Frequency of the first four order mode at stall condition with uniform inflow
| Mode | Frequency | Energy ratio |
|---|---|---|
| 1 | 0 | 0.761 |
| 2 | 0.0316BPF∼2RF | 0.004 |
| 3 | 0.1318BPF∼8RF | 0.0032 |
| 4 | 0.1439BPF | 0.0022 |
The static pressure contours of first four order modes at rotor LE section are presented in Figure 11. In addition, Figure 12 further presents the static pressure contours of the second and third order modes at 98% span. In Figures 11b and 12a, there are four pressure disturbances similar to the four stall cells, which woefully lead to the blockage of the entire flow passage. Based on the frequency of the second mode and the number of stall cell, it can be inferred that the circumferential propagating speed of stall cell is about 50% of the shaft speed. As shown in Figures 11c and 12b, there exist a pair of large-scale high-low pressure regions in the whole blade passage, constantly forming a pressure disturbance in the circumferential direction. A large number of paired small-scale static pressure disturbances appear along the circumferential direction of the compressor in Figure 11d. In other words, the distribution of the flow structure corresponding to the higher-order mode is more disordered, and the compressor flow field is seriously deteriorated.
Figure 11.
Static Pressure Contours of First Four Order Modes at Stall Condition with Uniform Inflow. (a) First order mode, (b) Second order mode, (c) Third order mode, and (d) Fourth order mode.
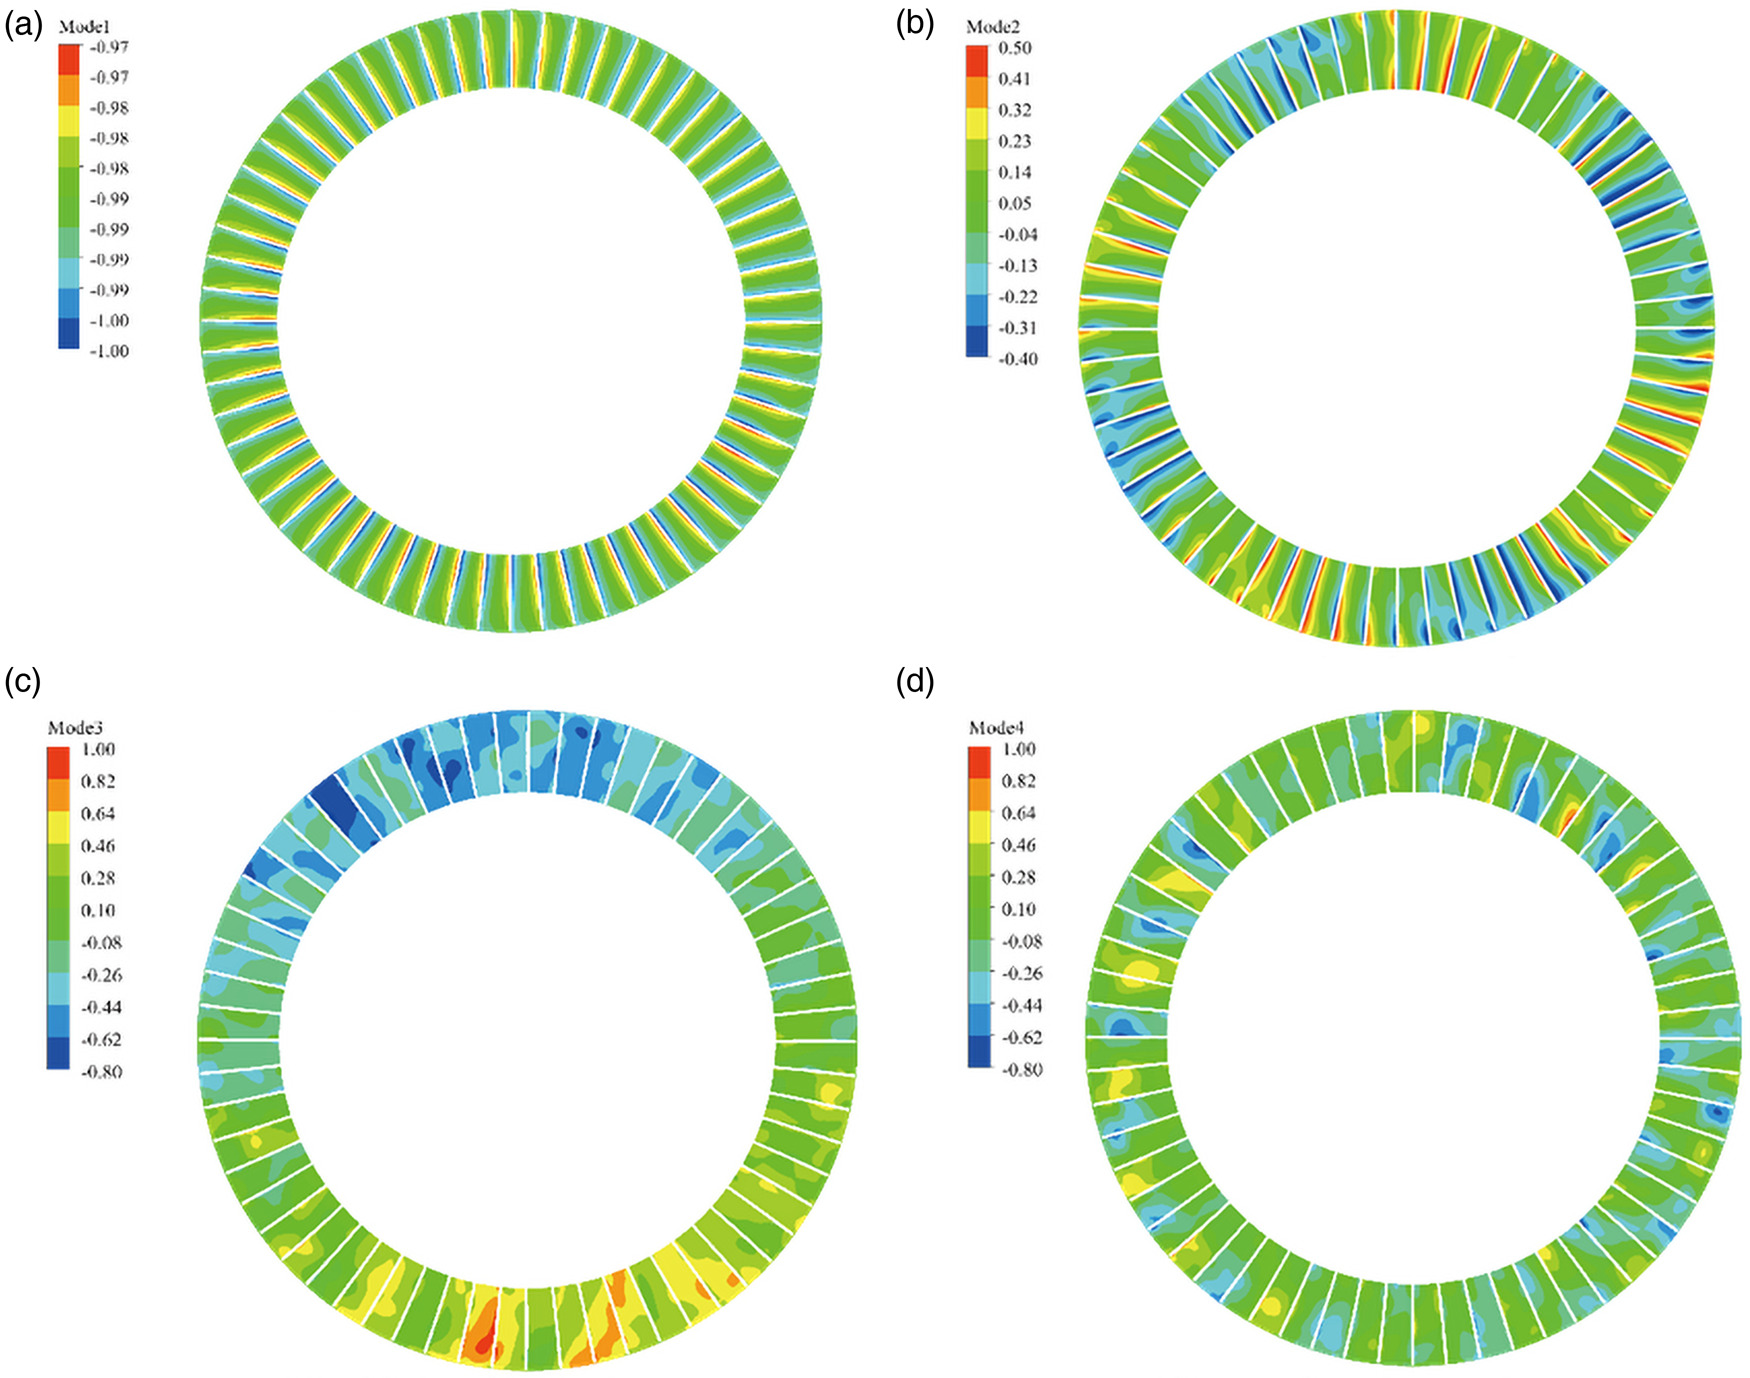
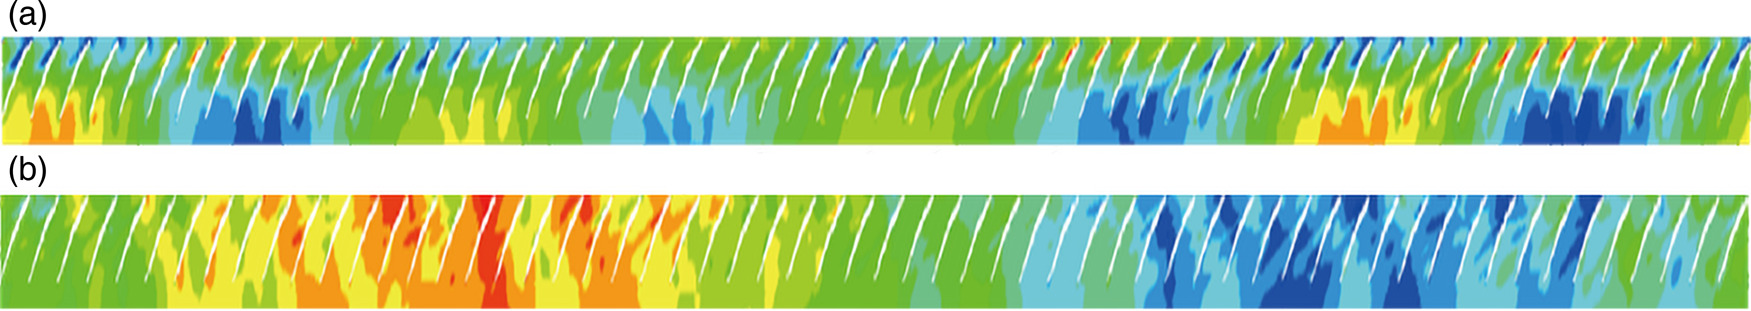
Figure 12.
Static Pressure Contours of Second and Third Mode at 98% Span. (a) Second order mode and (b) Third order mode.
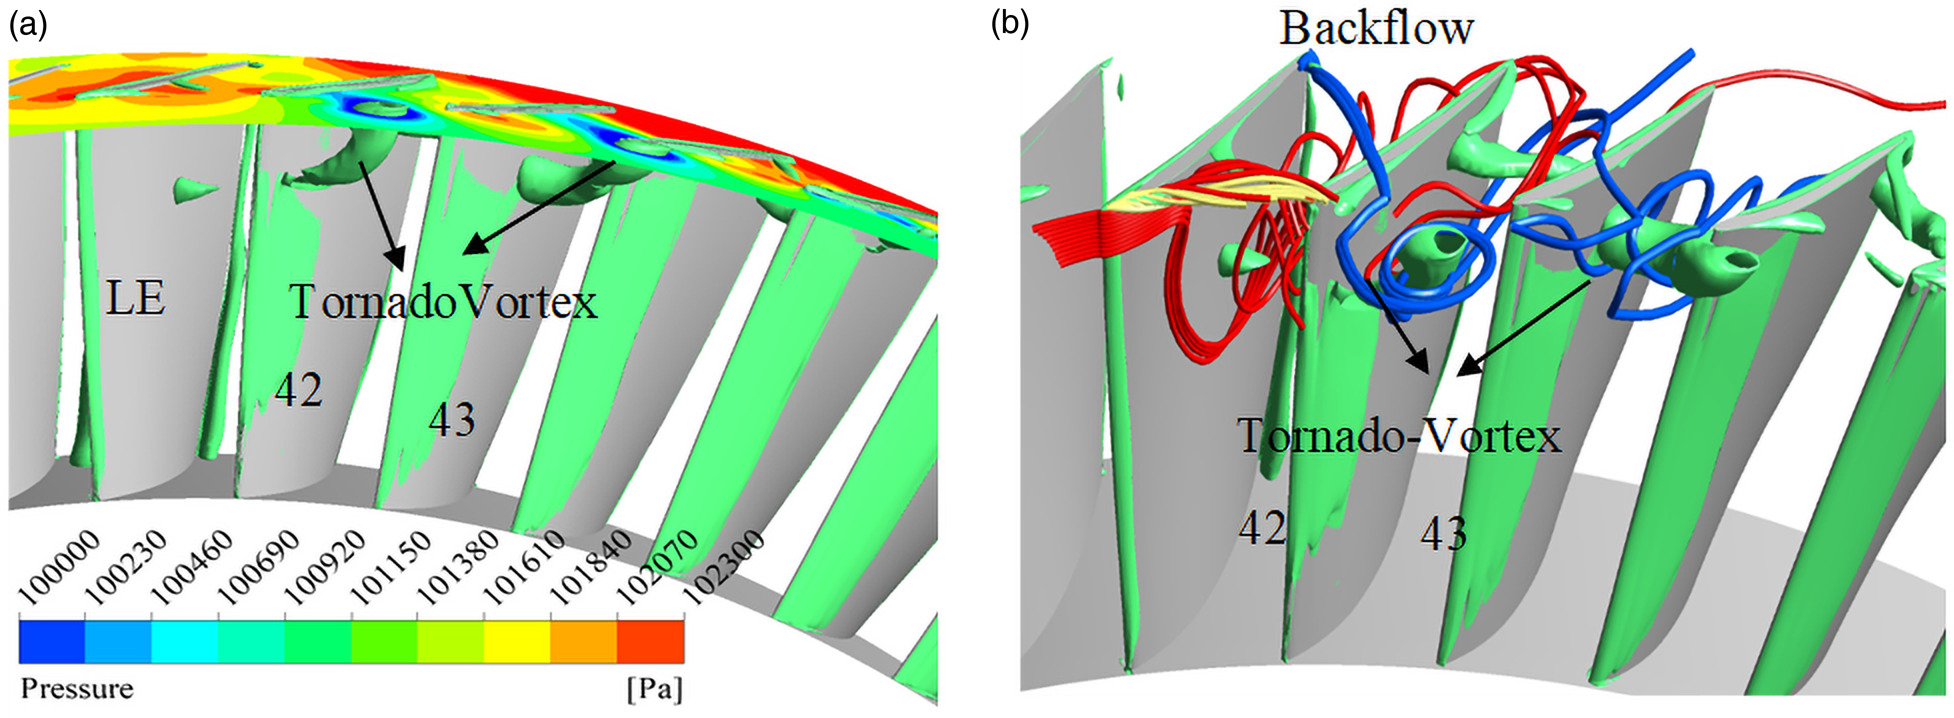
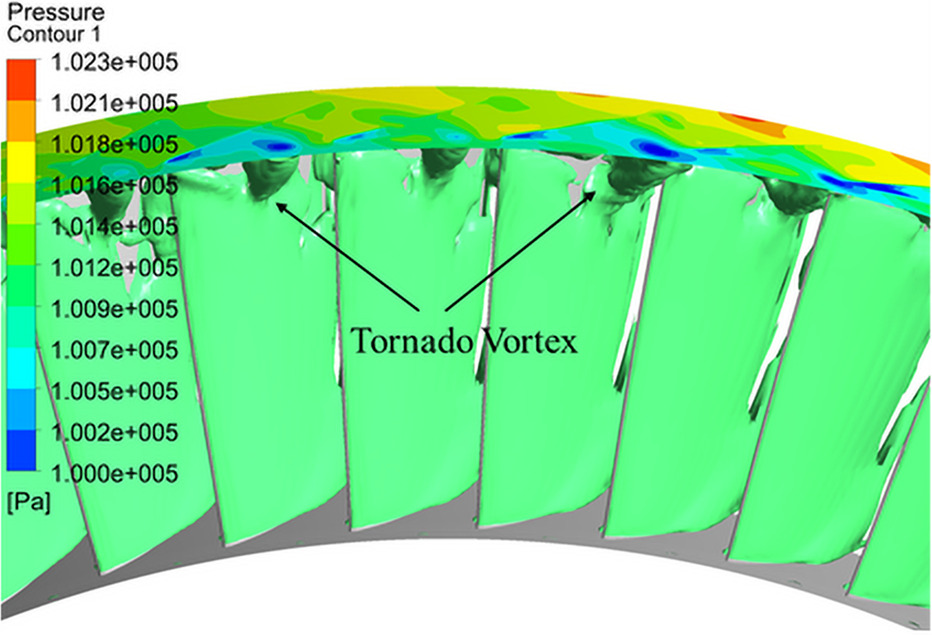
The casing wall pressure contour and vortical flow structures are presented in Figure 13 to reveal the stall type of the compressor with uniform inflow. A tornado vortex extending from the casing wall to the blade suction surface is formed in Figure 13a. Meanwhile, the end of the tornado vortex at the casing corresponds to the low-pressure region, which further confirms that the compressor with uniform inflow falls into rotating stall via spike-type. In Figure 13b, due to the blockage effect of the tornado vortex and the axial direction of the adverse pressure gradient, both spillage and backflow of the tip leakage flow are formed.
Stall mechanism of the compressor with rotating distortion
To reveal the influence of rotating inlet distortion on compressor performance, the tip flow field in the onset of stall inception and stall process is also analysed using DMD method. Based on the contour of static pressure at near-stall and stall condition, 600 snapshots at 98% span are extracted respectively and the time step
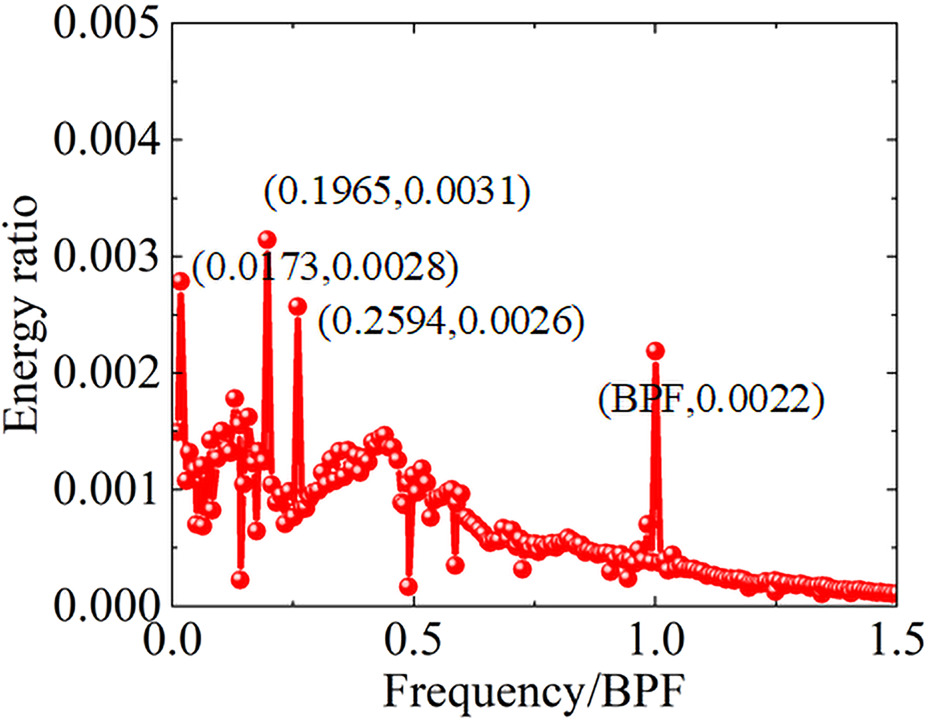
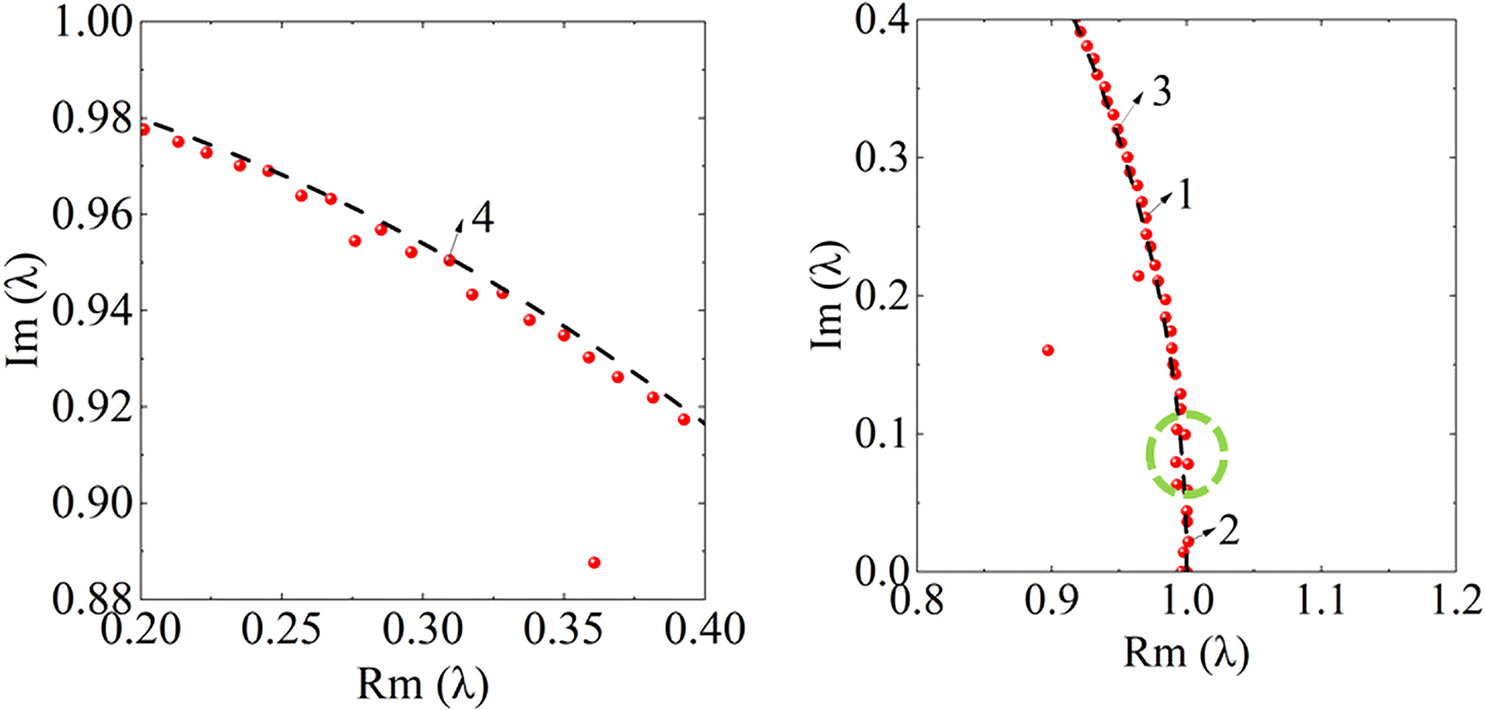
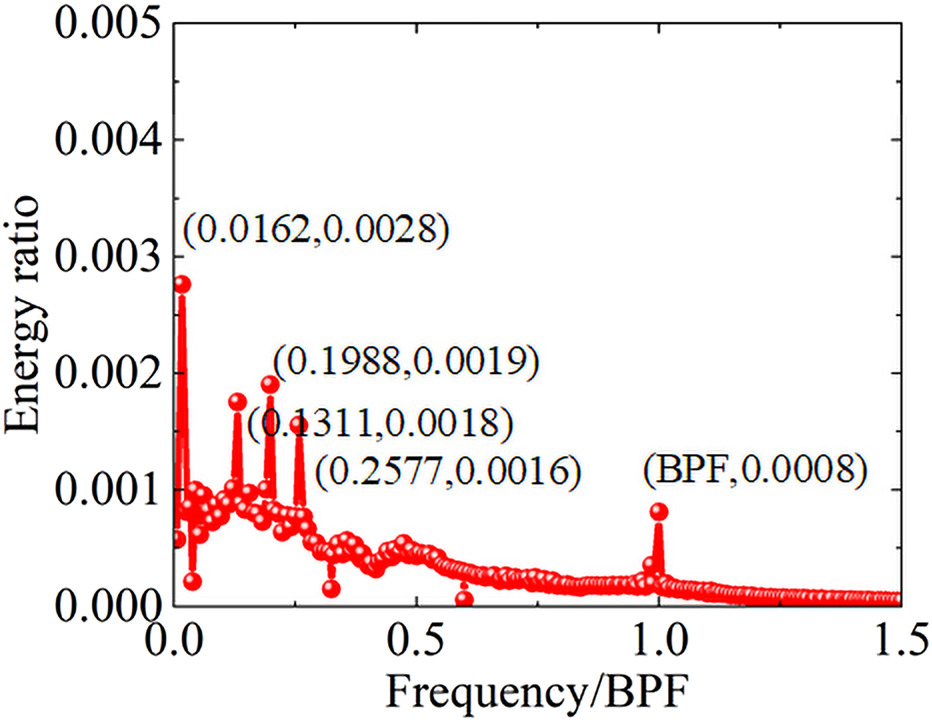
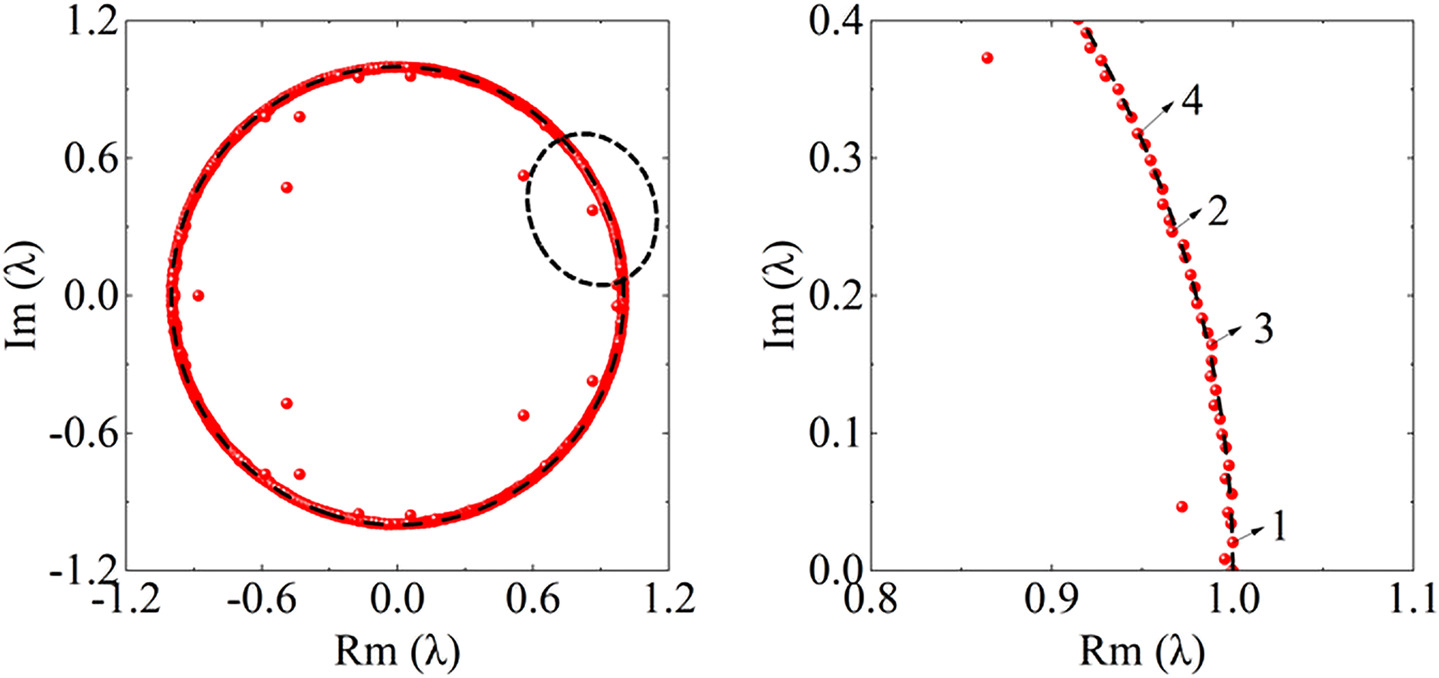
Table 4.
Frequency of the first four order mode at NS condition with rotating distortion
| Mode | Frequency | Energy ratio |
|---|---|---|
| 1 | 0 | 0.7384 |
| 2 | 0.0173BPF∼RF | 0.0028 |
| 3 | 0.1965BPF∼ | 0.0031 |
| 4 | 0.2594BPF | 0.0026 |
Table 5.
Frequency of the first four order mode at stall condition with rotating distortion
| Mode | Frequency | Energy ratio |
|---|---|---|
| 1 | 0 | 0.8683 |
| 2 | 0.0162BPF∼RF | 0.0028 |
| 3 | 0.1311BPF∼8RF | 0.0018 |
| 4 | 0.1988BPF | 0.0019 |
| 5 | 0.2577BPF | 0.00016 |
As can be seen from Figure 14, there still exist a mode whose frequency is zero and a wide band of 0.3–0.6 BPF at near-stall condition with rotating distortion. The position of some modes has been almost distributed outside the unit circle as the green circle shown in Figure 15, which is the same as the condition with uniform inflow. The difference is that other than the BPF, a few modes with higher energy ratio appear in the flow field. Due to the presence of a pair of rotating distortion plates, the frequency of these modes is approximately equal to the rotor frequency and a multiple of the rotor frequency. By comparing Figures 14 and 16, it is observed that the energy ratio of the mode corresponding to 0.1311BPF at stall condition is enhanced compared with that in near-stall condition. In Figure 17, this mode belongs to unstable mode accordingly. To reveal the flow structure of the unstable mode, the static pressure contour of each mode and the axial velocity contour at LE section during the stall process are presented in Figures 18 and 19, respectively.
Figure 18.
Static Pressure Contours of Each Mode at Stall Condition with Rotating Distortion. (a) Second order mode, (b) Third order mode, (c) Fourth order mode, and (d) Fifth order mode.
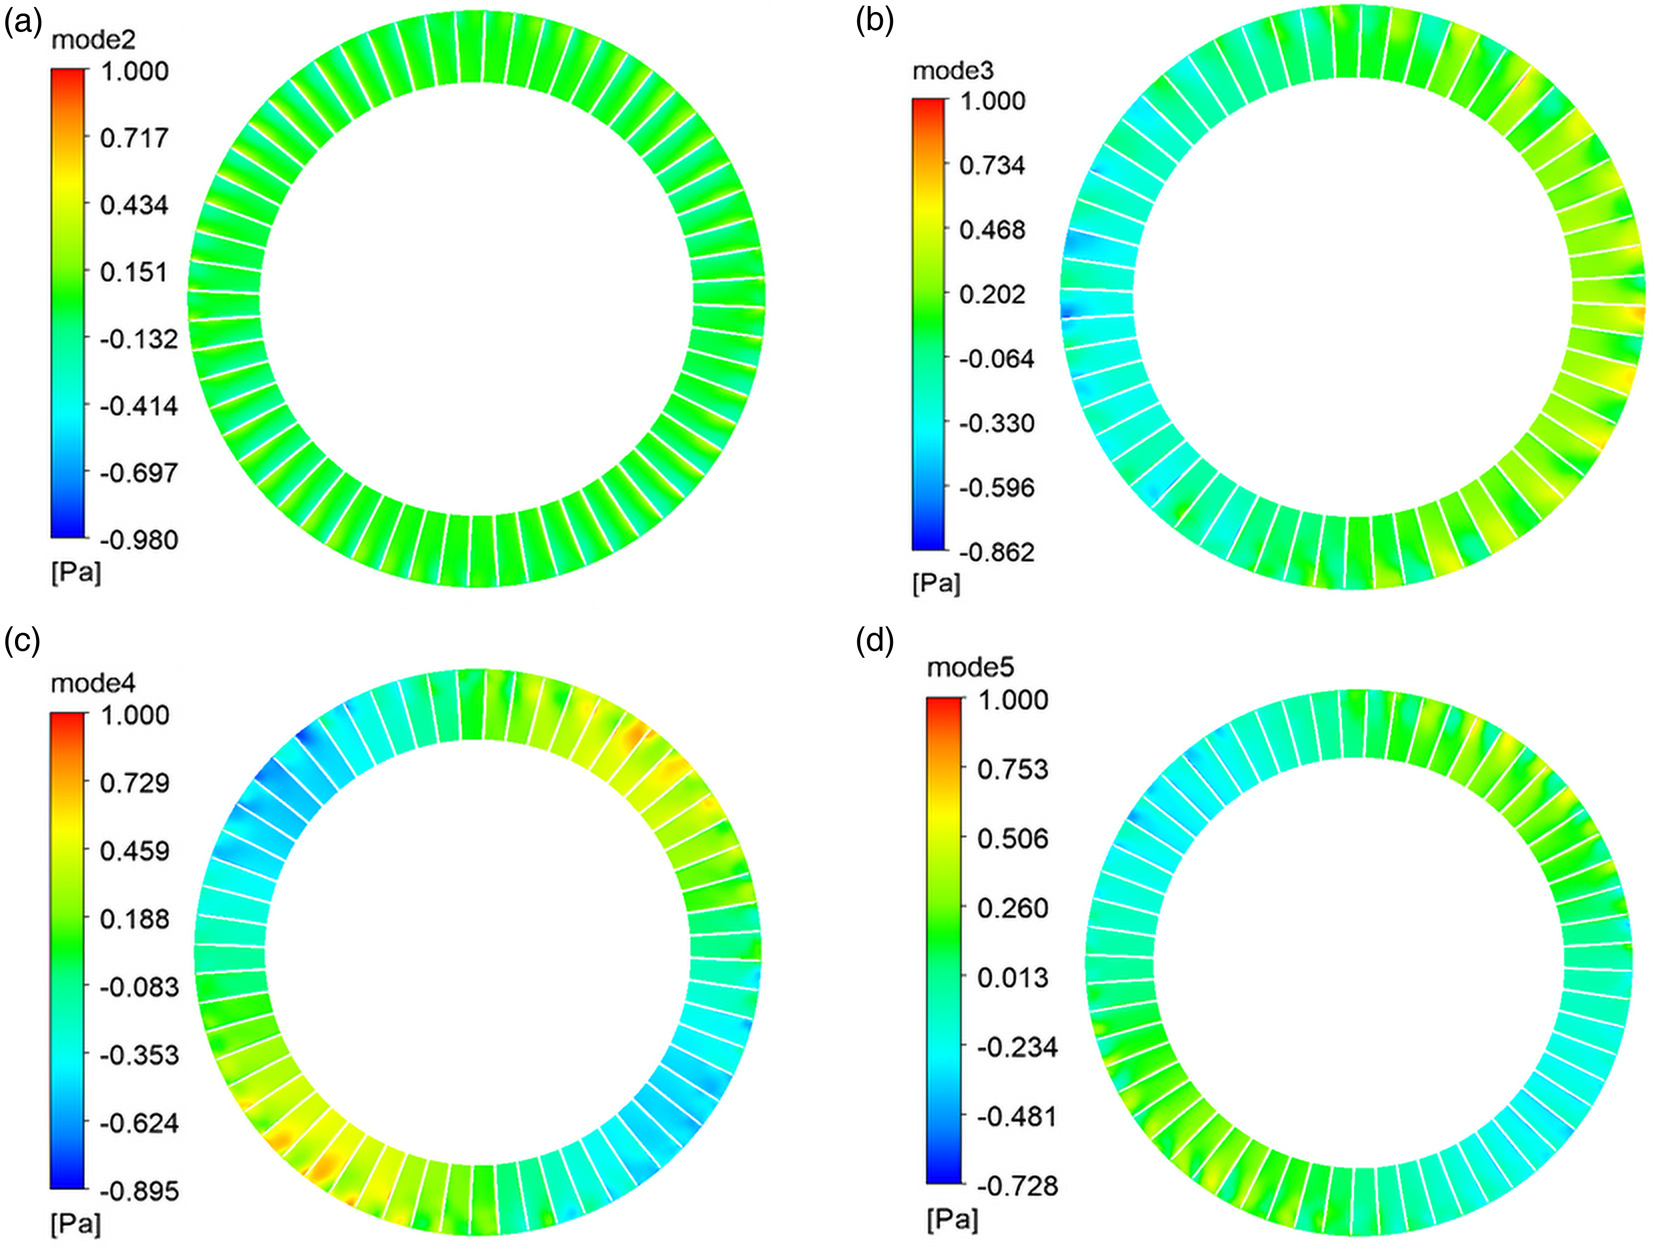
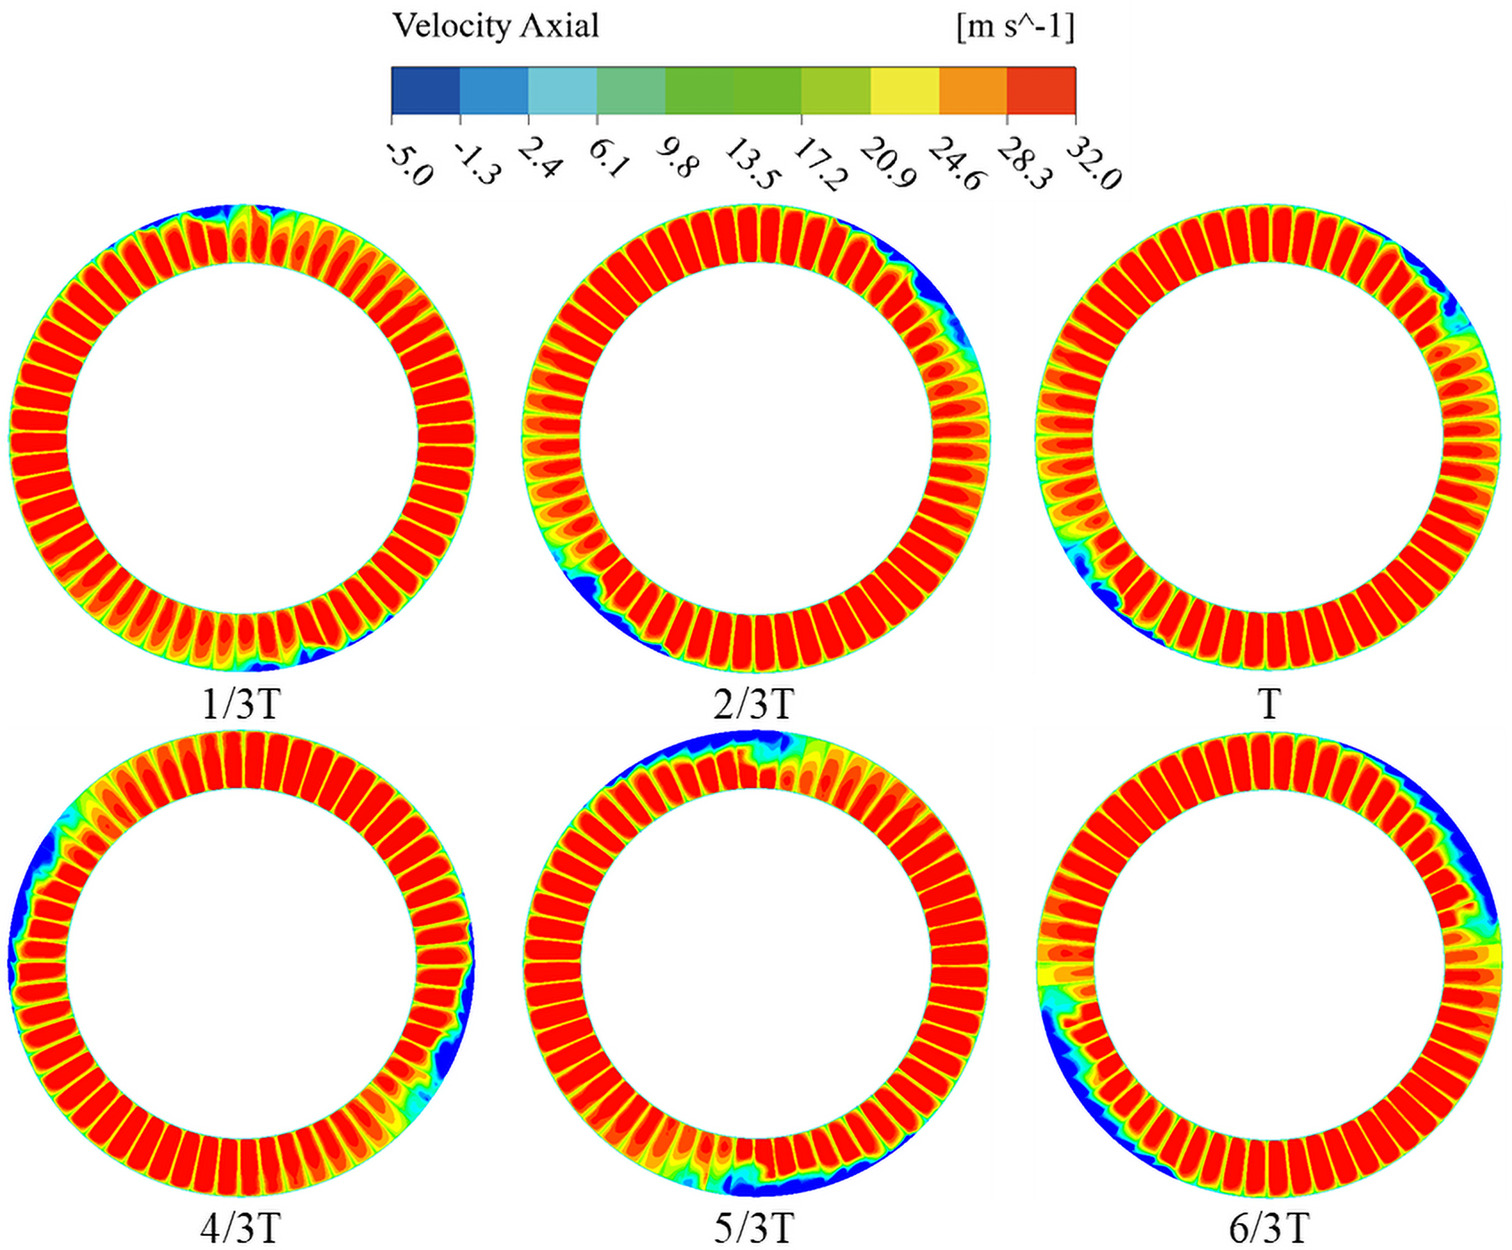
As mentioned above, the frequency of the second order mode is equivalent to the rotating frequency of the distortion plate, the flow structure of this mode in Figure 18a is relatively uniform. A pair of pressure disturbances along the circumferential direction is formed in third mode. In Figure 18c, there are two pairs of obvious pressure disturbances consisting of adjacent high- and low-pressure fluid, which maybe resemble two stall cells. The frequency of the fifth mode is twice that of the fourth mode, and the structure of the two modes is similar. It can be inferred from Figure 19 that unlike the case of uniform inflow, when the compressor is subjected to rotating distortion, the low velocity region is first generated at the tip of the rotor. These low-velocity region continue to expand as they propagate in circumferential direction. Eventually they develop into two stall cells occupying 9–10 blade passages. The result is consistent with the flow structure obtained by DMD analysis in Figure 18c.
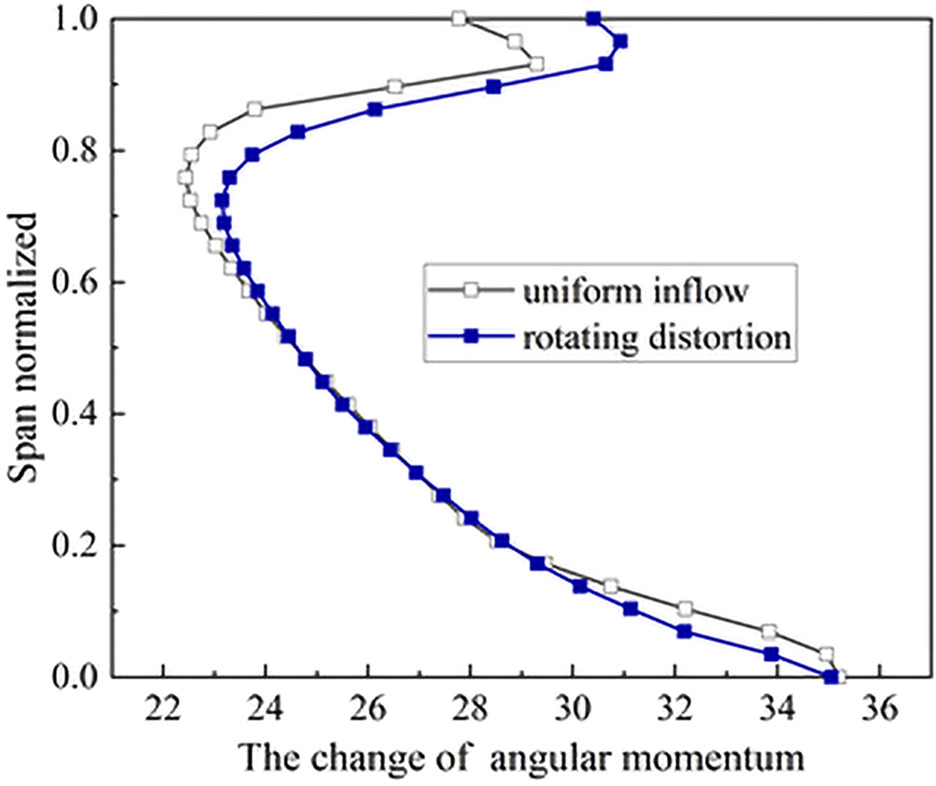
It can be seen from the appearance of the tornado vortices in Figure 20 that the stall type of the compressor with rotating distortion is still spike rotating stall. To reveal the reason why the low velocity region first appears at the rotor tip under rotating distortion condition, Figure 21 further shows the spanwise distribution of the angular momentum with different inflow at the same flow coefficient. The definition of the change of the normalized angular momentum at the inlet and outlet is as follows:
Conclusions
In this paper, the stall flowfields of an axial flow compressor stage with uniform inflow and rotating distortion are obtained by full-annulus URANS method. By the means of dynamic mode decomposition, the following conclusions are drawn from the analysis of the URANS results:
When the compressor is subjected to uniform inflow, the distribution of DMD eigenvalues on the complex plane at near-stall condition shows that some modes are located almost outside the unit circle, indicating that there is a bit of critical unstable flow structure in the flow field. The analysis of the frequency and mode contour further shows that these modes are related to the unsteadiness of tip leakage flow. Moreover, the results are similar after the addition of rotating distortion. Therefore, the unit circle of DMD eigenvalues can be used as a new stall prediction model to analyze experimental/numerical data from a new perspective so as to predict compressor stall in advance.
The DMD method can identify the flow structure corresponding to the dominant modes in the stall process, and the unstable modes are related to the large-scale stall cell or the disturbance that progates circumferentially. The addition of rotating distortion can change the number and shape of the stall cell, and alter the position of the where the low velocity region first appears. This is due to the fact that the blade loading distribution along spanwise direction has been changed under different inflow conditions.
It is found that with and without rotating distortion, the axial flow compressor stalls through spike with the characteristic of tornado vortex. At uniform inflow condition, the low-velocity regions first appear at the rotor hub, then gradually transmit to the tip of the blade and four stall cells occupying 6–7 blade passages are eventually formed. However, at rotating distortion condition, the stall inception occurs at the rotor tip, and two stall cells occupying 6–7 blade passages are observed in the stall process. The dynamic mode decomposition can be used as a dimensionality reduction method to extract the key information of complex flow field in compressor effectively.