
Introduction
Nowadays, numerical optimization methods, which use artificial neuronal networks in combination with optimization algorithms, are gaining more and more importance in the development of turbomachines. The major advantage lies in the opportunity for bringing about a cost-saving design process which, in turn, opens up new possibilities for the use of both new and complex geometries such as arbitrary blade surfaces. There is great potential therefore, for the improvement of transonic centrifugal compressors since the flow is complex and highly three-dimensional and thus still difficult to handle with the state-of-the-art design technique, namely ruled surfaces. For that reason, and owing to the constantly improving computing capacities, the development and application of numerical optimization methods have very much grown in significance in recent years.
Worth mentioning here are the studies of Pierret at the VKI (Von Karman Institute for Fluid Dynamics) and for NUMECA (Pierret and Van den Braembussche, 1999; Pierret et al., 2000). The authors used CFD results as an input variable for an ANN and a simulated annealed algorithm and genetic algorithm, respectively. Later, Van den Braembussche and Verstraete published several successful optimizations of centrifugal compressors with blades comprised of ruled surfaces (Verstraete et al., 2007, 2011; Van den Braembussche et al., 2012). An optimization of the so-called SRV4 with fully 3D blade profiles was conducted at the DLR Cologne (Raitor et al., 2013; Elfert et al., 2016). The authors concluded that an efficiency increase of about 1.5% was mainly achieved due to a shock strength reduction in the inducer of the impeller. Another remarkable optimization of a process gas compressor with a shrouded impeller was made by Hiradate et al. (2014), which was later experimentally verified by Tsukamoto et al. (2015). Due to the use of curvilinear blade stacking and thus a modification of lean, an efficiency improvement of 2.1% could be achieved. A secondary flow analysis at the impeller exit revealed that the efficiency improvement was mainly achieved by the change in the blade lean angle distribution in the exducer part of the impeller.
This article presents a detailed study of the influence of blade geometry on the loss generation in a transonic centrifugal compressor by comparing the secondary flow development in two designs representing different design philosophies, namely ruled surfaces and arbitrary blade surfaces. The arbitrary blade surfaces were generated by means of a numerical optimization process, as has been described in detail in a previous work published by the authors (Hehn et al., 2017). Since both overall optimization results and the comparison of the impeller and diffuser flow revealed that the improvements are achieved mainly due to a more uniform flow at the impeller exit, no attention is paid to the inducer flow which was also influenced by a change in the leading edge geometry. As discussed in detail, the gain in efficiency is primary achieved by blade lean and curvature and, as such, by a reduction in the blade surface vortex and a reduced blade loading.
The baseline design SRV4R
The baseline compressor, the so-called SRV4R, is a high-pressure ratio transonic centrifugal compressor with an inlet tip Mach number of about 1.4 at design point. The impeller has 13 main and splitter blades respectively, which are conventionally designed using ruled surfaces. SRV4R is a modified version of the SRV4 impeller, which has been extensively studied at the DLR Cologne in the past (Krain et al., 2007). In order to compare the impeller aerodynamics, SRV4R was optimized in combination with a vaneless diffuser (Table 1; Figure 1).
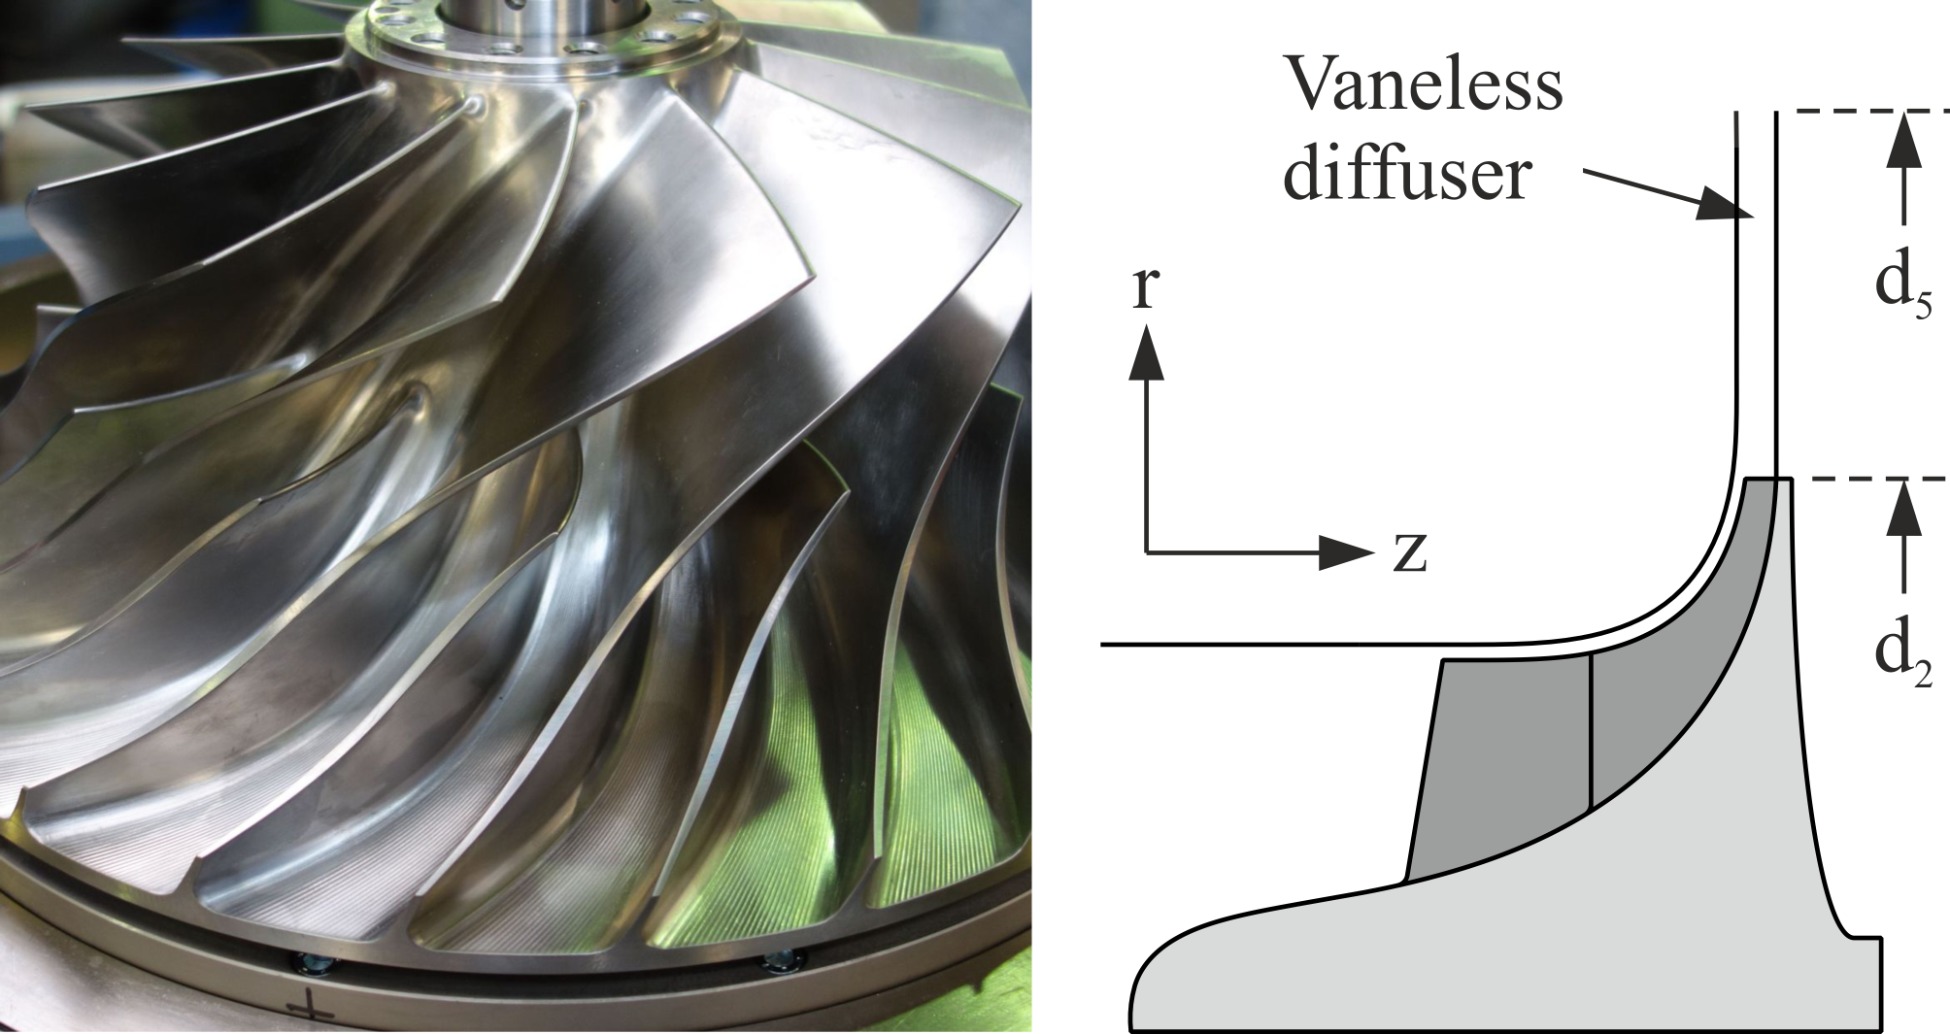
Table 1.
Key parameters of SRV4R.
OP1: Design point, OP2: Choke limit.
Numerical setup
The numerical investigation of the secondary flow development was carried out using the FINE™/Turbo software package of NUMECA. The computational domain, which is depicted in Figure 2, included one periodic section of the impeller, plus the vaneless diffuser. To enable a comparison, at the inlet, the domain was extended upstream to the point where the thermodynamic state was measured experimentally. Since the optimization was performed in combination with a vaneless diffuser, the simulations were conducted under steady-state conditions. Each grid consisted of approximately 5 million cells. The tip gap was modeled using 21 cells in spanwise direction and, in accordance with the experiment, tip clearance height was set as measured for SRV4R. Viscous effects were modeled using the one-equation Spalart-Allmaras turbulence model in its original formulation with a low-Reynolds approach. The average value of y+ on all surfaces was about 1, whereas certain cells reached maximum values of about 7. All simulations were conducted with air as calorically perfect gas.

It should be mentioned that both the computational domain and computational mesh are not identical to the ones used for the numerical optimization. For that reason, the results shown in this article differ slightly and are not in exact accordance to the numerical values given in (Hehn et al., 2017).
Numerical optimization of the baseline design
Since, at this point, neither the optimization process nor the overall optimization results are the primary focus of this work, only a short overview of the numerical results is given here. Further details can be found in a previous work published by the authors (Hehn et al., 2017).
Optimization method
The numerical optimization of SRV4R was carried out using FINE™/Design3D of NUMECA. Starting with an initial database in this tool, promising new impeller designs are evaluated by means of an artificial neural network and a genetic algorithm. As a necessary condition and in order to create both the initial database and new impeller designs during the optimization cycle, SRV4R first had to be parametrized. For this purpose, the meridional contour and the camber curves of the main and the splitter blade were replaced by various parameter curves, such as B-splines. In contrast to ruled surfaces, where both two mean lines at hub and shroud and a blade thickness distribution define the blade’s geometry entirely, a third independent camber curve at mid-span was introduced to allow a further degree of freedom. As a result, it was possible to guarantee the creation of arbitrary blade surfaces. The optimization was performed at nominal speed on three specific operating points (so-called multi-point optimization). One of the main objectives was to increase the isentropic total-to-static efficiency at design point, while keeping the work input constant. In total, based on an initial database of 271 designs, 672 new designs were generated forming a distinct Pareto frontier. Since design number 603 was the best compromise with respect to the optimization objectives, this design was chosen for manufacturing and experimental testing. Prior to this, FE and modal analyses had been carried out in order to avoid structural failure during operation (Figure 3).
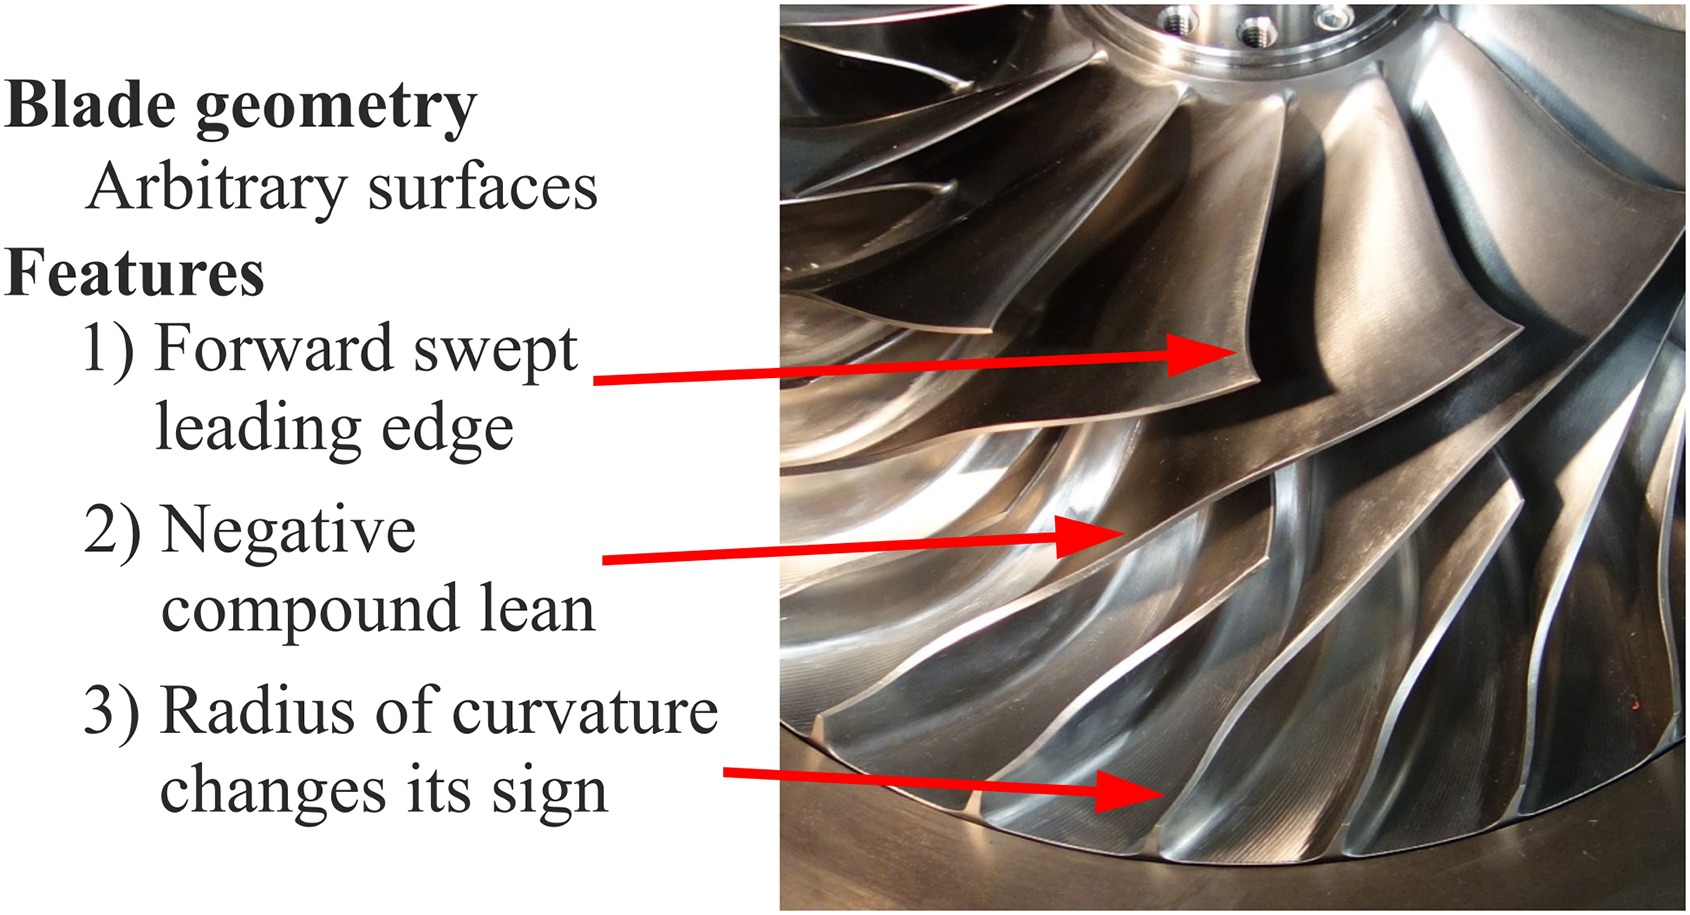
The most important geometrical differences between SRV4R and design 603 are as follows: in contrast to SRV4R, design 603 has a forward swept leading edge beginning at 75% span. Far more difficult to recognize is that the blades of design 603 exhibit a distinct negative compound lean from about 50% meridional length onward. Finally, the third main difference is that above 80% span, blade curvature of design 603 changes its sign to positive values at the impeller exit.
Overall optimization results
Figure 4 compares the overall characteristics at nominal speed. At the diffuser outlet, design 603 reaches a slightly higher pressure ratio. Taking into account that the work input was kept equal and only negligible deviations in total temperature ratio were accepted for the optimization cycle, the higher pressure ratio of design 603 is mainly caused by an increase in total-to-total efficiency. Evaluating at the diffuser outlet, the optimized impeller gains an increase in efficiency of 1.76% in total-to-static and 1.53% in total-to-total efficiency. By way of contrast, at the impeller exit SRV4R shows a higher total-to-total efficiency of 0.31% (not shown in Figure 4) while the total-to-static efficiency of design 603 remains higher. The reason for the higher total-to-static efficiency is mainly due to the fact that the impeller flow channel of design 603 is considerably wider and thus the flow is more decelerated within the exducer. However, as can be estimated from a variation of the total pressure loss coefficient within the diffuser (Hehn et al., 2017), the higher total-to-total efficiency of design 603 at the diffuser outlet is not only a consequence of the stronger deceleration in the exducer part of the impeller. As is described below, the formation of the outlet flow profile at the impeller exit in axial direction is significantly affected by the optimized blade geometry and therefore the loss generation within the diffuser is also reduced.

Loss generation within the diffuser
Figure 5 shows the increase in mass averaged entropy along the meridional coordinate for both compressor stages. As can be seen, the main difference in entropy production occurs at the impeller outlet. While the entropy production is only slightly higher for design 603 in the impeller (see Figure 5-1), a significant rise can be observed in the diffuser inlet section (see Figure 5-2), which in turn accounts for the gain of more than 1.76% in isentropic total-to-total efficiency. As described in the following, the difference in entropy production can be attributed primarily to a homogenization of the axial flow profile at the impeller outlet.

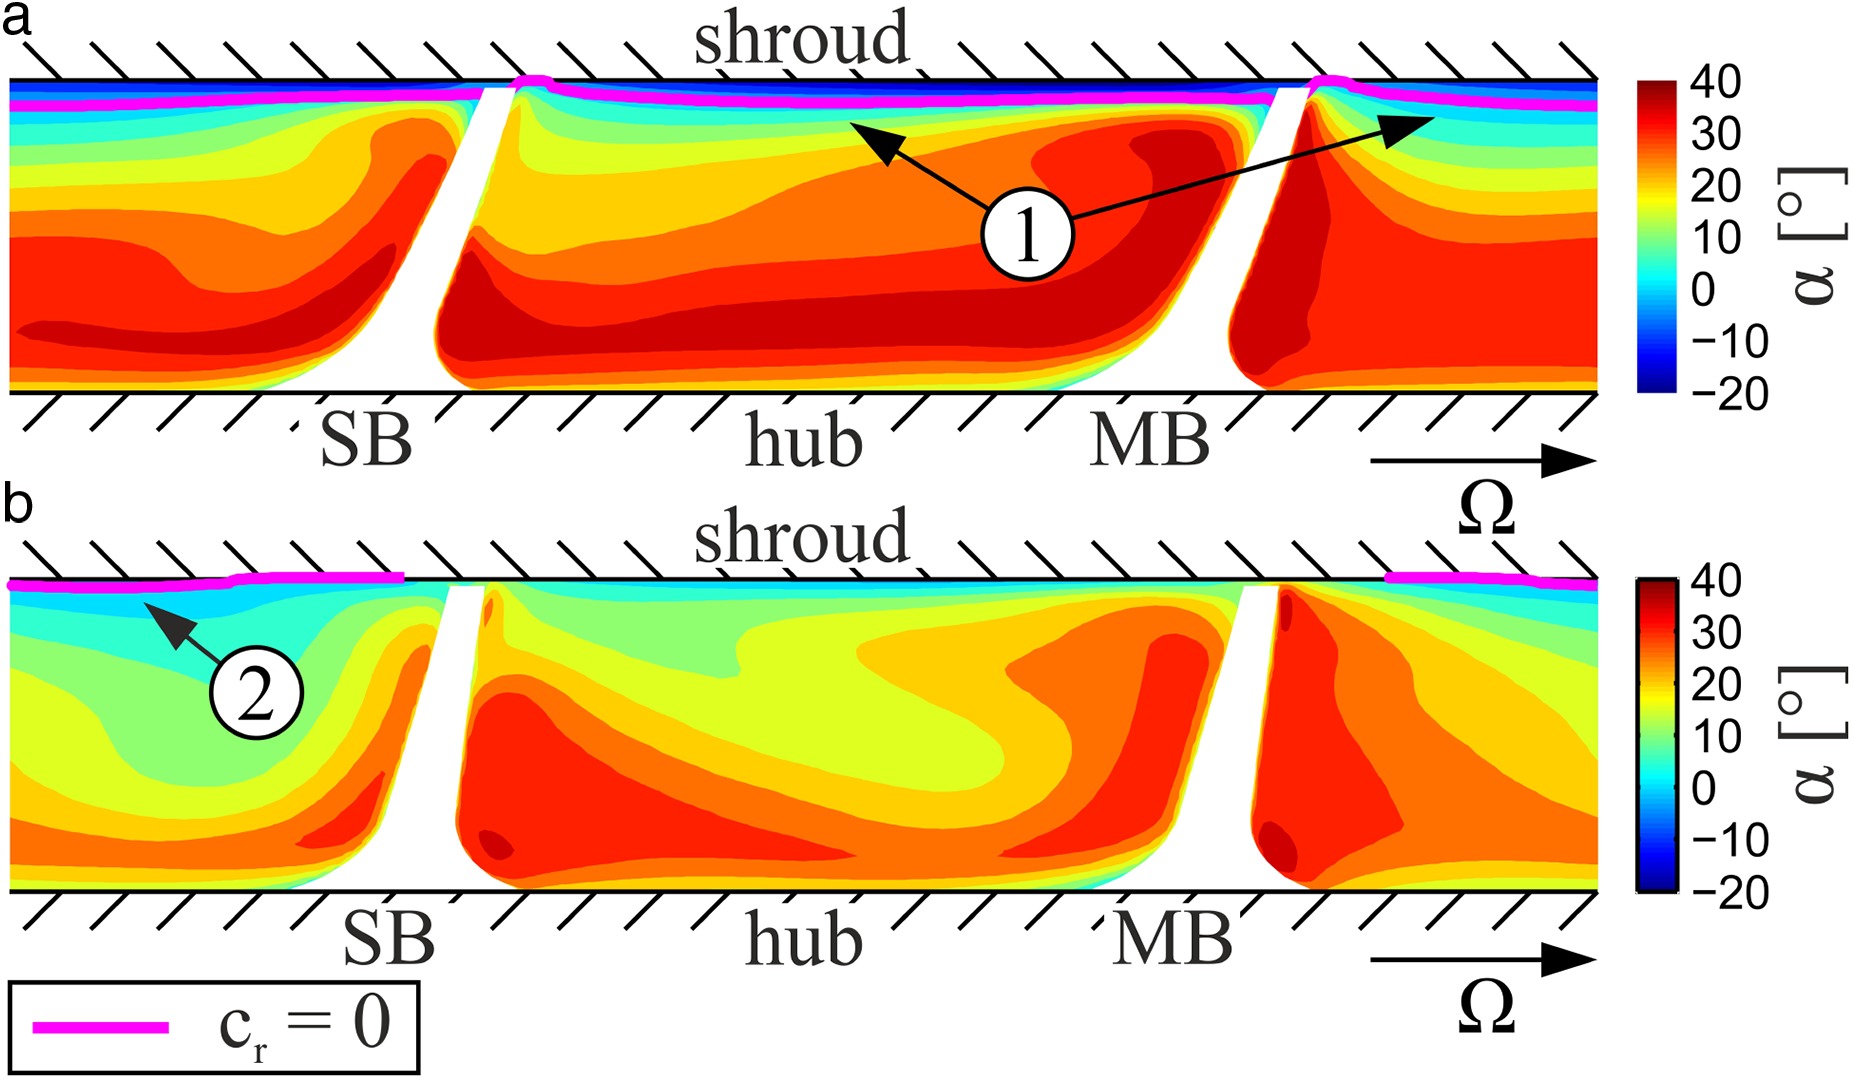
In order to explain the reason for the different loss generation, the variation of the flow angle in the absolute frame of reference at the impeller outlet is depicted in Figure 6. Compared to SRV4R, the flow for design 603 is only slightly more inhomogeneous in circumferential, but at the same time much more uniform in axial direction. However, the inhomogeneity in circumferential direction does not make a big difference in loss generation for both impellers, since the flow in circumferential direction mixes out rapidly and usually up to 1.2r2 all initial non-uniformities vanish (Van den Braembusche, 2015). Conversely, much more attention should be given to the flow profile in axial direction. Close to the shroud, SRV4R exhibits a reverse flow (see Figure 6-1) which is present around the whole circumference and is therefore also visible in the circumferentially averaged solution (see Figure 7-1). Hence, from hub to shroud the flow angle varies between −15° and 32°. In contrast to SRV4R, design 603 only shows a small region of radially inwardly directed flow located in the channel between the suction side of the splitter blade and the pressure side of the main blade (see Figure 6-2). For this reason, the flow angle is continuously positive at values of between approx. 20° and 30°. Since both SRV4R and design 603 show an almost identical circumferential velocity profile at the impeller outlet (compare Figure 7), the spanwise variation of flow angle correlates with the radial velocity profile.

The reason for the higher diffuser losses of SRV4R can therefore be explained by taking a closer look at the simplified momentum equation (cz = 0) in a vaneless diffuser (Van den Braembusche, 2015)
As shown in Equation (1), shear stresses, amongst others, are mainly driven by the deceleration (gradient of radial velocity in radial direction), as well as the radial velocity profile in axial direction (second term on RHS in Equation (1)). The larger the variation of radial velocity across the channel height (axial direction), the higher the gradient of shear stresses in axial direction and therefore the maximum value of shear stresses acting in the fluid. In case of the baseline design SRV4R, due to the higher shear stresses and shear forces respectively, dissipation, as already shown in Figure 4 and finally Figure 5, is also higher. Because there is no pressure gradient in axial direction, mixing is only due to shearing and takes place throughout the whole diffuser. For that reason, the large spread of flow angle and radial velocity distribution respectively at the diffuser inlet account for the higher losses of SRV4R. It should be noted that the difference in circumferential velocity (first term on RHS in Equation (1)) as well as the gradient of static pressure rise in radial direction (third term on RHS in Equation (1)) also influence the force equilibrium. For reasons of simplicity, the impact is not further analysed here.
Secondary flow analysis
In this section, a detailed analysis of the exducer flow is conducted. As such, the influence of blade lean on the formation of the blade surface vortex is described first. Later, the main reason for the different flow behaviour of both, the baseline and the optimized compressor at the impeller exit close to the shroud is analysed.
Development of blade surfaces vortices
As there are several ways for the visualization of secondary flow in a centrifugal impeller, the method used here is described briefly below (Hathaway et al., 1993; Hirsch et al., 1996). The secondary flow fields presented in this article are defined as the vector difference between the local relative velocity vector and the projection of this vector in the local streamwise direction. Again, the streamwise direction is defined by the camber curve of the main blade. In order to facilitate a direct comparison between SRV4R and design 603, the vector field, evaluated in terms of magnitude and vortex formation, is shown as contour plots and vector lines. The evaluation was carried out in planes normal to the shroud contour (see Figure 8) and therefore the calculated secondary flow field previously had to be projected in the particular plane.
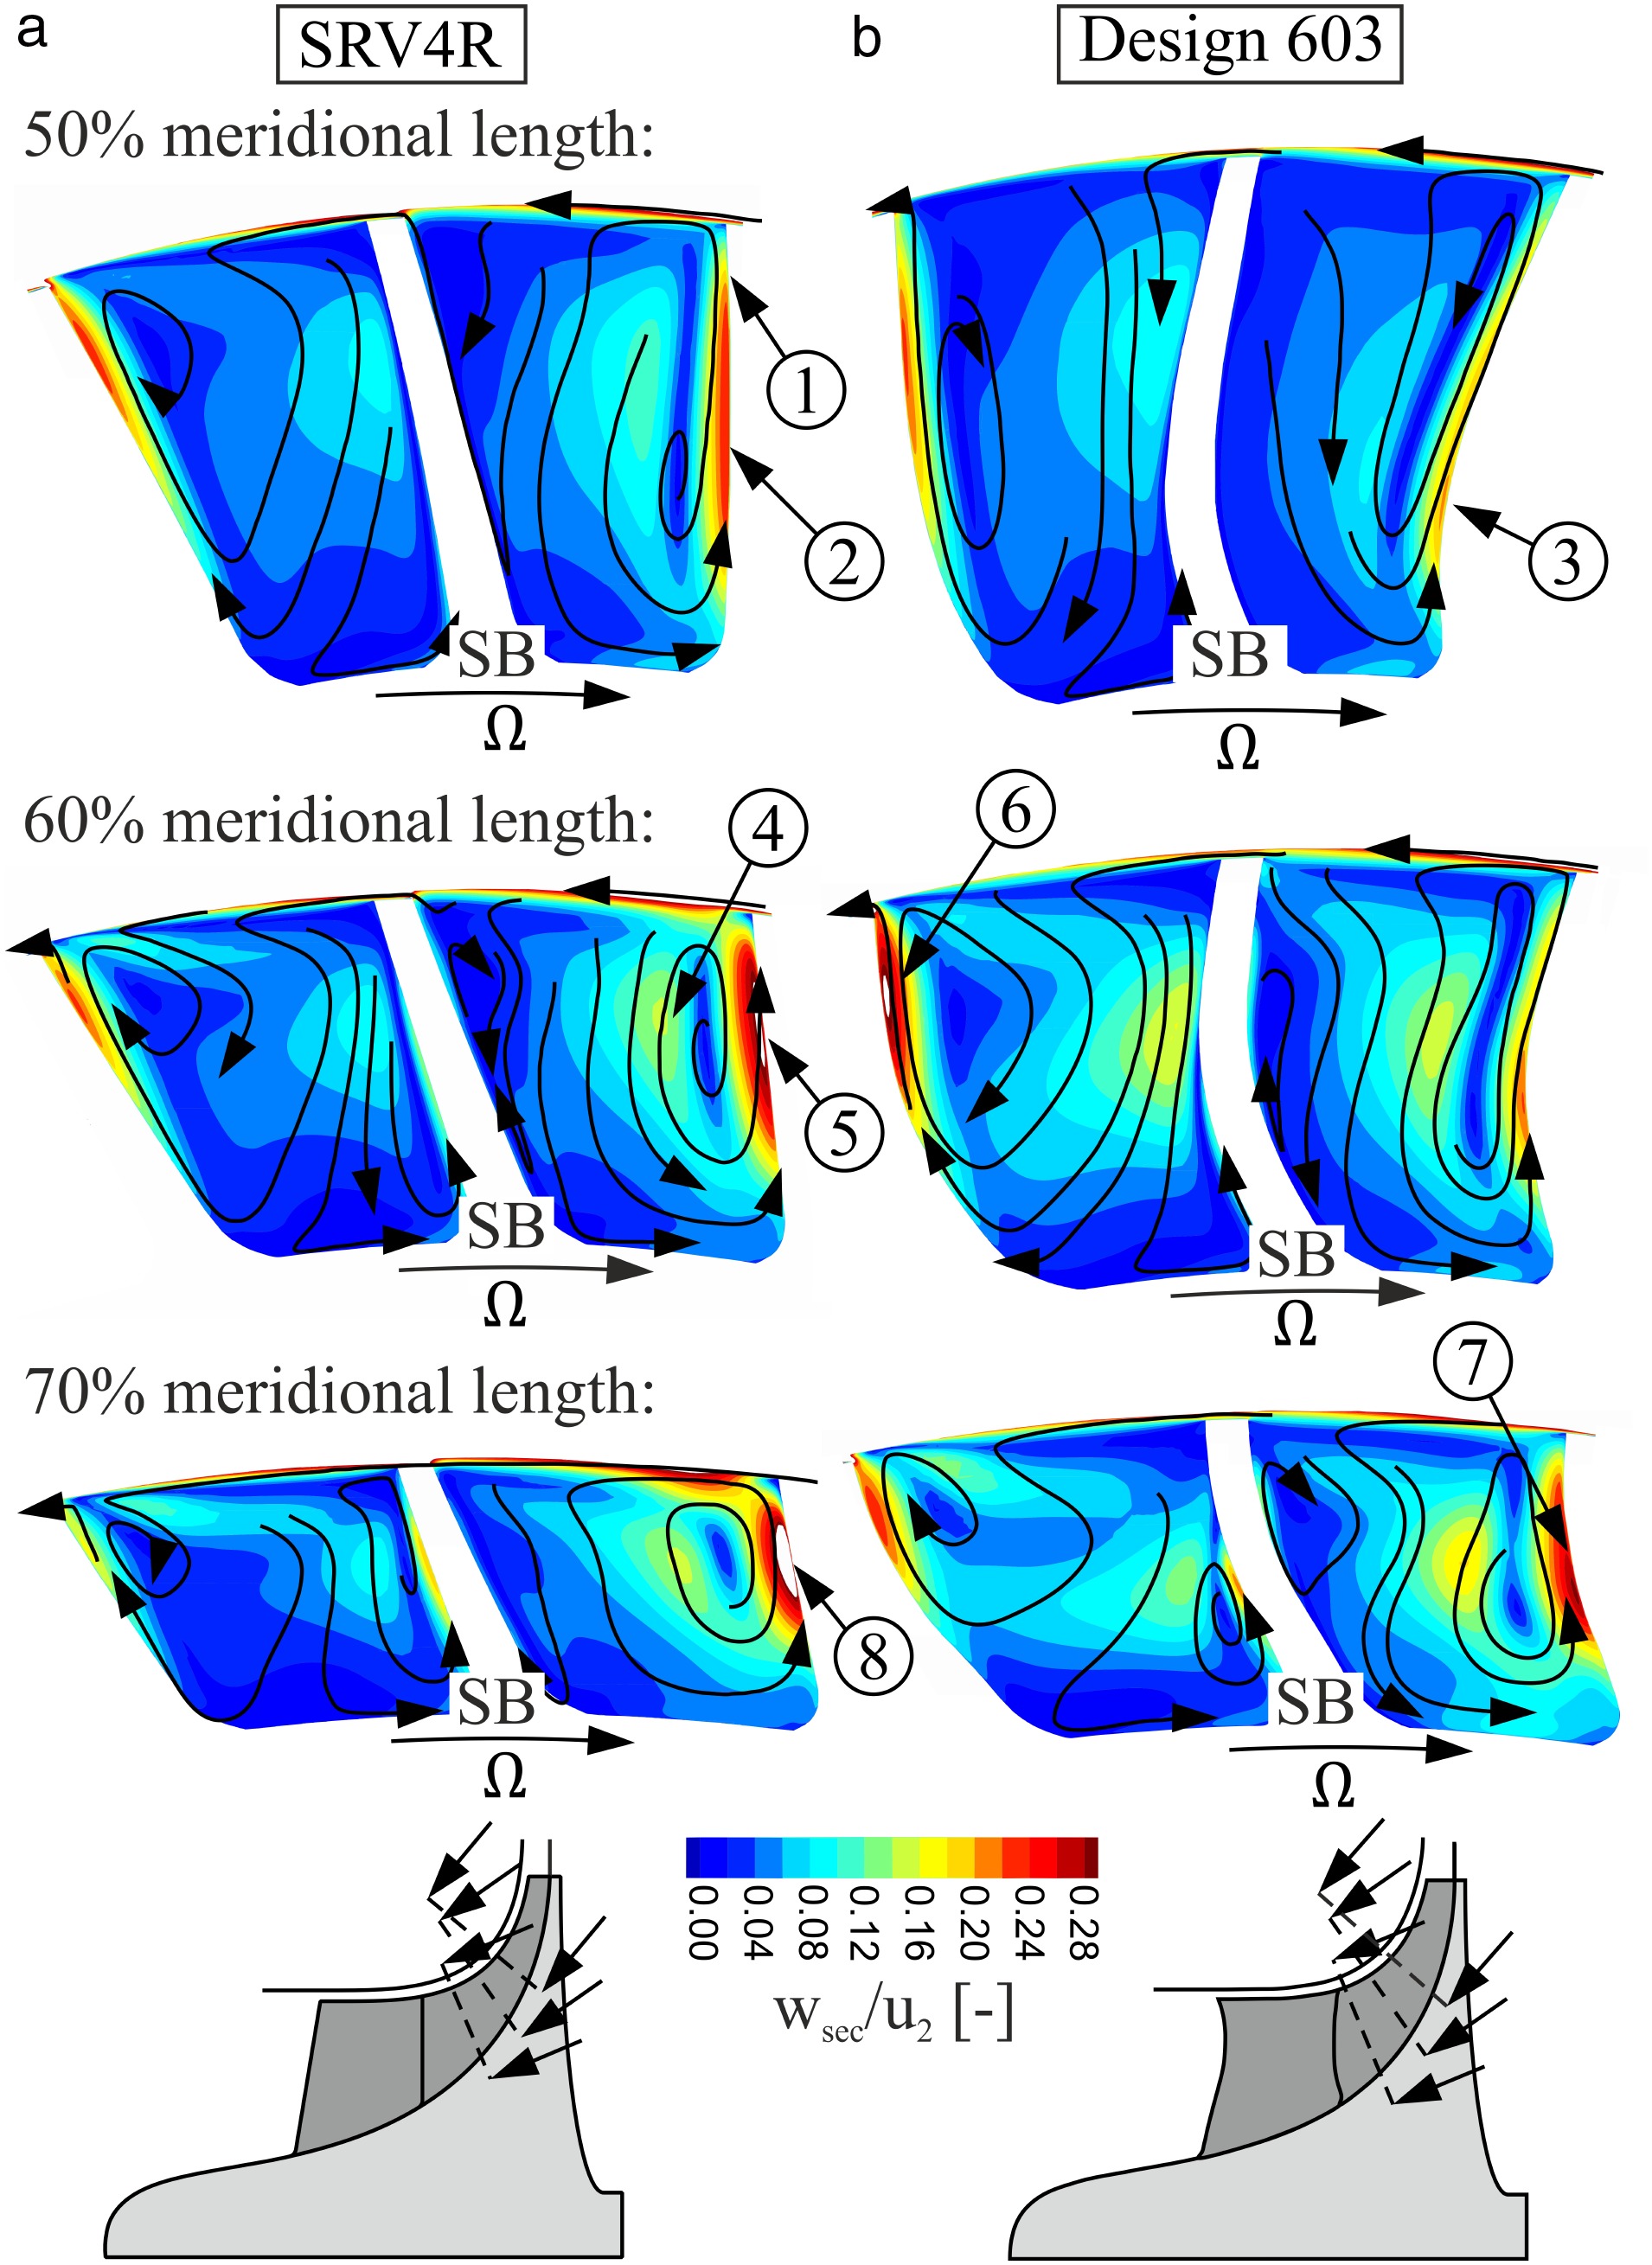
Since most differences appear near to where both impellers differ in terms of the spanwise blade lean angle distribution, Figure 8 shows the results at 50%, 60% and 70% meridional length. As can clearly be seen, without exception, the blade of SRV4R is leaned negatively (acute angle between hub and suction side). Unlike SRV4R, design 603 exhibits a distinct negative compound lean (acute angle between shroud and suction side) and a slightly negative lean at the shroud can only be observed at 70% meridional length.
Due to the positive blade lean of design 603 in the near-tip region, a radial blade force component is introduced, which acts in the direction of the shroud on the suction side (Denton and Xu, 1998). This means that at higher span positions the spanwise pressure gradient from hub to shroud, which is mainly caused by meridional curvature, is significantly reduced near the suction side. It should be noted that the modification of the spanwise pressure gradient along the blade surfaces is not only a result of the change of blade lean, since lean cannot be varied independently from the blade angle distribution. Therefore, the variation of the spanwise pressure gradient and thus the movement of the blade surface vortex, which is discussed in the following, can be attributed to both the negative compound lean and the blade to blade loading. Anyway, the static pressure distribution, for the sake of brevity, is not shown here.
At 50% meridional length, as can be seen in Figure 8, the formation of the blade surface vortex on the suction side of the main blade is significantly affected by the different lean angles of SRV4R and design 603. Due to the higher spanwise pressure gradient of SRV4R, the migration of low-energy fluid already takes place up to the shroud (see Figure 8-1). Hence the blade surface vortex shows a severe maximum secondary flow intensity of about 30% of the circumferential impeller velocity (see Figure 8-2). In the case of design 603, however, the formation of the blade surface vortex is almost completely suppressed. Although the maximum intensity is about 25% of the circumferential impeller velocity, this only extends to a small region (see Figure 8-3). On the pressure side, no differences in the formation and intensity of the blade surface vortex can be observed. It should be mentioned that the blade surface vortices on the splitter blades are not visible, since the development of the boundary layers is still at the beginning.
At 60% meridional length, a small change in the secondary flow field can be determined. On the one hand, relative to the channel width, the blade surface vortex of the main blade has grown much broader in the case of SRV4R (see Figure 8-4). In other words, the already high level of low-energy fluid migration from hub to shroud increases further. In addition, the maximum velocity of secondary flow exceeds 30% of the circumferential impeller velocity (see Figure 8-5). A further difference exists in the development of the blade surface vortex on the pressure side. While magnitude and intensity remain almost unchanged for SRV4R, both increase rapidly for design 603 (see Figure 8-6). This can be explained by the fact that the blade force component in radial direction on the pressure side of design 603 points towards mid-span in the near-tip region. As a result, the spanwise pressure gradient increases and thus leads to a stronger vortex development.
Further downstream, at 70% meridional length, the blade lean angle of design 603 changes to continuously negative values. Hence the blade surface vortex on the suction side, in terms of magnitude and intensity, grows and, for instance, reaches a maximum intensity of about 30% of the circumferential impeller velocity (see Figure 8-7). The same also applies for SRV4R, since the blade lean is still negative. For that reason, the maximum secondary flow velocity achieves values of about 40% in the case of SRV4R (see Figure 8-8, for the sake of comparison, identical scales were chosen).
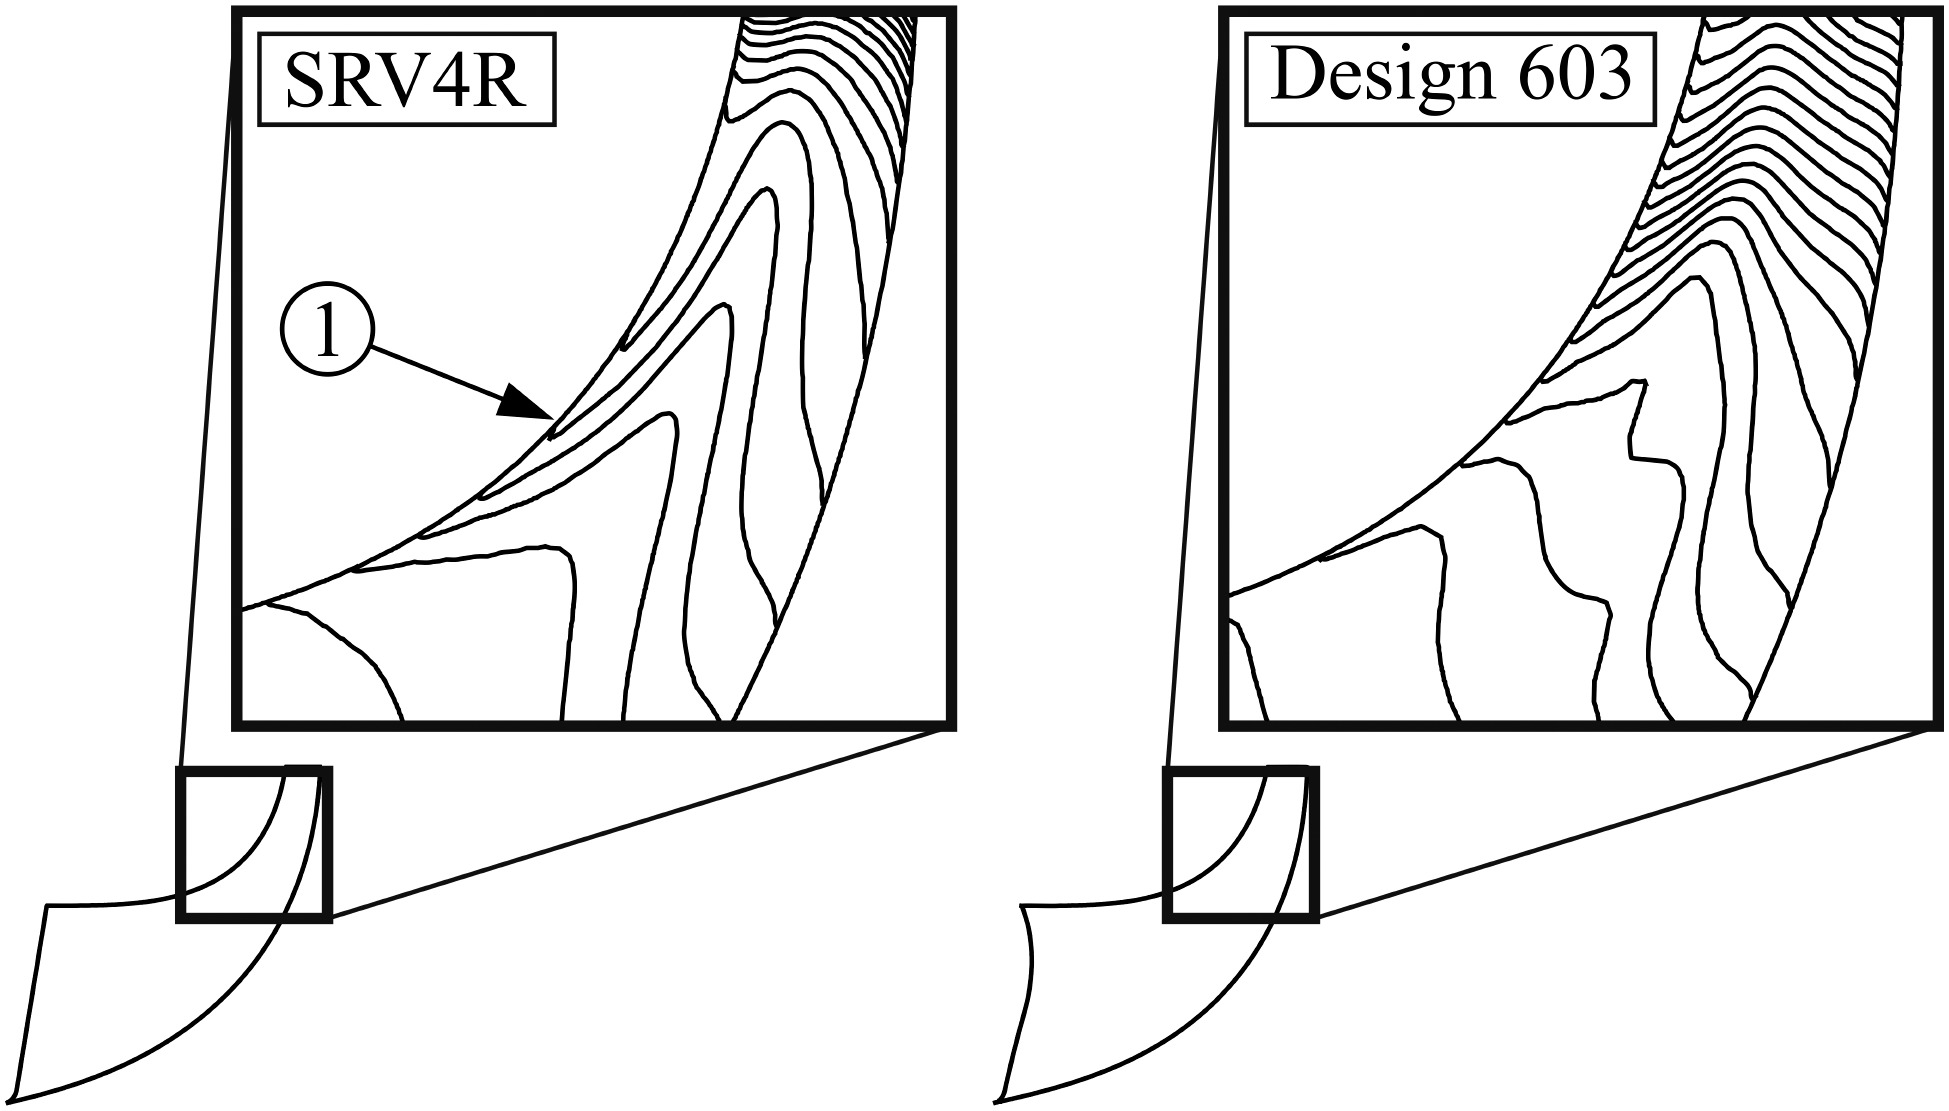
Since the static pressure distribution is not shown in Figure 8, another important issue, already reported by other authors (see for example Lohmberg (2000)), should be mentioned. In the corner between the suction side of the main blade and the shroud, in all planes considered, the occurrence of a small region with high pressure can be observed locally for SRV4R. By comparison, design 603 shows the same behavior only at 70% meridional length. It seems reasonable to assume that the increase in pressure is caused by the low-energy fluid which migrates from hub to shroud. Near the shroud the fluid deviates towards the pressure side of the adjacent blade, with this deviation leading to a centrifugal force and therefore to an increase in static pressure in the corner between the suction side of the main blade and the shroud. The isolines of static pressure thus run upstream near the shroud (see Figure 9-1).
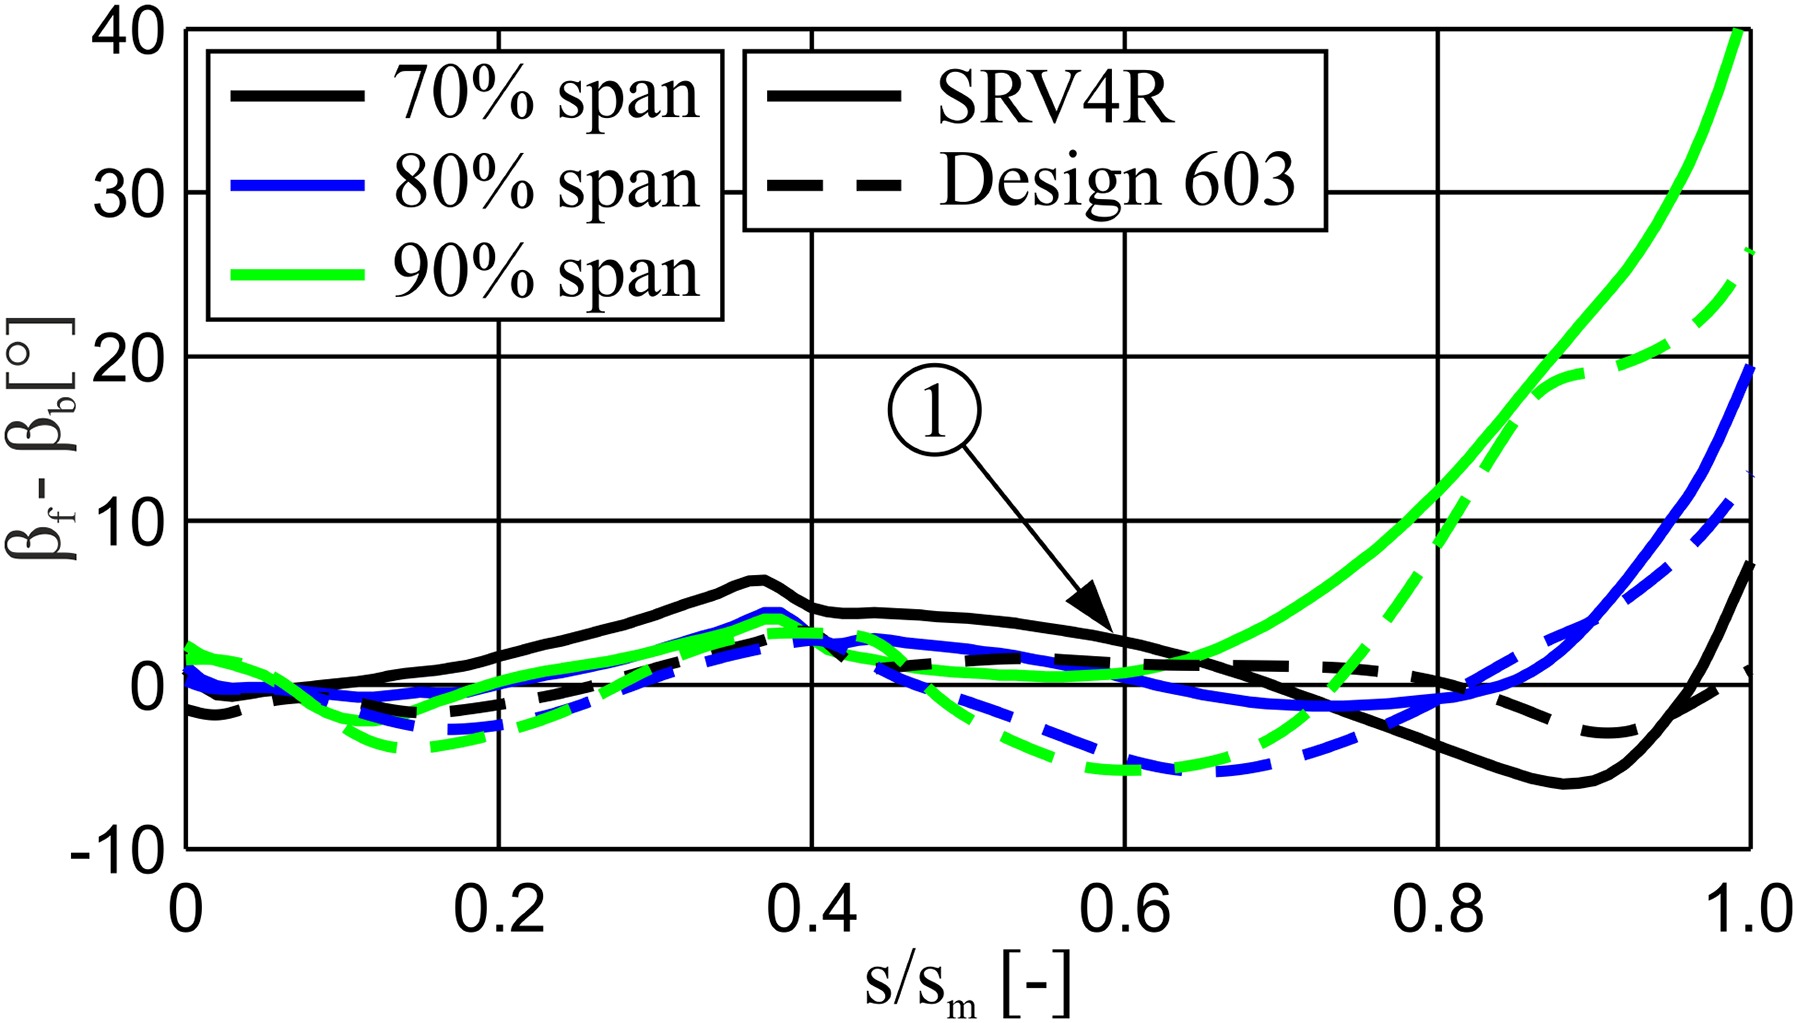
Once again, the onset of the flow deviation can ultimately be seen in Figure 10, which shows the difference between the circumferentially averaged fluid angle and the blade angle along the meridional length. The blade angle is defined as the angular difference between the camber curve and a plane normal to the axis of rotation, so that positive values of the angular difference relate to a flow in the direction of the pressure side of the adjacent blade. As can be seen, due to the negative lean of SRV4R, in the near-tip region at 90% span the deviation starts at s/sm = 0.6 (see Figure 10-1) and so slightly further upstream than in the case of design 603. Interestingly, this difference does not count for 70 and 80% span. However, at the impeller outlet (s/sm = 1.0) the deviation at all three spans is larger than for design 603.
Influence of blade curvature
Figure 11 shows the blade angle and loading distribution along the meridional length for both impellers close to the shroud. The absolute value of the blade angle is concealed by subtracting a reference value. It is noteworthy that for SRV4R, the blade angle continuously decreases, whereas for design 603 blade curvature changes its sign several times. According to the simplified momentum equation in a direction normal to the camber curve in the relative frame of reference (Van den Braembusche, 2015)
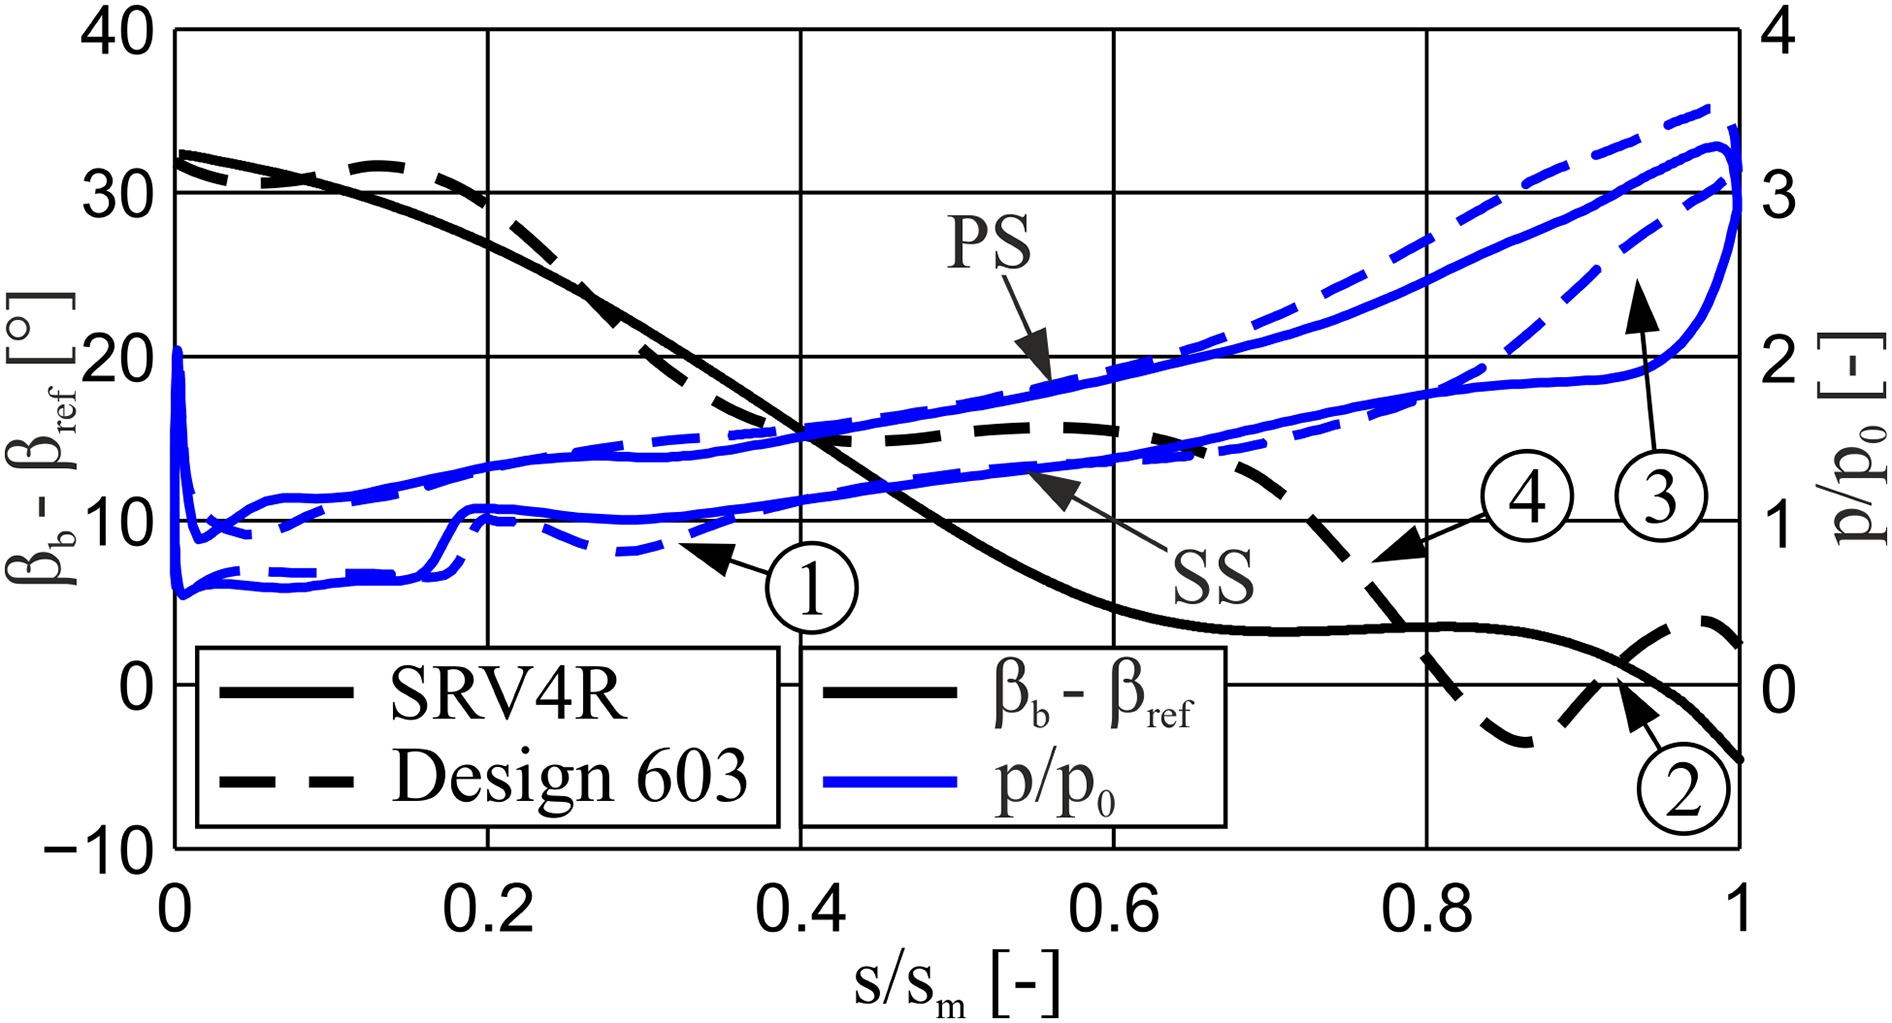
the blade loading is significantly affected by the sign of the local radius of curvature Rb (first term on RHS in Equation (2)). In case of a negative curvature or a decreasing blade angle, for instance, the pressure difference across the blade strengthens. For the purpose of analysis, blade angle and loading distribution must be compared directly with each other. Differences in blade loading, for example, appear at 25% and 90% meridional length. In the case of the former, the blade of design 603 is strongly curved and the negative radius of curvature leads to a very high blade loading locally (see Figure 11-1). However, at around 90% meridional length, blade curvature values become positive (see Figure 11-2). The centrifugal force therefore, which is induced by streamline curvature, points towards the suction side and therefore lowers the blade loading. For that reason and in contrast to SRV4R, the blade is considerably less loaded near the trailing edge (see Figure 11-3).
In order to examine the influence of the different blade loading on the flow pattern in the near-tip region, the meridional velocity distributions at 50% gap height are contrasted in Figure 12 (note that the regions enclosed by the magenta line relate to negative meridional velocities).

In general, the momentum of the tip-leakage flow depends on the rotor tip loading. The direction of the tip-leakage flow, in a first approximation, can be assumed to be perpendicular to the camber curve and therefore, if the blade angle exceeds 90° (compare Figure 12), a portion of the tip-leakage flow is directed upstream. The blade loading can therefore be considered as the driving force for the interaction of the tip-leakage with the main flow and the onset of local reverse flow respectively. This can be seen by a combined analysis of Figures 11 and 12. At the impeller inlet where the blade loading is very high, for instance, the development of a funnel-shaped reverse flow region caused by the tip-leakage flow can be observed (see Figures 12-1 and 12-2).
Although further differences between SRV4R and design 603 persist, the focus should shift to the impeller outlet. Again, the different blade loading can be identified by the sign of the meridional velocity. While for SRV4R similarly to the inlet section, a funnel-shaped reverse flow evolves (see Figures 12-3 and 12-4), this does not apply in the case of design 603. Instead, the meridional velocity in the channel between the suction side of the main blade and the pressure side of the splitter blade is positive (see Figure 12-5). The same also applies to the adjacent channel. However, the reverse flow keeps up to the impeller outlet here (see Figure 12-6), probably caused by the strong curvature around 70% meridional length (see Figure 11-4). In summary, the occurrence of the return flow in the circumferentially averaged solution at the impeller outlet of SRV4R, can now be considered as a direct consequence of negative blade curvature.
It should be mentioned that for a more detailed comparison, the blade loading shown in Figure 11 has to be weighted with the cosine of the local blade angle. This is because in this particular case the onset of reverse flow only relates to the momentum of tip-leakage flow in meridional direction. For reasons of simplicity, this was not done here.
Test results
In the following, measured performance characteristics of SRV4R and design 603 are compared to each other. Since, at the time of writing, further measured values of the optimized design are not available, measurement results of the flow in the diffuser including a comparison to CFD results are only presented for SRV4R.
The measurements were carried out on a large-scale centrifugal compressor test rig at the Institute of Jet Propulsion and Turbomachinery at RWTH Aachen University. The test rig is designed as an open loop circuit and operates under atmospheric conditions. Power is provided by a 2 MW asynchronous machine. A cross-section of the test rig is shown in Figure 13. It should be noted that the test rig was designed in combination with a volute and that the thermodynamic state at the outlet was measured downstream of the volute. Because the volute was included neither in the optimization process nor in the numerical simulations shown in this article, additional probe and pressure measurements in the diffuser channel were conducted for the validation of the CFD results.
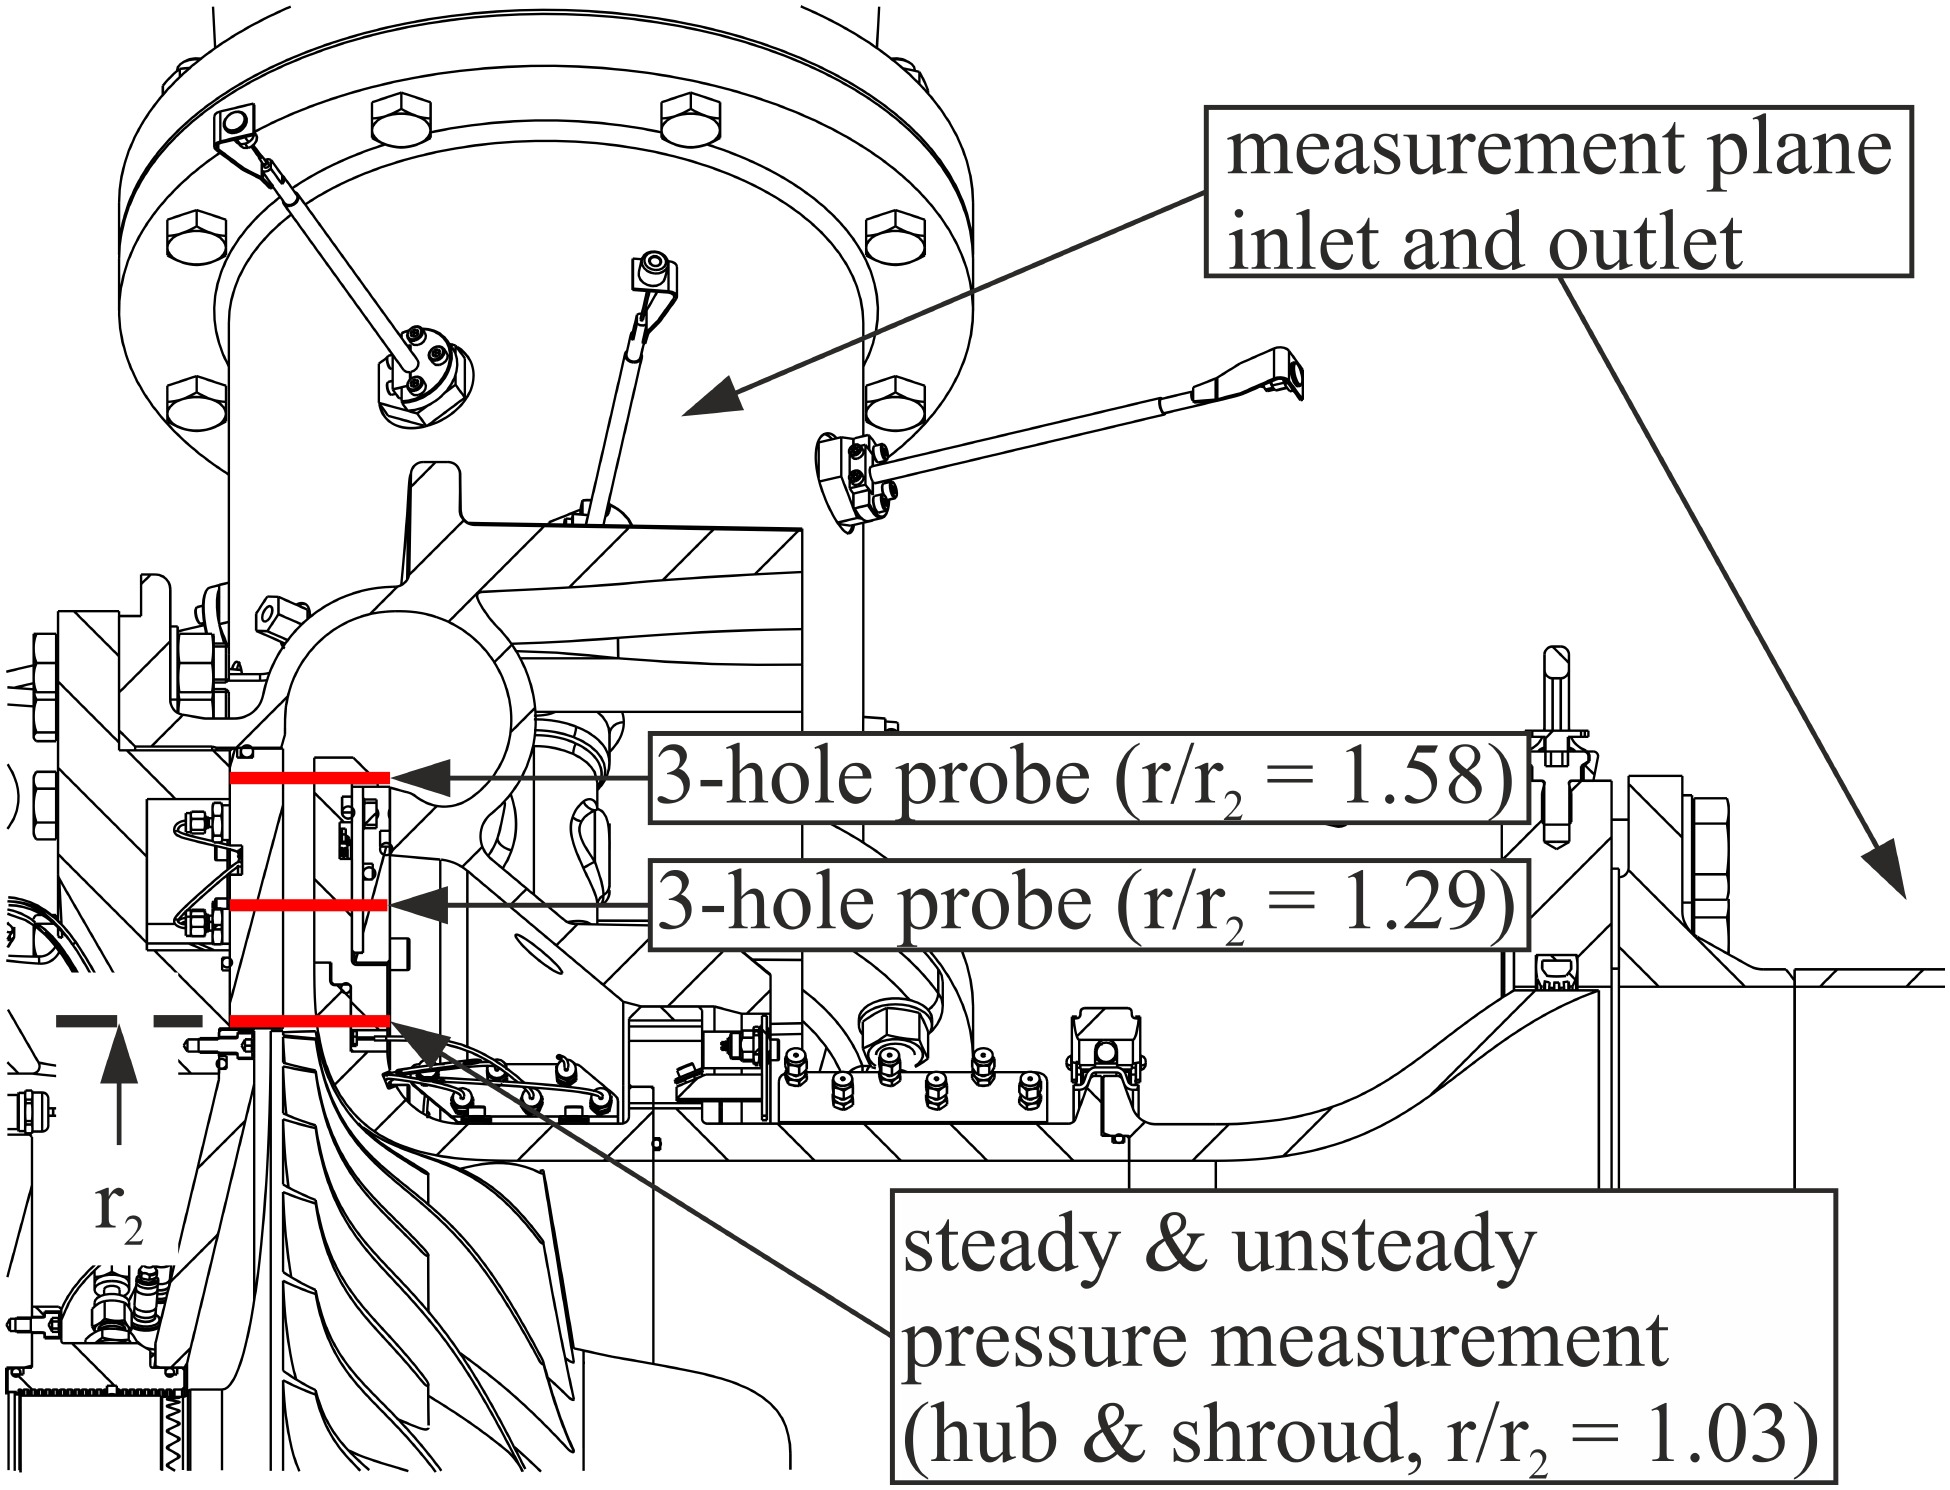
Figure 14 shows the measured performance characteristics for both impellers at nominal speed and 70% speed. The pressure ratio and the associated temperature measurements for the determination of the efficiency were evaluated downstream of the volute. As can be clearly seen, the measured efficiency improvement at nominal speed is only 0.20% and hence lower than the estimated improvement of the numerical optimization. This can be explained by the fact that the volute used was one of a current series of an industrial partner and so does not exactly match the impeller exit flow angle. In the measurements for both impellers this could clearly be seen in a circumferential asymmetric pressure distribution in the diffuser in OP1. For that reason Figure 14 shows also performance data at 70% speed, where the impeller exit flow angle of both designs and the design inlet flow angle of the volute coincide very well. The uncertainty due to the influence of the volute can therefore be neglected at 70% speed. Without further explanations, it can be stated that the way the optimized blade geometry affects the secondary flow development at 70% speed is mostly the same as it is for nominal speed. For this purpose, the optimized blade geometry shows a higher efficiency of about 2.80%, which is close to the difference predicted by numerical investigation at part load (Hehn et al., 2017).
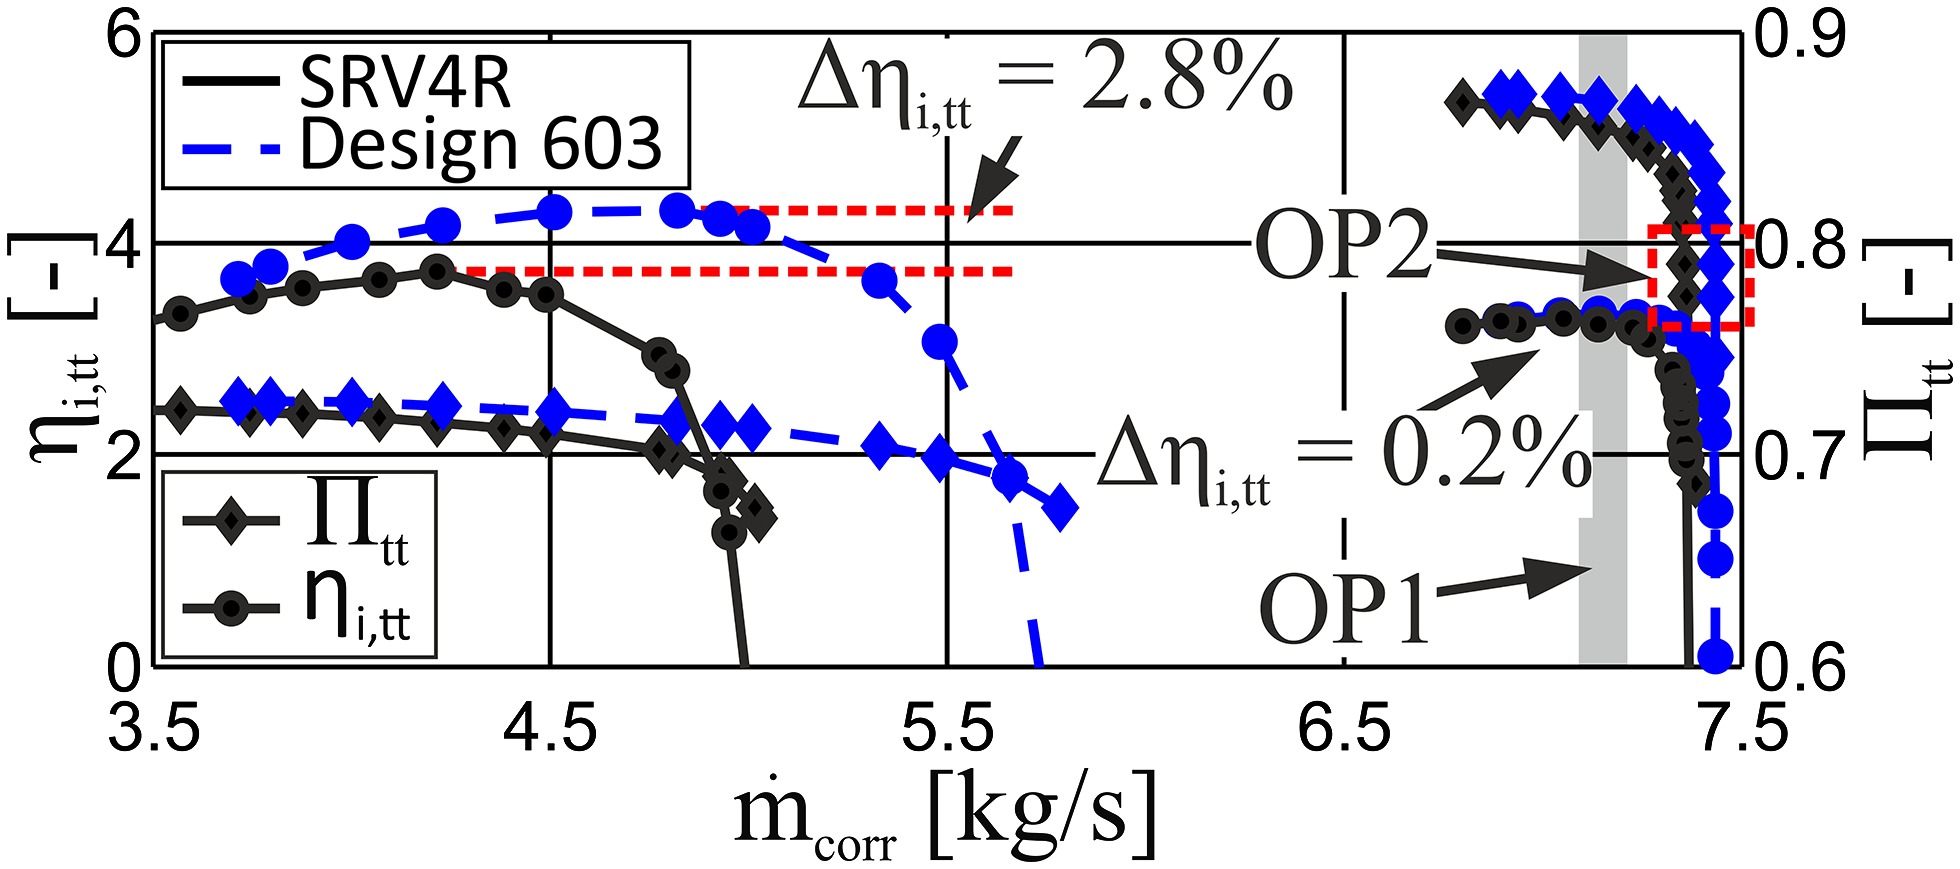
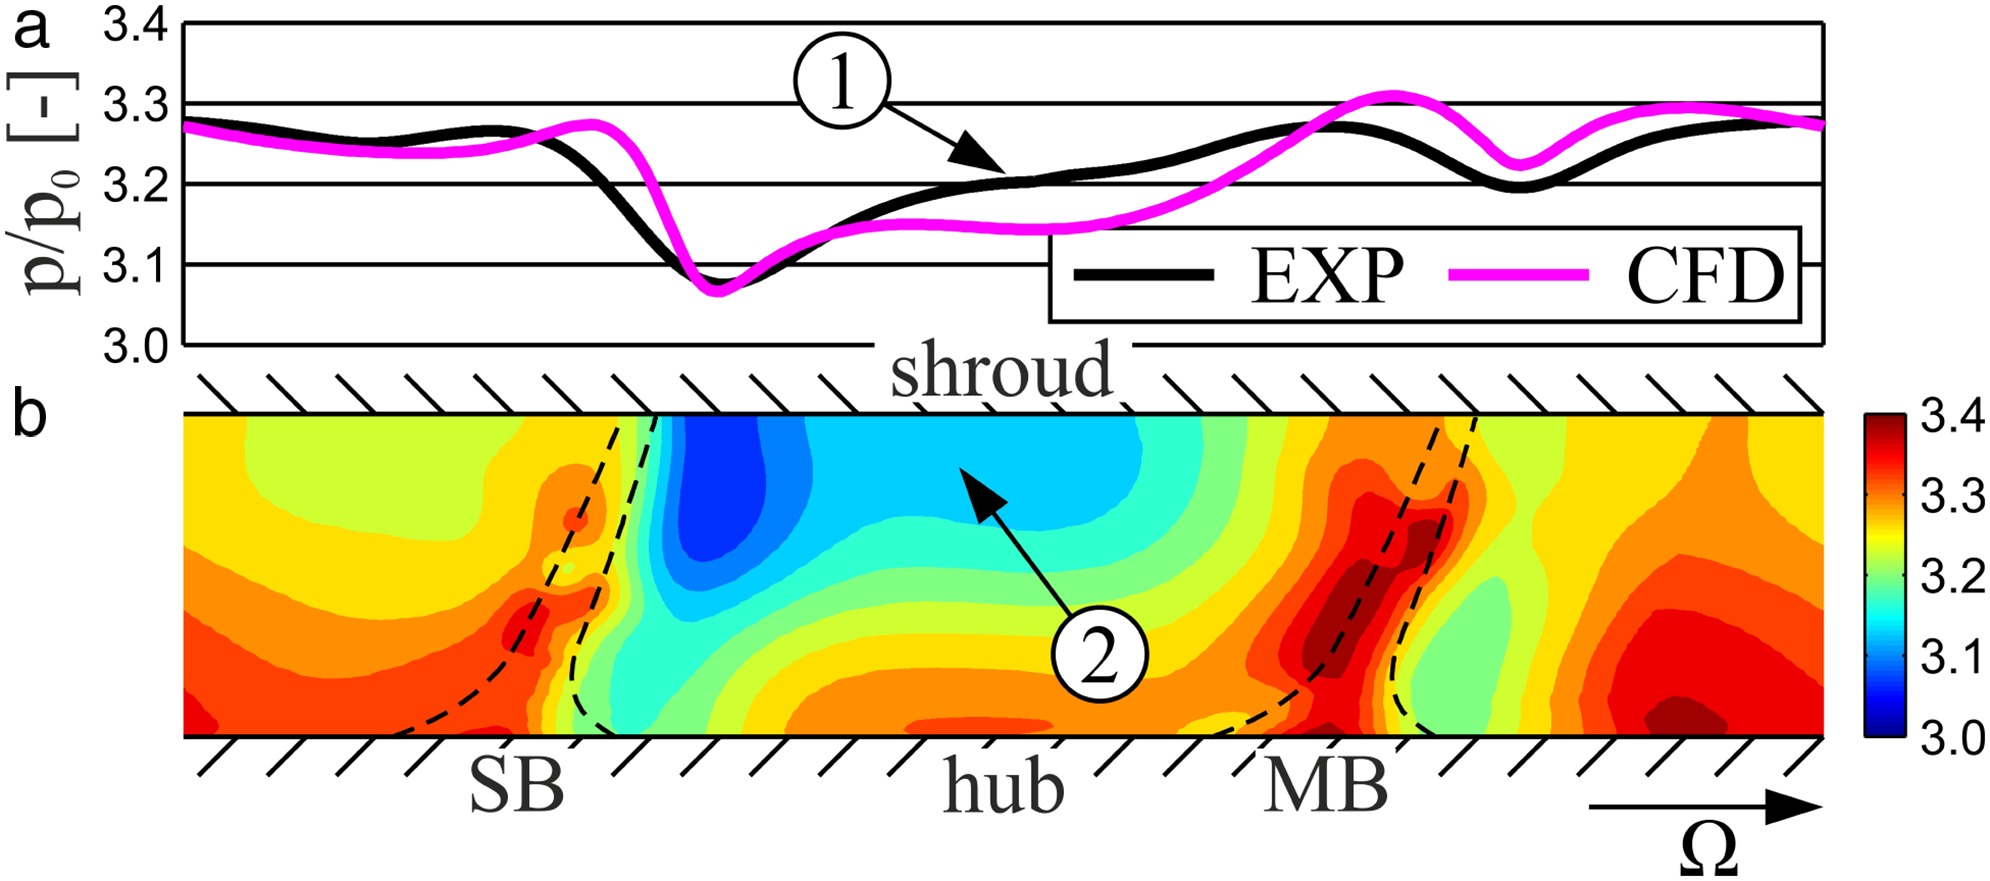
Figure 15 compares the pressure distribution at the impeller exit for SRV4R in OP1. The experimental results were obtained from instantaneous pressure measurements on the shroud side (see Figure 15). The pressure was recorded by means of a piezoresistive pressure transducer. Approximately 10,000 samples of the pitchwise pressure distribution were used for ensemble averaging. The test results are in a good agreement with the CFD results. It is important to mention that the flow deviation in the exducer part of SRV4R (see Figure 10), with some limitations to the numerical results, is also visible in the pressure distribution measured. So, to enable a better understanding, Figure 15 also shows a contour plot of the calculated pressure distribution. It is obvious that the comparatively low pressure level in the centre of the main channel (see Figure 15-1) is linked to a low pressure area, which extends almost as far as half the channel height (see Figure 15-2). This can be explained by the fact that the flow deviation takes place in the direction of the adjacent pressure side and thus against the direction of rotation of the impeller. As a result, this flow exhibits less swirl and so the static pressure is much lower too.
The particular impeller outflow characteristics of SRV4R can finally be seen in Figure 16, which shows the flow angle distribution across the diffuser width at different radii. The flow angles were measured by means of a cylindrical 3-hole probe. Because of design limitations, no radius measuring smaller than r/r2 = 1.29 could be realized. Due to the above mentioned influence of the volute in OP1, Figure 16 shows the measurement results in the matching point of impeller and volute at nominal speed (OP2). The secondary flow development within the impeller does not differ significantly for both operating points, as could be derived through numerical investigation.
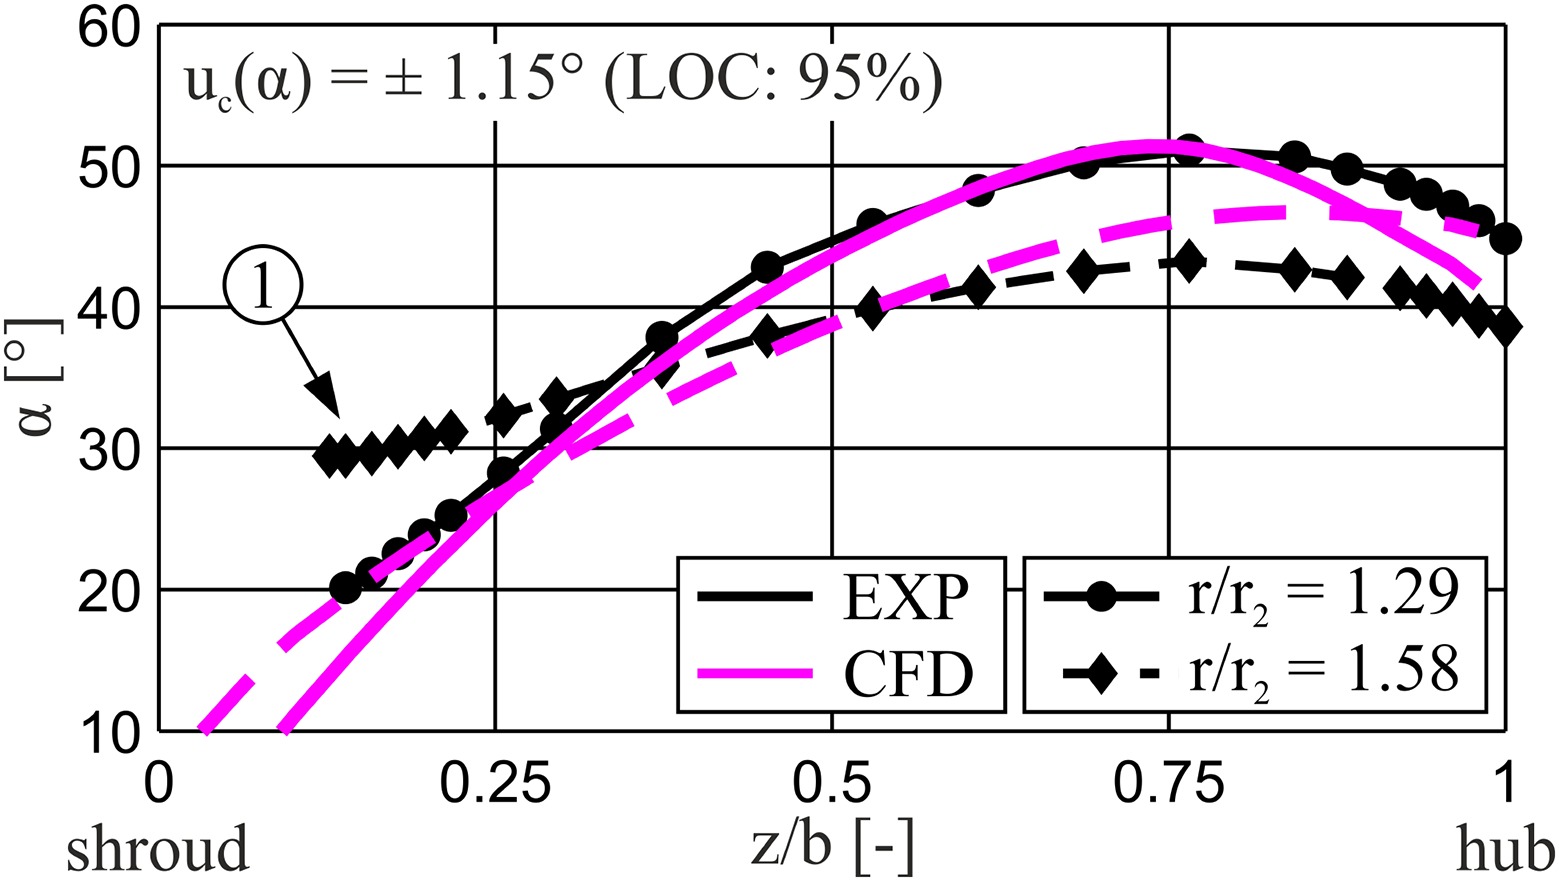
Once again, the results are in good agreement in qualitative terms. Both steep and flat flow angles near hub and shroud are proven by the measurement results. It should be mentioned that the discrepancies close to the shroud (see Figure 16-1) might be caused by the interaction of the probe head and the shroud endwall, since the distance to the shroud, for instance at z/b = 0.12, is much less than the probe head’s diameter.
Conclusions
This article investigates the influence of blade geometry on the secondary flow development in a transonic centrifugal compressor. To this end, two distinct compressor designs, whose blades are comprised of ruled surfaces (baseline design) and arbitrary blade surfaces (optimized design) respectively, are compared. The arbitrary blade surfaces were generated by means of a numerical optimization process, as described in detail in a previous work published by the authors.
The optimized design benefits from a gain of 1.76% in total-to-static efficiency when both designs are compared at the diffuser outlet. The improvement is mainly due to a more uniform flow at the impeller outlet, which in turn lowers the loss generation within the diffuser channel. The main findings can be summarized as follows.
Due to the positive blade lean in the near-tip region of the optimized design, the formation of the blade surface vortex is reduced. Hence, on the suction side of the main blade, the migration of low-energy fluid from hub to shroud is decisively suppressed. By way of contrast, in case of the baseline design, close to the shroud the low-energy fluid is further deflected to the pressure side of the adjacent blade and therefore leads to a significant flow deviation at the impeller exit.
At the impeller exit, blade curvature of the optimized design changes its sign to positive values. The blade loading therefore decreases and the onset of a local reverse flow region close to the suction side of the main blade is suppressed. As a result, in the circumferentially averaged solution, a flow separation at the impeller exit vanishes.
Blade lean and blade curvature help to homogenize the flow profile in axial direction at the impeller exit. Hence, both lean and curvature and thus the use of arbitrary blade surfaces, instead of ruled surfaces are, as far as possible and appropriate, highly recommended design measures.
The validation of the numerical optimization is verified experimentally in terms of performance measurements at nominal speed and 70% speed. For the baseline design, further measured values are in very agreement with numerical results. The inhomogeneity of the impeller outlet flow is proven in terms of instantaneous pressure and probe measurements within the diffuser.
Nomenclature
603
design number of the optimized compressor
ANN
artificial neural network
b
pitchwise direction or width [mm]
c
absolute velocity [m/s]
d
diameter [mm]
LOC
level of confidence
MB
main blade
corrected mass flow [kg/s]
OP1
operating point at maximum efficiency
OP2
matching point of impeller and volute
PS
pressure side
p
static pressure [Pa]
R
gas constant [J/kg K]
Rb
radius of curvature [mm]
RPM
revolutions per minute [1/min]
r
radius [mm]
SB
splitter blade
SRV4R
fast rotating centrifugal compressor 4 radial
SS
suction side
s
specific entropy [J/kg K]
s/sm
normalized meridional length [-]
TPR
total pressure ratio [-]
u
peripheral velocity [m/s]
uc
combined measurement uncertainty according to Gaussian error propagation
w
relative velocity [m/s]
y+
dimensionless wall distance [-]
Z
no. of Blades [-]
z
coordinate in axial direction [mm]