
Introduction
A digital-twin is a virtual representation of a physical asset and consists of a set of different physics-based models and advance analytics to assess the current state of the physical asset. (Rasheed et al., 2019) reported the challenges, methodologies and techniques related to the development of digital-twins. (Palensky et al., 2022) reported the history of digital-twins, fundamental properties and how digital-twins are related to different power systems. Other studies (Xu et al., 2019; Pan et al., 2020; Huang et al., 2021; Onile et al., 2021; Hu et al., 2022) have reported the application of digital-twins within power systems. In a previous study (Panov and Cruz-Manzo, 2020), a gas turbine real-time executable digital-twin (RT xDT) was reported. It comprised of different functionalities such as monitoring, tracking, diagnostic (detection/isolation), prognostic (prediction/life estimation) to address the requirements of future industrial gas turbines. In this study, a sensor fault diagnostic system to detect/isolate and accommodate faults in sensors from an industrial gas turbine has been developed and integrated within the RT xDT reported in a previous study (Panov and Cruz-Manzo, 2020). The architecture of the RT xDT consists of a real-time model predictor, estimator, Kalman tuner, and sensor diagnostic module. The sensor fault diagnostic module of the RT xDT considers analytical sensor redundancy using a reference engine model to provide redundant estimates of measured engine variables (e.g., pressure, temperature). The sensor fault diagnostic system is also based on model-based approach considering as a base-line a twin-shaft gas turbine model comprising engine component maps and thermodynamic equations. (Patton and Chen, 1993) reported an overview of model-based fault diagnosis (fault detection and isolation) using analytical redundancy. The authors also reported that the residual generated by the mathematical model can be insensitive to modelling errors, but sensitive to faults through the combination of disturbance de-coupling design and the adaptive threshold decision making. In this study, a dual lane control configuration is considered in the gas turbine control system in which one lane is in the control mode while the other is in the back-up mode. Once a sensor fault is detected, a re-configuration of the control system is carried out. A Software-in-the-Loop (S-i-L) architecture is constructed in Simulink environment to simulate the performance of the sensor diagnostic module (fault detection/ fault isolation) during failure in the compressor pressure sensor from the gas turbine. In addition, a Hardware-in-the-Loop (H-i-L) facility comprising a programmable logic controller (PLC) from a real gas turbine system is considered to assess the sensor diagnostic module. The H-i-L simulates a real-time failure in the compressor pressure sensor from the gas turbine. The sensor fault diagnostic system is also assessed with a real gas turbine system. The results demonstrated that when the discrepancy between a virtual measurement (provided by RT xDT) and a sensor measurement (pressure) exceeds the prescribed tolerance levels, the sensor fault diagnostic logic determines the soft sensor logic (SSL) in the dual lane control configuration and a reconfiguration of the control system is carried out.
Real-time executable digital-twin
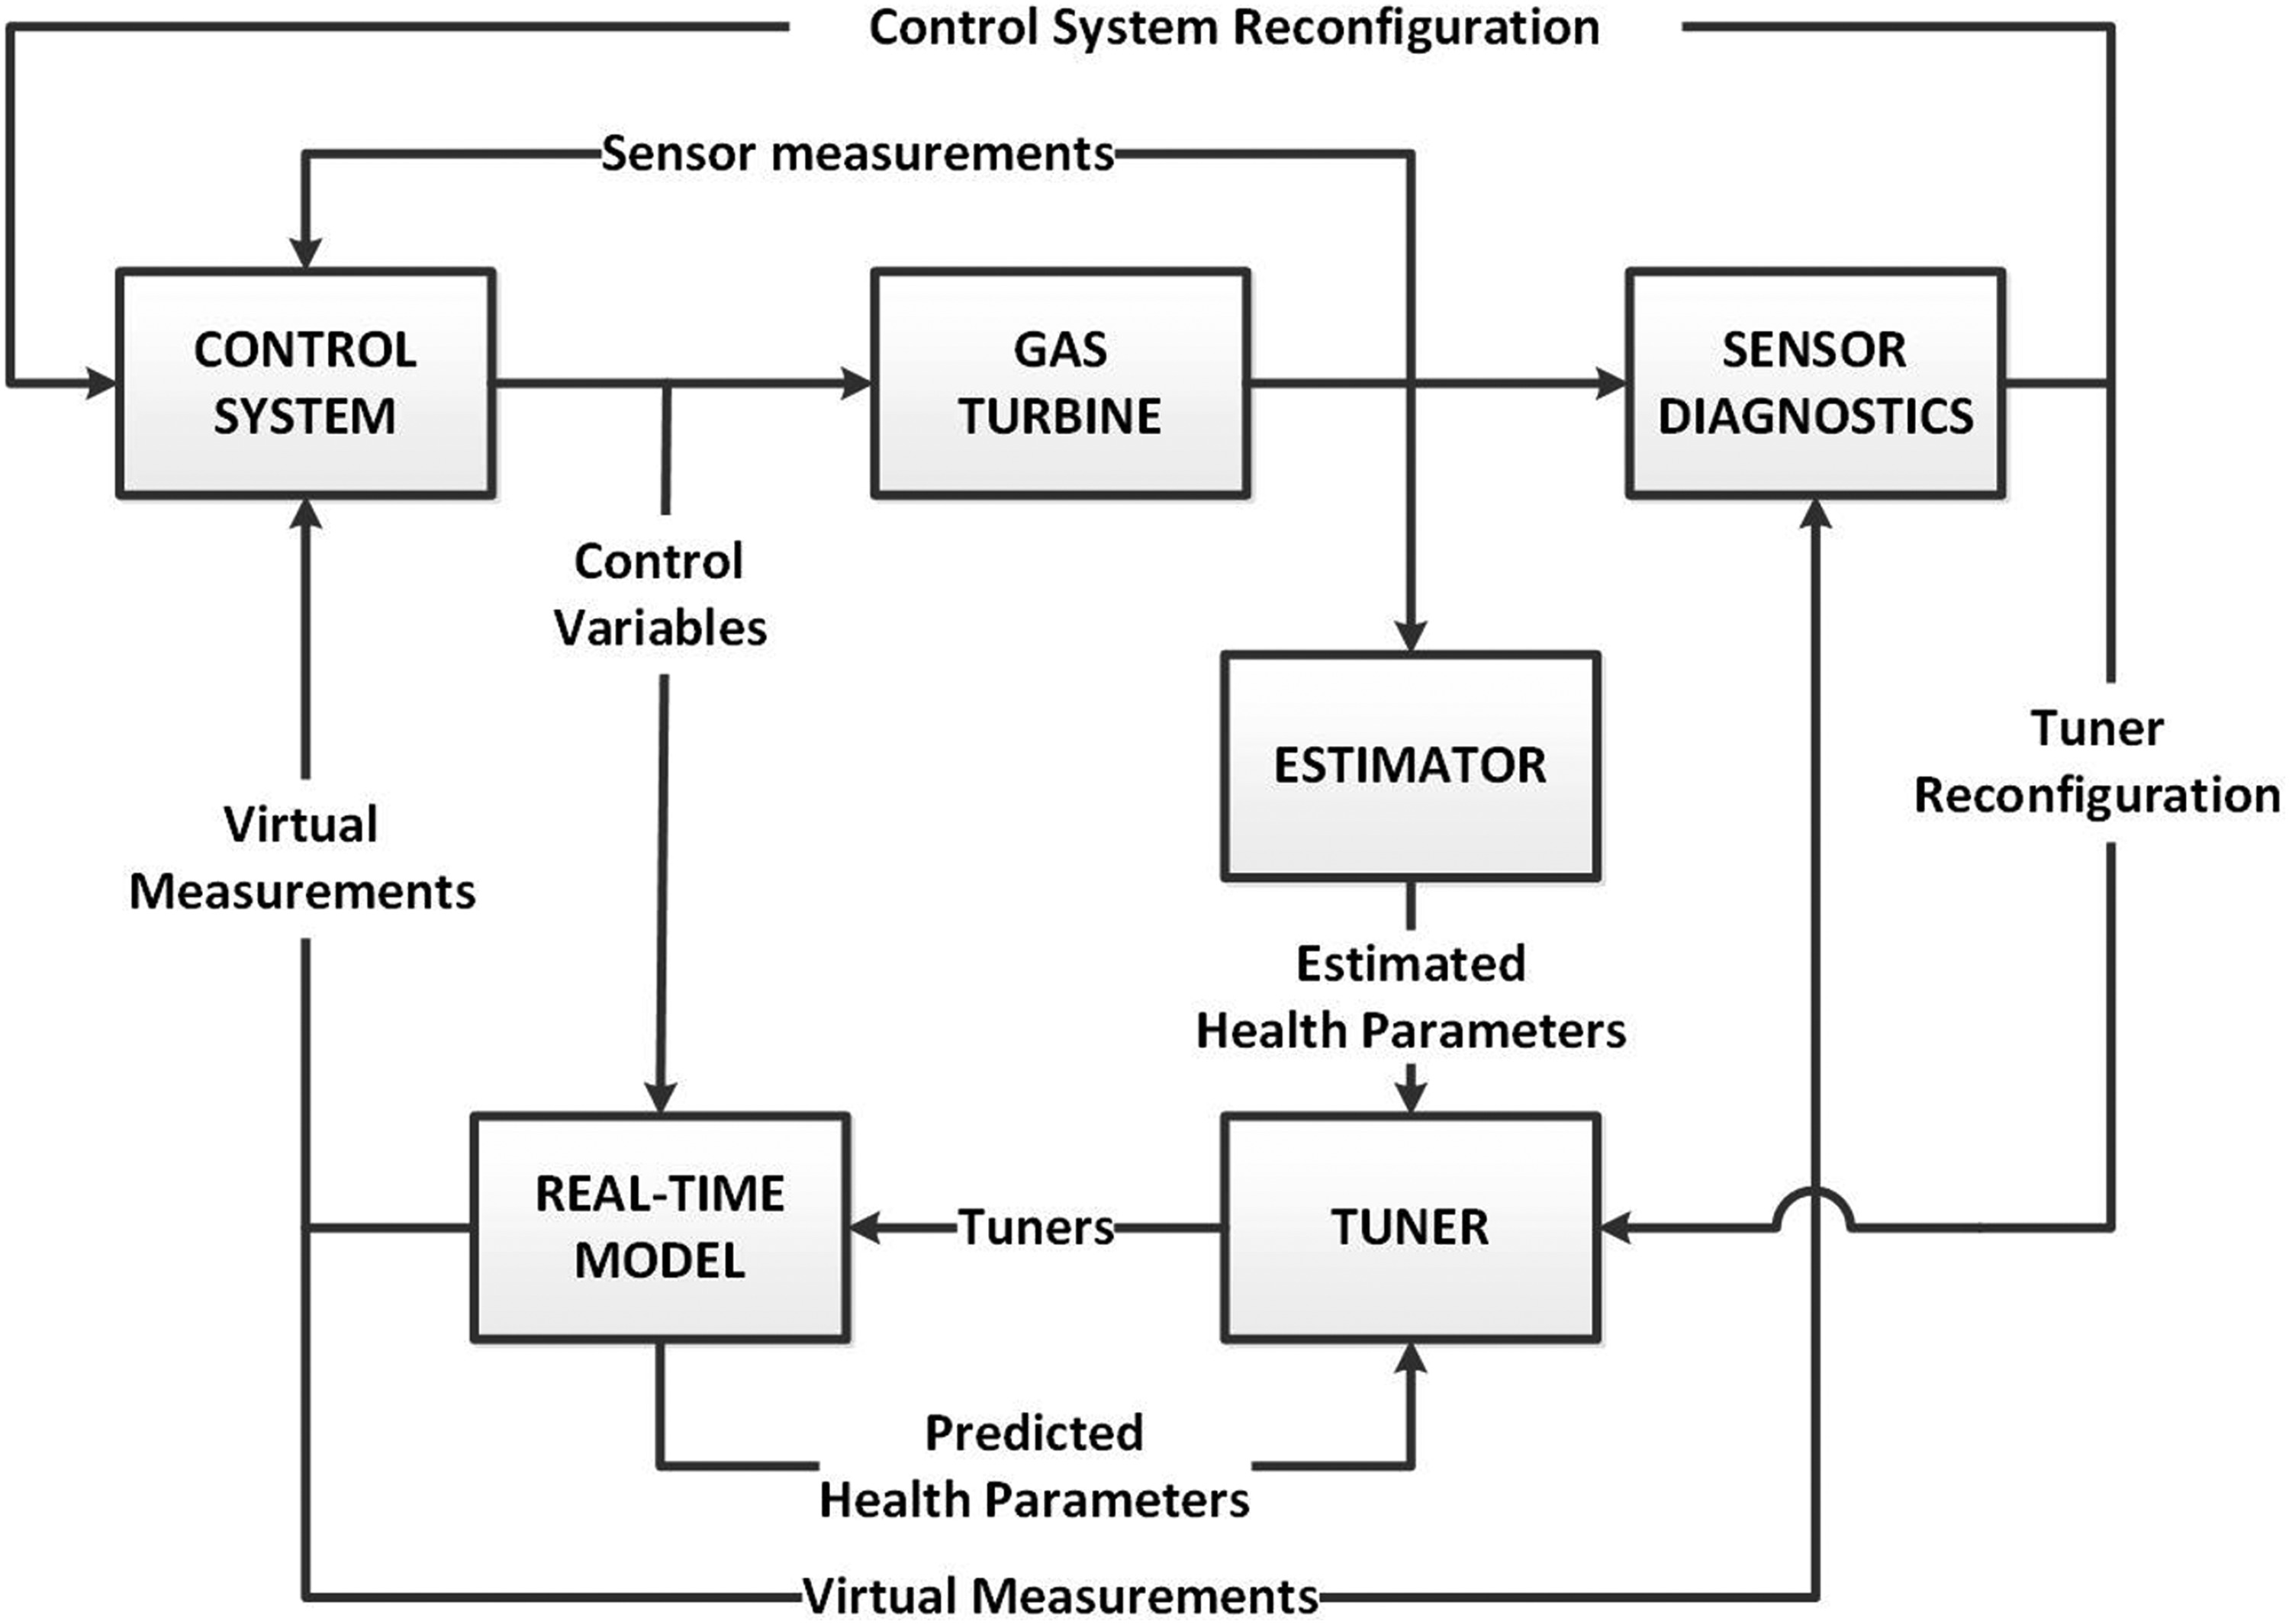
The RT xDT is comprised of a real-time model (RTM) predictor, estimator, Kalman tuner and sensor diagnostic module as shown in Figure 1. The architecture of the RT xDT is constructed in Simulink environment. The RTM module consists of a real-time physics-based nonlinear dynamic gas turbine model. Maps of the flow capacity and efficiency of the different components of a twin-shaft gas turbine are considered in the dynamic gas turbine model. Equations describing conservation of mechanical and thermodynamic energies as well as the mass flow balance are defined in the estimator module of the RT xDT. Nominal health parameters such as flow capacity and efficiency are generated by predictor module, estimated health parameters are generated by the estimator module, and deployed Kalman Tuner provides tuned (smooth) health parameters. The sensor fault diagnostic module detects and isolate faulty sensors. A re-configuration of the control system and tuning process in the RT xDT can be carried out depending on the severity of the sensor failure. Further information about the modules comprising the RT xDT can be found in the authors’ previous study (Panov and Cruz-Manzo, 2020). Virtual measurements are generated by real-time prediction model of Digital Twin, and they can be used as synthetic sensors for measurements that are not available on the physical gas turbine, or (as presented in this contribution) as an analytical redundancy for existing measurements of physical system. Once when fault is detected by sensor diagnostic logic, accommodation of isolated fault is carried out by controls system reconfiguration in dual lane control logic. In case of detected fault in measurement channel, reconfiguration of tuner process is also required to account for reduced ability of digital twin to align itself with physical gas turbine system, and therefore adjusted tuners for specific health parameters are synthesised.
Engine model
The engine model is based on non-linear differential equations describing the thermodynamic performance of a twin-shaft gas turbine. Further information about the engine model can be found in the study from (Panov, 2009). The components comprising the gas turbine model have been divided into two groups: the gas generator and the free power turbine. The gas generator considers the compressor, combustor, compressor-turbine, and shaft connecting compressor and compressor-turbine. The power turbine, interduct, load, and mechanical shaft connecting the power turbine and load represent the free power turbine components. The gas turbine model can be expressed with a system of non-linear differential equations in state space:
where x represents the state vector for the thermodynamic and mechanical processes, u represents the control vector, v is the vector of operating conditions and h represents the vector of health parameters such as efficiencies and flow capacities of the different stations of the twin-shaft gas turbine. The vectorThe health parameters can provide relevant information about the deterioration state of the gas turbine (Cruz-Manzo et al., 2018). The health parameters of the gas turbine components are efficiency of compressor
Sensor models for thermocouples, pressure transducers and speed probes are considered in the gas turbine model. A sensor model can be represented through the following mathematical expression (Panov and Maleki, 2017):
where
Analytical redundancy – sensor fault diagnostic
The sensor fault diagnostic module of the RT xDT considers analytical sensor redundancy. The concept of analytical redundancy and the mathematical characterization of redundancy for sensor fault detection in dynamic systems have been reported in the study of (Chow and Willsky, 1984). Equation 6 represents the general expression for analytical residual considering a deviation of the measured value (real sensor) with respect to the simulated (gas turbine model) value.
where
Figure 2.
Transient correction factor in Simulink environment for adaptive thresholds during the dynamic sensor response.
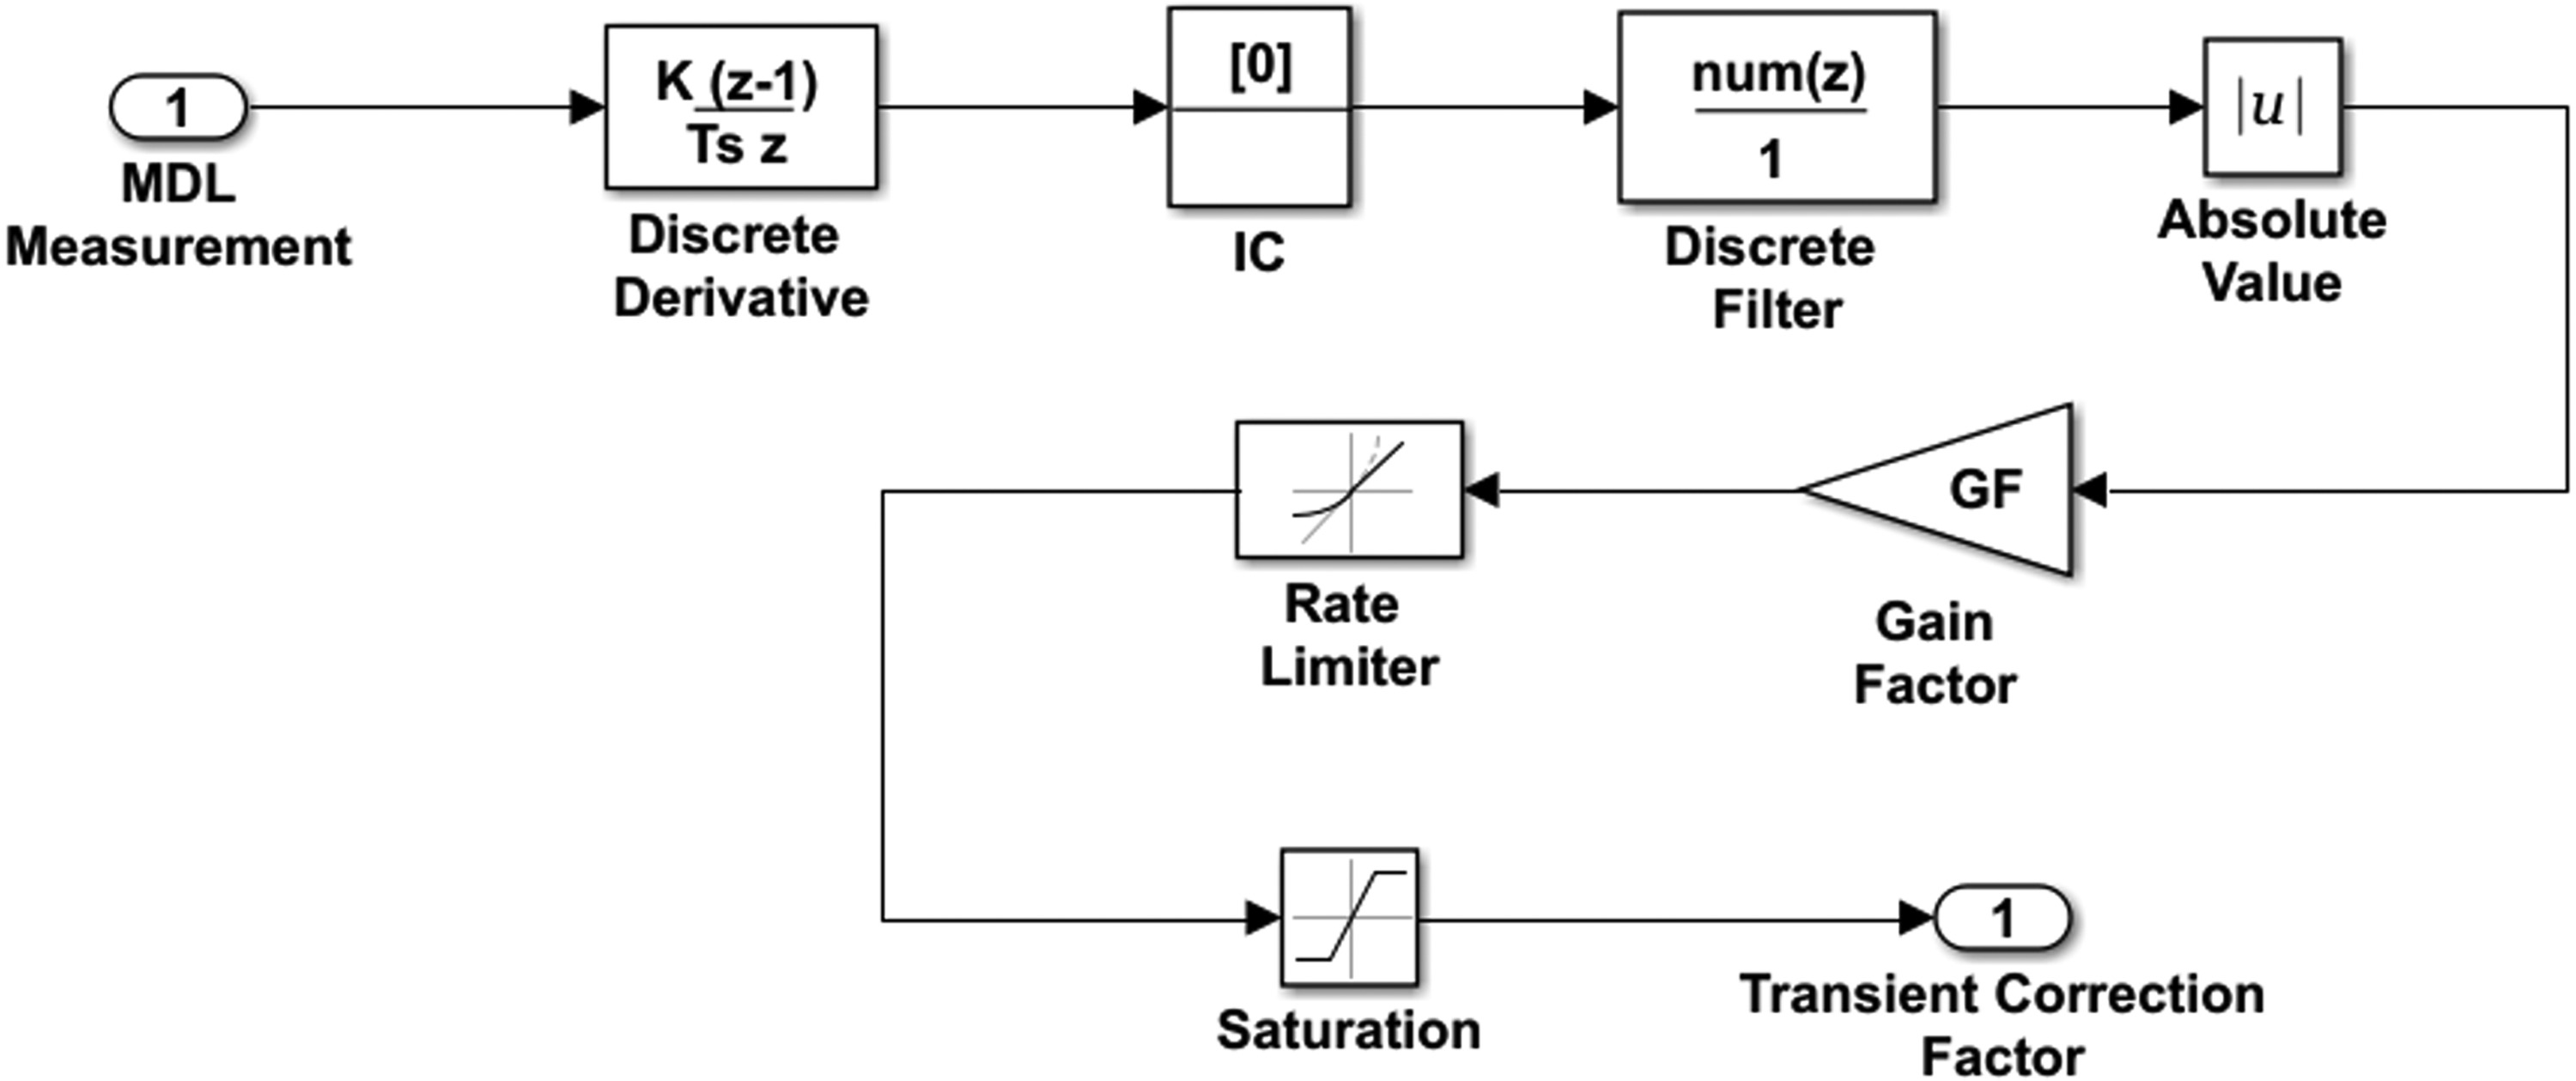
The aim of Figure 3 is to demonstrate that the sensor fault diagnostic system based on the analytical residual of the sensor measurements considers adaptive transient correction factor Γ to avoid a false alarm during the transient response of the sensor at nominal conditions (no fault). Figure 3a shows the simulated transient and steady-state responses of two independent sensors considering two independent gas turbine models. The signals shown in Figure 3a were normalized with respect to the maximum value of the first signal. Each signal represents the response of the pressure sensor of an independent compressor model for the same operating condition and considering a step change in load profile. No failure in the pressure sensor was simulated, but a bias in one sensor with respect to the other sensor was considered to account for model - real gas turbine mismatch. Figure 3b shows the analytical residual calculated from the signals shown in Figure 3a. The analytical residual does not exceed the prescribed tolerance (

Dual lane control configuration
A dual lane control configuration is considered in the gas turbine control system as shown in Figure 4. The sensor diagnostic module defines the state (0/1) of the switches SW1, SW2 in the dual lane control configuration. Once the sensor failure is detected by exceeding the prescribed tolerance levels of the analytical residual, the state (0/1) of the switches is changed and a reconfiguration of the control system is carried out. Figure 4 shows the switches and the dual lane control configuration implemented in the gas turbine control system. If the analytical residual between the virtual measurement (N mdl) and sensor measurement (N1) exceeds the prescribed minimum and maximum threshold levels, the sensor fault diagnostic system enables conservative control setting (SW1 is enabled, value of 1) and virtual measurement (SW2 is enabled, value of 1).
Figure 4.
Dual lane control configuration in the gas turbine control system. GT is gas turbine, RTM is real-time model, R1 and R2 are regulators, S1 is real sensor, SW1 is switch 1 and SW2 is switch 2. (Panov and Maleki, 2017).
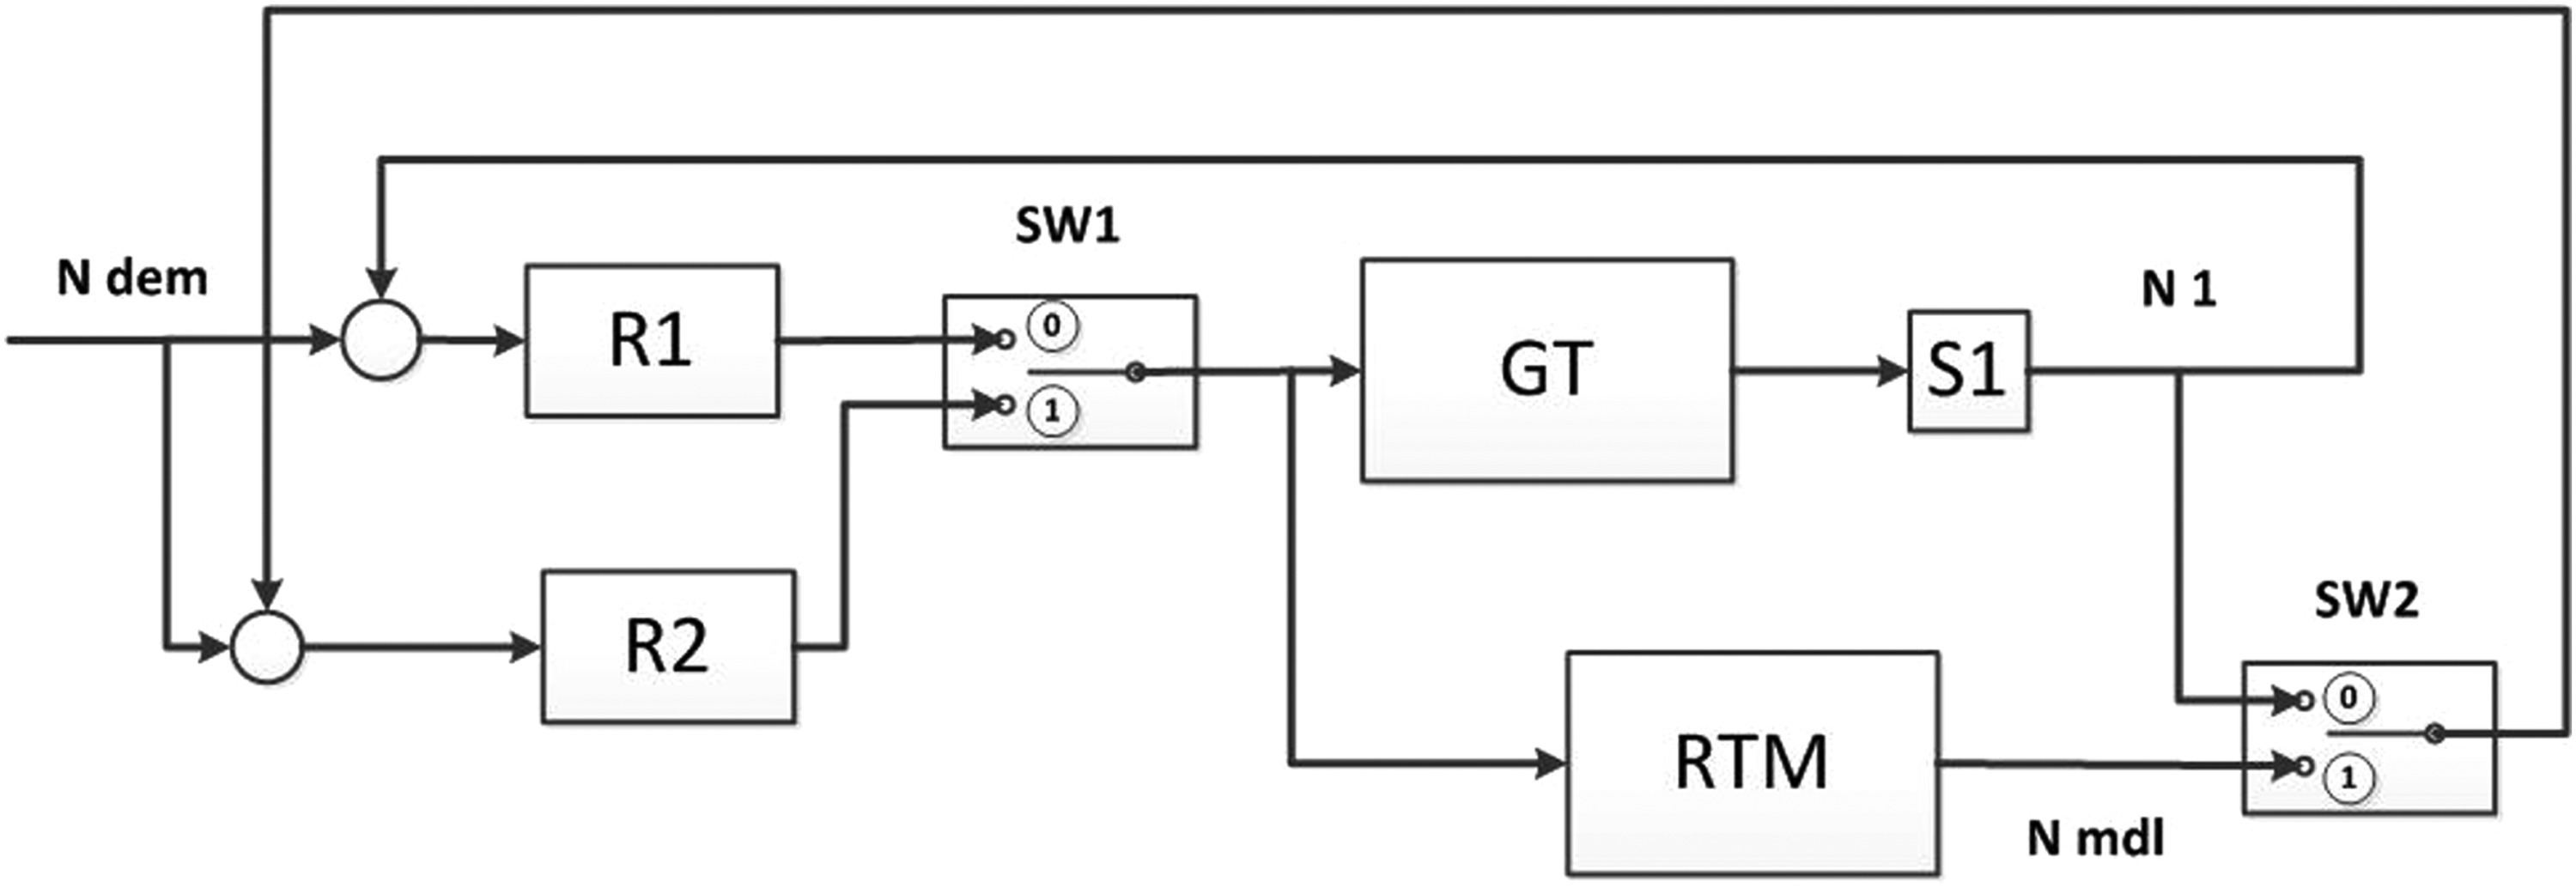
Table 1 shows the SSL defined in the sensor diagnostic module and based on the prescribed minimum and maximum threshold levels.
Results
Deviation of the real physical quantity measured by the sensor of the gas turbine with respect to the virtual signal simulated by the RTM is assessed by the sensor diagnostic module of the RT xDT. As previously discussed, the sensor diagnostic module is integrated within the RT xDT. The overall architecture of the RT xDT is constructed in Simulink environment. Failure in the compressor pressure sensor from a twin-shaft gas turbine is considered in the analysis. The development and assessment of the sensor diagnostic module has been carried out in three phases:
A S-i-L architecture is developed in Simulink environment to simulate the performance of the sensor diagnostic module.
A H-i-L facility, considering a real control system (PLC) from the gas turbine, is also constructed to assess the performance of the sensor diagnostic module in relevant hardware environment.
The RT xDT is integrated within a real gas turbine system to validate developed system in actual operational environment.
Software-in-the-loop simulation
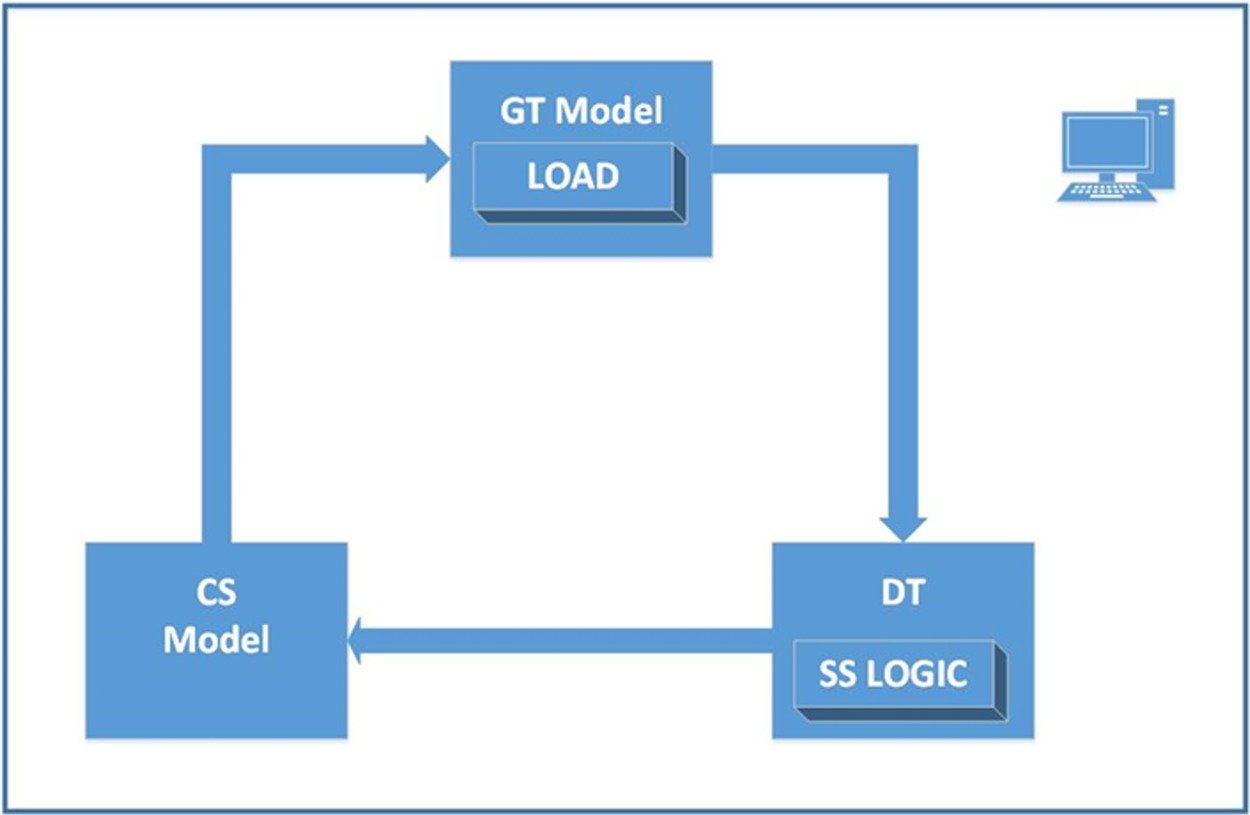
A S-i-L architecture, developed in Simulink environment, is considered to simulate the performance of the sensor fault diagnostic module of the RT xDT. The S-i-L considers a thermodynamic model of a twin-shaft gas turbine (GT Model), RT xDT module and control system module (CS) as shown in Figure 5. The three modules are constructed and interfaced in Simulink environment. The dual lane control configuration shown in Figure 4 is not considered in the model of the control system during S-i-L simulation. Therefore, under S-i-L simulation, it is not possible to simulate how the gas turbine control system accommodates the sensor failure to ensure continuous and safe operation of the gas turbine. The dual lane control configuration shown in Figure 4 will be considered in the H-i-L architecture. Nevertheless, the S-i-L architecture can simulate the performance of the RT xDT for fault detection.
Figure 5.
Software-in-the-loop (S-i-L) architecture. The S-i-L architecture comprises a gas turbine (GT) model, digital-twin (DT), and control system (CS) model. The DT considers soft sensor (SS) logic.
A failure incident in the compressor pressure sensor from the gas turbine model is simulated. A deviation (fault) of the pressure sensor signal is gradually increased with respect to its nominal value (no fault). Figure 6a shows the simulated signal of the pressure sensor of the compressor (discharge pressure) considering fault (deviation) and nominal (no fault) conditions. The deviation of the pressure sensor signal was simulated during gas turbine operation at steady-state conditions and considering high load demand. The signals shown in Figure 6a have been normalized with respect to the value of the maximum pressure at nominal conditions. In addition, the virtual measurement of the pressure sensor simulated by the RT xDT is shown in Figure 6a. The virtual signal attempts to follow the response of the faulty sensor, but when the discrepancy between the value of the compressor sensor signal and the nominal value increases, the value of the virtual sensor approaches the nominal value instead. Figure 6b shows the analytical residual calculated from Equation 6 and related to the signals of the compressor sensor and virtual sensor shown in Figure 6a. The state of the switches (0/1) defined by the sensor diagnostic module of the RT xDT is also shown in Figure 6b. When the analytical residual exceeds the minimum (min) threshold, the switch 1 is enabled (value of 1). Switch 2 is enabled when the analytical residual exceeds the maximum (max) threshold. Figure 6b also shows the adaptive minimum and maximum thresholds during transient conditions. The transient correction factor
Figure 6.
(a) Simulated deviation of the compressor sensor signal with respect to the value at nominal conditions and Simulated virtual signal of the RT xDT, (b) Analytical residual and state of switches during a gradual increase in measurement drift fault in the pressure sensor from the compressor. Minimum T min T max
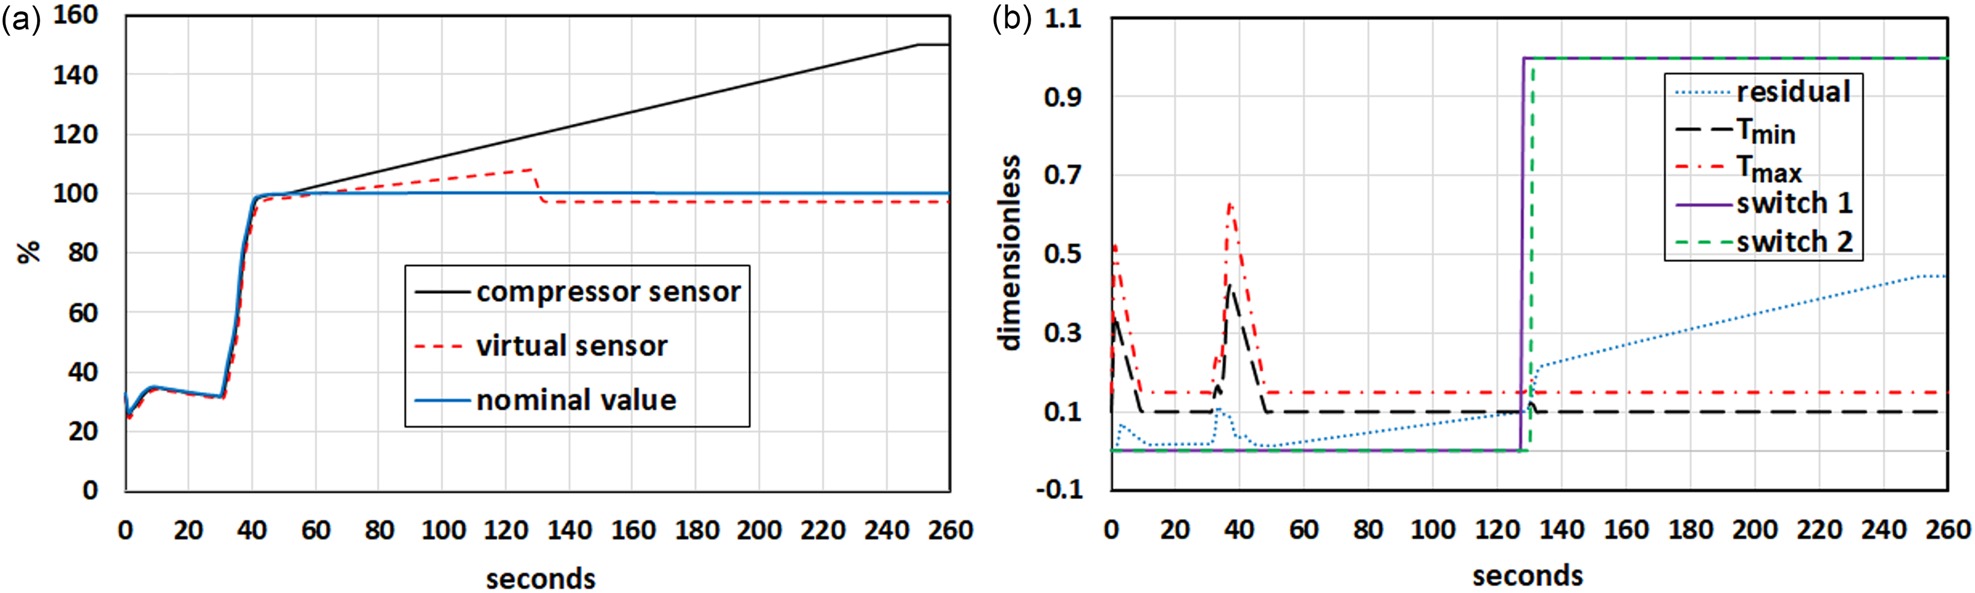
The digital-twin architecture has the capability to tune parameters in the RTM so that the virtual sensor signals account for engine-to-engine variations and gas turbine degradation (Kurz and Brun, 2001). Hence the virtual sensor initially attempts to follow the deviation of the sensor measurement before reverting to the nominal value. In the next section “Hardware-in-the-Loop Simulation”, implementation of the SSL and dual lane control configuration will be demonstrated in a real control system (PLC) of the gas turbine, to simulate in real-time the effect of the sensor diagnostic module on the control system (e.g. fuel demand).
Hardware-in-the-loop simulation
A H-i-L facility consisting of a real-time target xPC machine (Speedgoat) and control system platform (PLC) is considered to emulate in real-time the performance of a gas turbine system. Figure 7 shows the overall architecture of the H-i-L facility. It is possible to emulate in real-time the performance of the control system as well as the performance of the sensor diagnostic module from the RT xDT during failure in different sensors of the gas turbine.
Figure 7.
Hardware-in-the-loop (H-i-L), a) H-i-L facility for real-time simulation, b) Overall H-i-L architecture. Soft sensor (SS) logic is considered in the control system (CS) and digital-twin (DT).

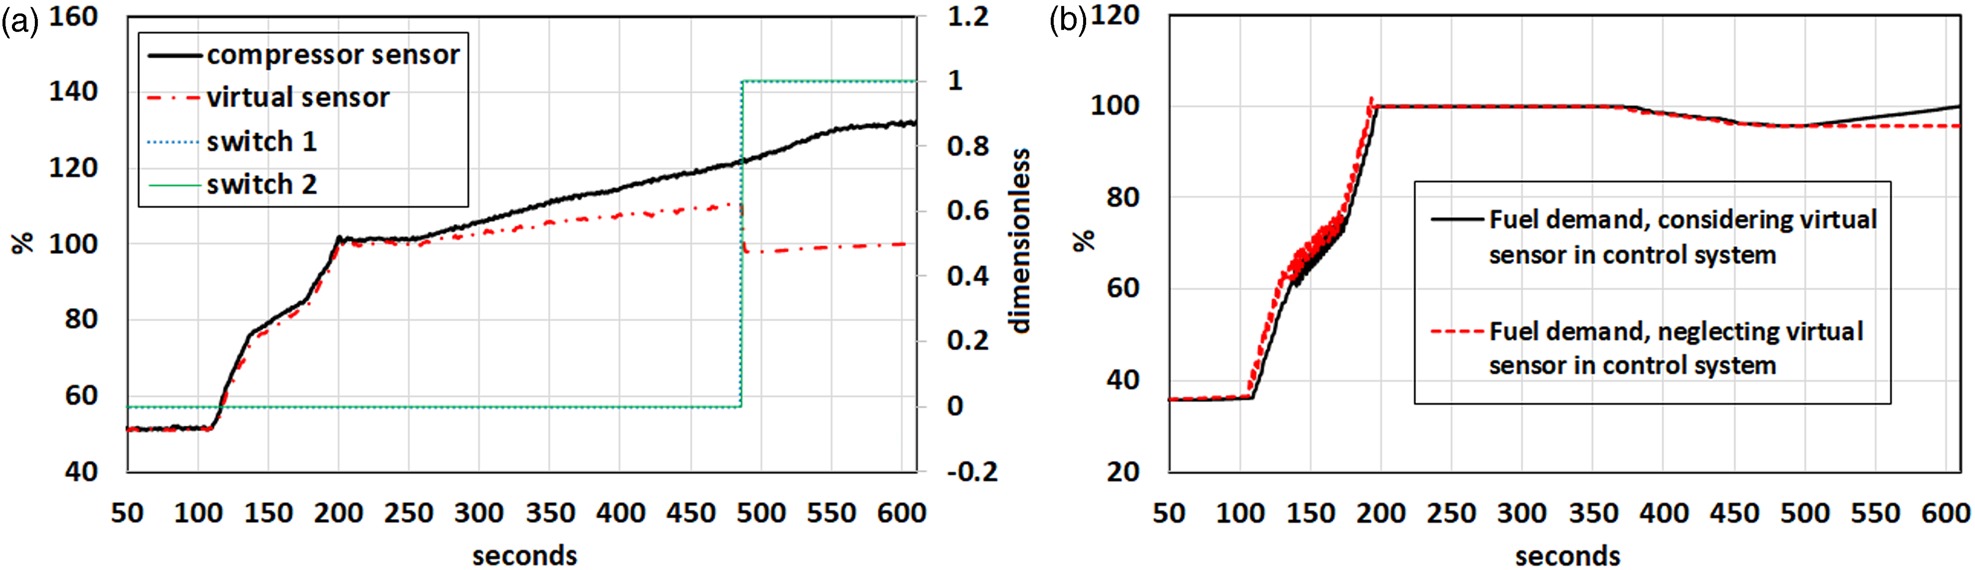
A thermodynamic model of a twin-shaft gas turbine has been developed in Simulink environment and deployed onto the xPC machine using the toolbox “Simulink Real-Time”. The RT xDT architecture has been developed in Simulink environment and deployed onto a second PLC using the Simulink toolbox “PLC coder”. The Simulink toolbox “PLC Coder” generates hardware independent software blocks according to IEC 61131–3 “Industrial-process measurement and control – programmable controllers”, the leading standard for PLC programming language. Further information about the deployment of the RT xDT architecture on the PLC can be found in the authors’ previous study (Panov and Cruz-Manzo, 2020). A sensor failure incident is simulated in the compressor pressure sensor from the gas turbine. The simulation of the sensor failure is carried out by the Simulink gas turbine model from the xPC machine. The sensor failure incident was simulated during gas turbine operation at steady-state conditions and high load demand. A gradual increase of the deviation (fault) of the pressure signal with respect to its nominal value (no fault) was simulated by the gas turbine model from the xPC machine. Figure 8a shows the sensor response related to the compressor discharge pressure and simulated by the gas turbine model from the xPC machine. Figure 8a also shows the virtual sensor simulated by RTM of the RT xDT. The signals have been normalized with respect to the maximum pressure calculated by the RT xDT (virtual sensor) and considering no failure. An increase of the deviation of the sensor response of the compressor (gas turbine model from xPC) with respect to the virtual sensor from the RT xDT is observed in Figure 8a. The response of the SSL during the sensor failure is shown in Figure 8a. Switch 2 is enabled (transition from zero to one) when the analytical residual of the signals exceeds the maximum threshold limit. Under this condition the gas turbine controller (PLC) receives the virtual measurement (signal from RT xDT) and the faulty signal from the compressor sensor (signal from xPC machine) is isolated from the system. Figure 8b shows the effect of the enabling and disabling the dual lane control configuration on the performance of the control system (PLC) during H-i-L simulation. A reduction of the fuel demand during failure in the compressor pressure sensor can be attributed to the fact that a physical variable (e.g. temperature, pressure, speed) from the gas turbine has exceeded a prescribed limiting value defined in the engine governor system. When the dual lane control configuration shown in Figure 4 is implemented in the control system, the engine controller receives the signal from the virtual sensor and the faulty sensor from the gas turbine is isolated from the overall system. Under this condition the value of the fuel demand returns to its nominal value as shown in Figure 8b. If the dual lane control configuration shown in Figure 4 is not implemented in the control system, the engine controller only receives the signal of the faulty sensor and a reduction of fuel demand (a physical variable of the gas turbine has exceeded a prescribed limiting value in the engine governor system) during engine operation is resulted as shown in Figure 8b.
Figure 8.
(a) Simulated failure in sensor of the compressor (discharge pressure) and simulated soft sensor logic from sensor diagnostic module. The virtual sensor is simulated by the RTM of the RT xDT, (b) Effect of the enabling and disabling the dual lane control configuration on the engine controller.
Digital-twin in real gas turbine system
The RT xDT was implemented within a gas turbine system comprising a twin-shaft engine and PCL platform as shown in Figure 9a. The architecture shown in Figure 9a is similar to the H-i-L architecture shown in Figure 7b, but considering a real gas turbine instead of a real-time target xPC machine with a gas turbine model. Sensor failure in the compressor discharge pressure is induced during gas turbine operation at steady-state conditions and minimum load demand. A synthetic measurement fault has been injected into the measurement channel of the compressor pressure sensor of the gas turbine system. Figure 9b shows a deviation of the measured compressor discharge pressure from nominal conditions. Figure 9b also shows the signal of the virtual sensor simulated by the RT xDT. The signals shown in Figure 9b have been normalized with respect to the signal representing nominal conditions. The signal of the virtual sensor attempts to follow the deviation of the compressor sensor signal; but as the level of discrepancy between the value of the compressor sensor signal and nominal value increases, the value of the virtual sensor is readjusted and follows the nominal value instead.
Figure 9.
Implementation of digital-twin (DT) in real gas turbine system, (a) overall architecture, (b) Failure in compressor pressure sensor from real gas turbine. The sensor failure incident is considered during gas turbine operation at steady-state conditions and minimum load demand.

The response of the SSL during the failure in the compressor pressure sensor is also shown in Figure 9b. The faulty signal from the compressor pressure sensor is isolated from the gas turbine system when Switch 2 is enabled (transition from zero to one). The results shown in Figure 9b are consistent with the results from the S-i-L and H-i-L architectures and confirm the correct operation of the sensor fault diagnostic system to diagnose sensor deficiencies and ensure continuous and safe operation of the gas turbine.
Extensive work has been carried out to validate the developed concept of the gas turbine real-time executable digital twin and its applicability to diagnose, isolate and accommodate gas turbine sensor faults. In a previous study (Panov and Maleki, 2017), it has been demonstrated the applicability of the developed method for various sensors (pressure transducer, thermocouples, etc.), as well as the capability of the method to handle single and multiple faults. In the same study, it has been demonstrated that the developed method can account for various measurements faults (measurement drift and abrupt fault), and for single and numerous combinations of multiple faults. Effectiveness of the developed gas turbine real-time “digital twin” concept to address component faults/degradation modes was also reported in a recent study (Panov, 2014) considering simulation and test environments. Deployment of the developed concept has been demonstrated in the operational environment (customer site) and the results have been reported in a respective study (Panov and Cruz-Manzo, 2020).
Conclusion
A sensor fault diagnostic module has been integrated with a gas turbine real-time executable digital-twin reported in a previous study. The sensor fault diagnostic module considers analytical sensor redundancy using a reference engine model to provide redundant estimates of measured engine variables. Sensor failure in the compressor discharge pressure is simulated using S-i-L and H-i-L architectures. Following assessment of sensor fault diagnostic module using S-i-L and H-i-L configurations, developed system was also validated with a real gas turbine system. The results demonstrate that during the sensor failure in the gas turbine, the proposed Fault Diagnostic, Isolation and Accommodation (FDIA) system, based on the soft sensor logic in a dual lane control configuration, can ensure continuous and safe operation of the gas turbine.