
Introduction
In order to reduce emissions of harmful nitrogen oxides (NOx), most modern industrial gas turbines use lean premixed, swirl stabilised combustion. This lowers the peak flame temperature, which prevents the formation of NOx. However, the presence of the swirler also produces large scale flow structures in the combustion chamber which provide a highly varying inflow condition to the nozzle guide vanes (NGV). The NGV faces the highest temperatures within the turbine, so a detailed knowledge of flow phenomena and heat transfer is required to optimise cooling design. This region has a complicated heat transfer profile with a large influence of secondary flows.
This paper presents the results of an investigation into these combustor-turbine interactions, using a swirler to model the aerodynamics of a combustor, though without hot streaks or reactive flow. After a literature review of flow within NGV and swirl stabilised combustion chambers, the experimental and computational methodology is presented. Steady state and time averaged experimental results are shown. LES and experimental results are then presented demonstrating the main unsteady phenomena which have been observed.
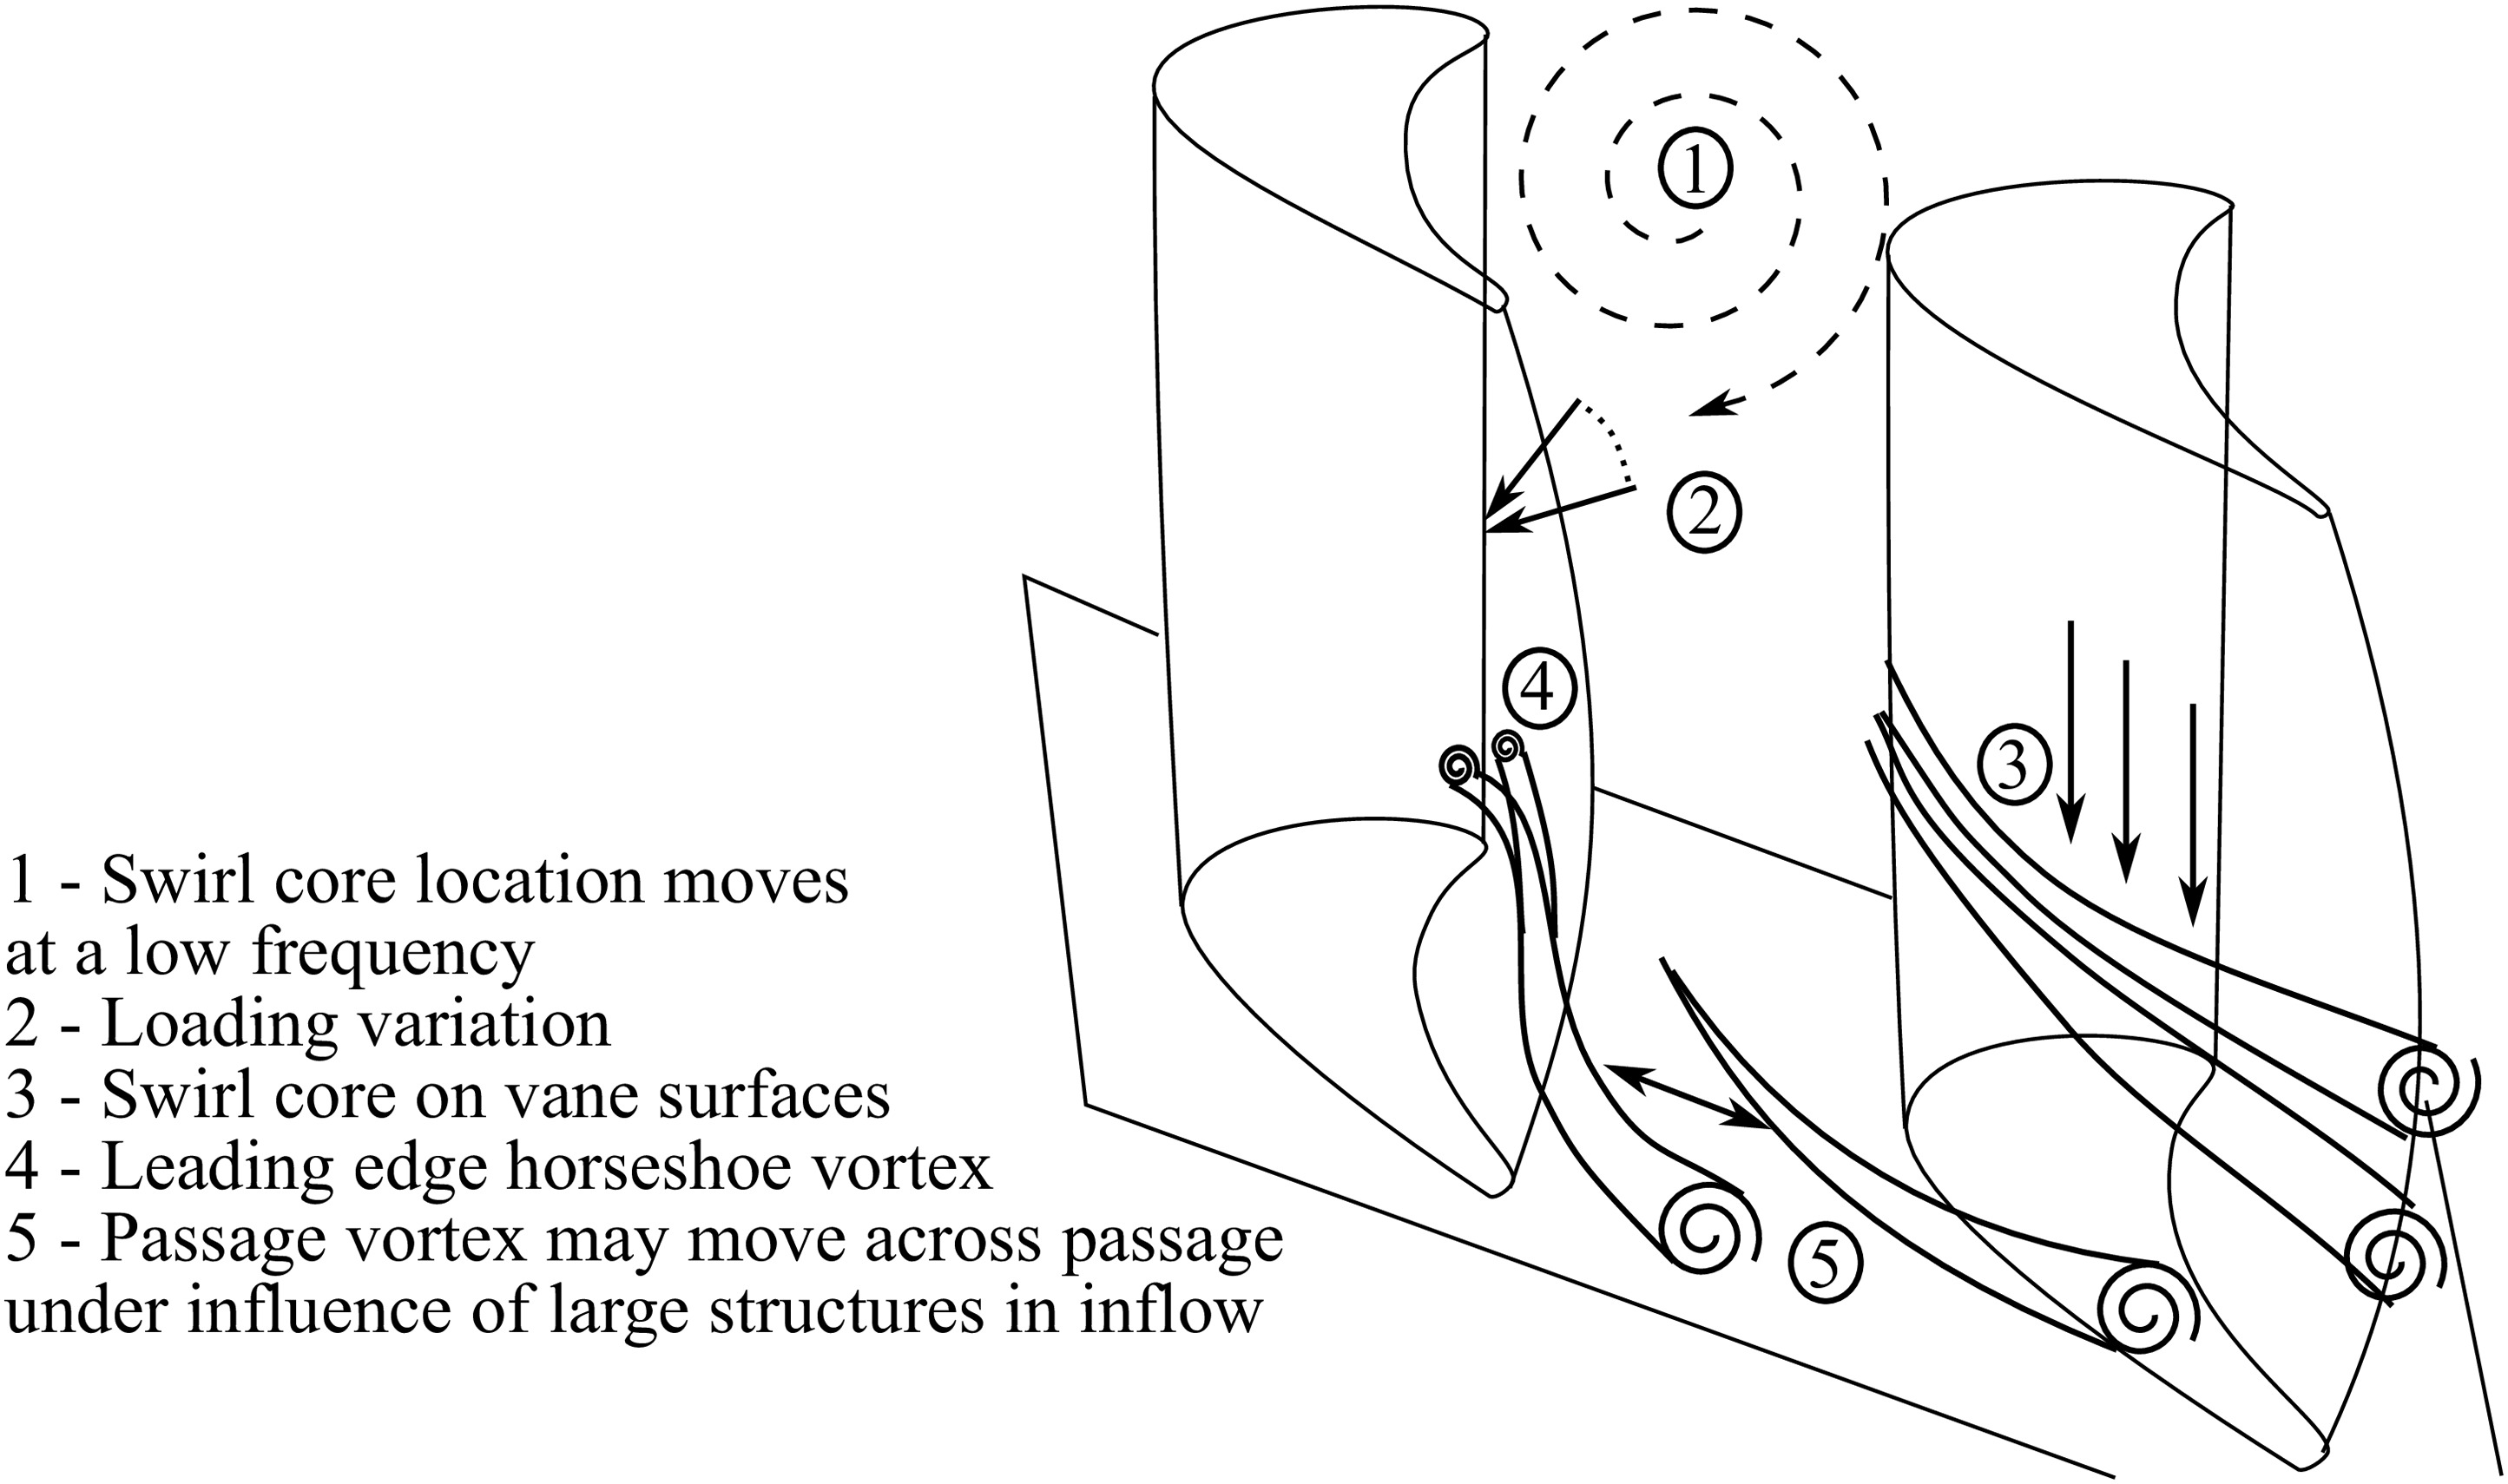
Figure 1 shows the various unsteady effects which are described in this paper. The swirl core generated in the combustion chamber moves at a low frequency. This results in a time-varying loading on the vanes. The footprint of the swirl core convecting through the passage is measurable by the effect on instantaneous heat transfer coefficient. On the endwall near to the leading edge, the horseshoe vortex shows oscillations induced by the unsteady inlet flow. The suction side leg of the horseshoe vortex climbs up the suction side of the vane, but appears to have little affect beyond the leading edge region. The pressure side leg of the horseshoe vortex may move across the passage towards the suction side, becoming merged with the passage vortex, but at other times remains attached to its own pressure side, in which case the endwall boundary layer may still separate and roll up into another passage vortex regardless.
Background
The flow field within the nozzle guide vanes in the absence of large inflow structures is well established, and given in standard texts, such as (Greitzer et al., 2007). Particularly important for heat transfer is the passage vortex and horseshoe vortex. A horseshoe vortex (HV) is formed just upstream of the leading edge of the vane, where flow is brought to stagnation by the vane pressure field. The adverse pressure gradient causes the boundary layer to separate upstream of the vane leading edge. The vorticity from the incoming boundary layer then causes the separated boundary layer to roll up forming the horseshoe vortex (Baker, 1979). From the leading edge, the two sides of the HV extend around the pressure and suction sides of the vane.
The horseshoe vortex may be unsteady (Thomas, 1987; Lin et al., 2002) The effect of an unsteady horseshoe vortex system on endwall heat transfer was measured in detail by Praisner and Smith (2006a,b), Bands of high heat transfer correspond to the attachment points of the horseshoe vortex. Zess and Thole (2002) suggested that the horseshoe vortex may be reduced in size or even eliminated by locally accelerating the flow before the vane-endwall junction.
From the leading edge, the pressure side leg of the horseshoe vortex extends through the passage, usually moving across the passage towards the suction side of the adjacent vane. The endwall boundary layer in the passage often separates at the lift-off line of the horseshoe vortex, so that the vorticity of the boundary layer is added to the vortex, forming a combined horseshoe vortex/passage vortex. The passage vortex is described in reviews by Sieverding (1985) and Langston (2001). Typically this passage vortex straddles the passage to the suction side of the adjacent vane.
Harrison (1989) suggests that behind the passage vortex near to the vane there is a new, laminar boundary layer formed. The passage vortex is often considered as a steady state phenomena, but some studies indicate that highly turbulent inflow conditions can result in a mobile, time varying passage vortex (Jacobi et al., 2017).
The aforementioned studies generally assume a homogeneous inlet condition. However in the real engine the flow entering the NGV from the combustion chamber has large scale structures created in the combustion chamber. A review by Huang and Yang (2009) describes many of the features of the flow field produced by swirl-stabilised combustion systems. A recirculation zone is created downstream of the swirler which results in a lower total pressure swirl core impinging onto the NGV vane. This central low pressure core is not simply the “wake” of the swirler centre body, but rather is created by so-called vortex breakdown of the swirl in the expanding combustion chamber and transition duct.
There have been some attempts to include realistic inflow conditions including combustion chamber generated flow structures. Turrell et al. (2004) simulated a lean burn combustor and NGV using URANS, observing a swirl core which convected through the NGV passage, agreeing with engine observations of high surface temperatures and reduced film coolant coverage.
Qureshi et al. (2013) undertook early measurements finding that endwall heat transfer is increased by high levels of inlet swirl.
Cha et al. (2012) suggested that with the extremely high turbulence levels the conventional passage vortex system breaks down, as there is more vorticity in the freestream turbulent eddies than in the boundary layers.
Schmid and Schiffer (2012) investigated numerically in a steady state simulation the effect of inlet swirl on the NGV. It was found that secondary flows are increased, and that endwall heat transfer distribution is modified. Giller and Schiffer (2012) in an experimental investigation found that inlet swirl massively changed secondary flow structures in the NGV, and significantly changed vane loading, both causing excess loss and causing film cooling (designed for axial inflow) to be less effective.
In recent years there has been a recognition of the importance of combustor outflows to the NGV. Schroll et al. (2017) developed techniques to measure accurately the velocity field exiting a combustor with reactive flow. The large scale turbine rig at the Technical University Darmstadt, described by Krichbaum et al. (2015), has been used for several detailed studies of combustor-turbine interactions effect on time-averaged quantities. Werchnik et al. (2017a,b,c) traced cooling flows and measured Nusselt number and cooling effectiveness with different amounts of film cooling with axial and swirling inflow.
Schneider et al. (2017) parameterised the time-mean inlet conditions from a swirling combustor, for use as CFD boundary conditions. Schneider et al. (2020) further developed a method for quantifying the propagation of uncertainties in the turbine inflow boundary condition to calculate uncertainties in turbine conditions.
Bacci et al. (2019a,b) used a test rig with cooled vanes and combustion chamber to investigate hot streaks and swirling inflow to the vanes. It was found that different aerofoils face significantly different temperature fields. Additionally, film cooling distribution is affected by inlet swirl, such that a design not accounting for this will use excessive cooling in some areas, and insufficient elsewhere.
Many studies consider only time-mean quantities, however Duchaine et al. (2017) showed by LES that using full time-resolved boundary conditions at the combustor-turbine interface is necessary for accurate predictions, compared with using a 2-D time-mean boundary condition.
Cubeda et al. (2018) compared different numerical methods to the experimental measurements of Bacci et al. (2019a,b), finding that neither RANS of combustion chamber and vanes, nor SAS of the combustion chamber used as a boundary condition to steady RANS gave satisfactory results. RANS simulation gave local adiabatic temperature errors exceeding 150 K. Scale-adaptive simulation (SAS) of the both combustion chamber and NGV together was necessary to give good agreement to experiments.
An LES study by Jacobi et al. (2017), found that when this flow impinges on the first nozzle guide vane (NGV) of the turbine, a secondary flow like midspan vortex pair is created on the leading edge of the NGV. The vortex extends over the pressure and suction sides of the vane. It was also found that the passage vortex may be unsteady when inflow is highly turbulent and swirling, and can sweep across the entire passage. It was speculated that this could lead to the periodic removal of film cooling. More detailed investigations were called for to gain a full understanding of the phenomena.
While there have been several studies which have used LES or SAS to include unsteady effects, it is hoped that this paper can also add some experimentally measured data to the unsteady literature. It still required a great computational expense to undertake LES of a combustor and vanes together, while the cost of swapping parts of experimental geometries has reduced greatly due to the proliferation of 3-D printing. It may thus be cheaper in some circumstances to compared changes to combustor geometry by experimental methods rather than by CFD.
Experimental and LES methodology
The experimental facility used is the Mitsubishi Heavy Industries High Speed Linear Cascade at Oxford, shown in Figure 2. Two can combustors and four nozzle guide vane passages are modelled in a linear cascade at realistic Mach number and Reynolds number. This is a cold rig, with inlet temperature of 310 K. Details of the facility are given by Luque et al. (2015) and Aslanidou and Rosic (2017). The vane geometry used for these experiments is based on a linearised version of an Mitsubishi Heavy Industries F-class NGV, reduced to 60% of actual size. The model for this study is a large industrial gas turbine, which uses can combustors in a ratio of two NGV per combustor can. The facility includes two cans with a separating wall so that interactions between the combustor wall and NGV can be studied, though this is beyond the scope of the present paper.
Figure 2.
Experimental facility. One passage endwall and one vane are instrumented with thin film heat flux gauges.

A detailed set of surface heat transfer data was acquired by instrumenting a NGV endwall with a set of 192 thin film heat flux gauges, and a NGV surface with another 192 gauges. Fundamental operating principles of thin film gauges are given by Epstein et al. (1986). Thin film gauges were manufactured with a technique similar to that of Collins et al. (2015). Data processing was performed to calculate heat transfer coefficients using the techniques of Oldfield (2008).
The Oldfield technique for calculating HTC uses a regression of temperature history against heat flux. The 95% confidence interval of the HTC regression was within
Data acquisition capabilities allowed a set of 96 gauges to have synchronised data acquired at a time. Four separate experimental runs were required to acquire the measurement data used. The operating point was fixed by using an upstream pressure regulator and orifice plate to fix mass flow. To verify repeatability of experimental data, each run was repeated. HTC varied between runs by less than

A swirl generator upstream of the vanes is used to simulate realistic combustor inflow conditions. The swirler was designed by Jacobi (2013), and provides a mean swirl angle of
An LES study was carried out in order to support the experimental campaign, and provide a full flowfield dataset which can be used to investigate the physical causes of the surface phenomena observed. The LES study was conducted using a mesh created by Jacobi et al. (2017) and Jacobi (2013). Full details of solution methods and validation are given by Jacobi et al. (2017). The inlet swirlers were modelled with a mesh resolution of 70 × 80 cells per swirler vane. The NGV passages consisted of 170 × 180 cells. Along with upstream and downstream blocks and the transition duct, there are a total of 120 M cells. The solver used was a modified version of the Tblock solver created by John Denton. The use of Tblock for LES is described by Klostermeier (2008). Wall functions were used to calculate shear stress and heat flux near the walls. The sub-grid scale model used was the wall adapting local eddy-viscosity (WALE) model.
The domain consists of a swirler, can combustion chamber and two nozzle guide vanes, matching experimental conditions. Data reduction techniques allowed all flow variables to be stored for three full flow-through times (or 30 flow through times through the vane passage), as only every fourth mesh point in each direction (
By using numerical and experimental methods together, the benefits of both techniques can be combined. Experimental measurements have been acquired with sufficient resolution in both space and time to directly visualise the effect of large scale flow structures on the instrumented surfaces. The addition of a time-resolved LES dataset then reveals the causes of these interactions in terms of the 3-D flowfield.
Results
Unsteady flowfield from swirler and in transition section
Swirling inflow creates a recirculation zone which causes a low total pressure swirl core which interacts with the NGV. This low pressure core is not always exactly central, but precesses with a low frequency. The movement of the swirl core is an extremely low frequency phenomena. In the time that the LES was fully recorded for, 30 ms, only 1.5 full cycles occurred, giving a frequency of 50 Hz.
The variation of the position of the central pressure loss core is shown in Figure 4. A snapshot of inlet total pressure is shown, as well as the time-averaged inlet total pressure. At each timestep of LES, the position of the minimum pressure has been plotted, showing how the swirl core moves about in time. The swirl core has been tracked using the criterion of the point of minimum total pressure, since this gave a clear and consistent identification, whereas other vortex identification criterion such as the Q-criterion or Lambda 2 criterion gave many false positives due to the very high number of turbulent eddies. The movement of the swirl core appears quasi-random, with no clear discernible pattern to its movement. It is likely that a greater number of recorded LES timesteps are necessary to reliably calculate a probability density function for the position of the swirl core. Also shown is the variation in total pressure at the centre point of the inlet. This can be seen to vary with a low frequency, there is an approximately 330 Hz fluctuation, as well as lower frequencies, such as the 50 Hz noted previously. There even appears to be variation on the order of the full length of recorded time at this location, meaning <33 Hz fluctuation.
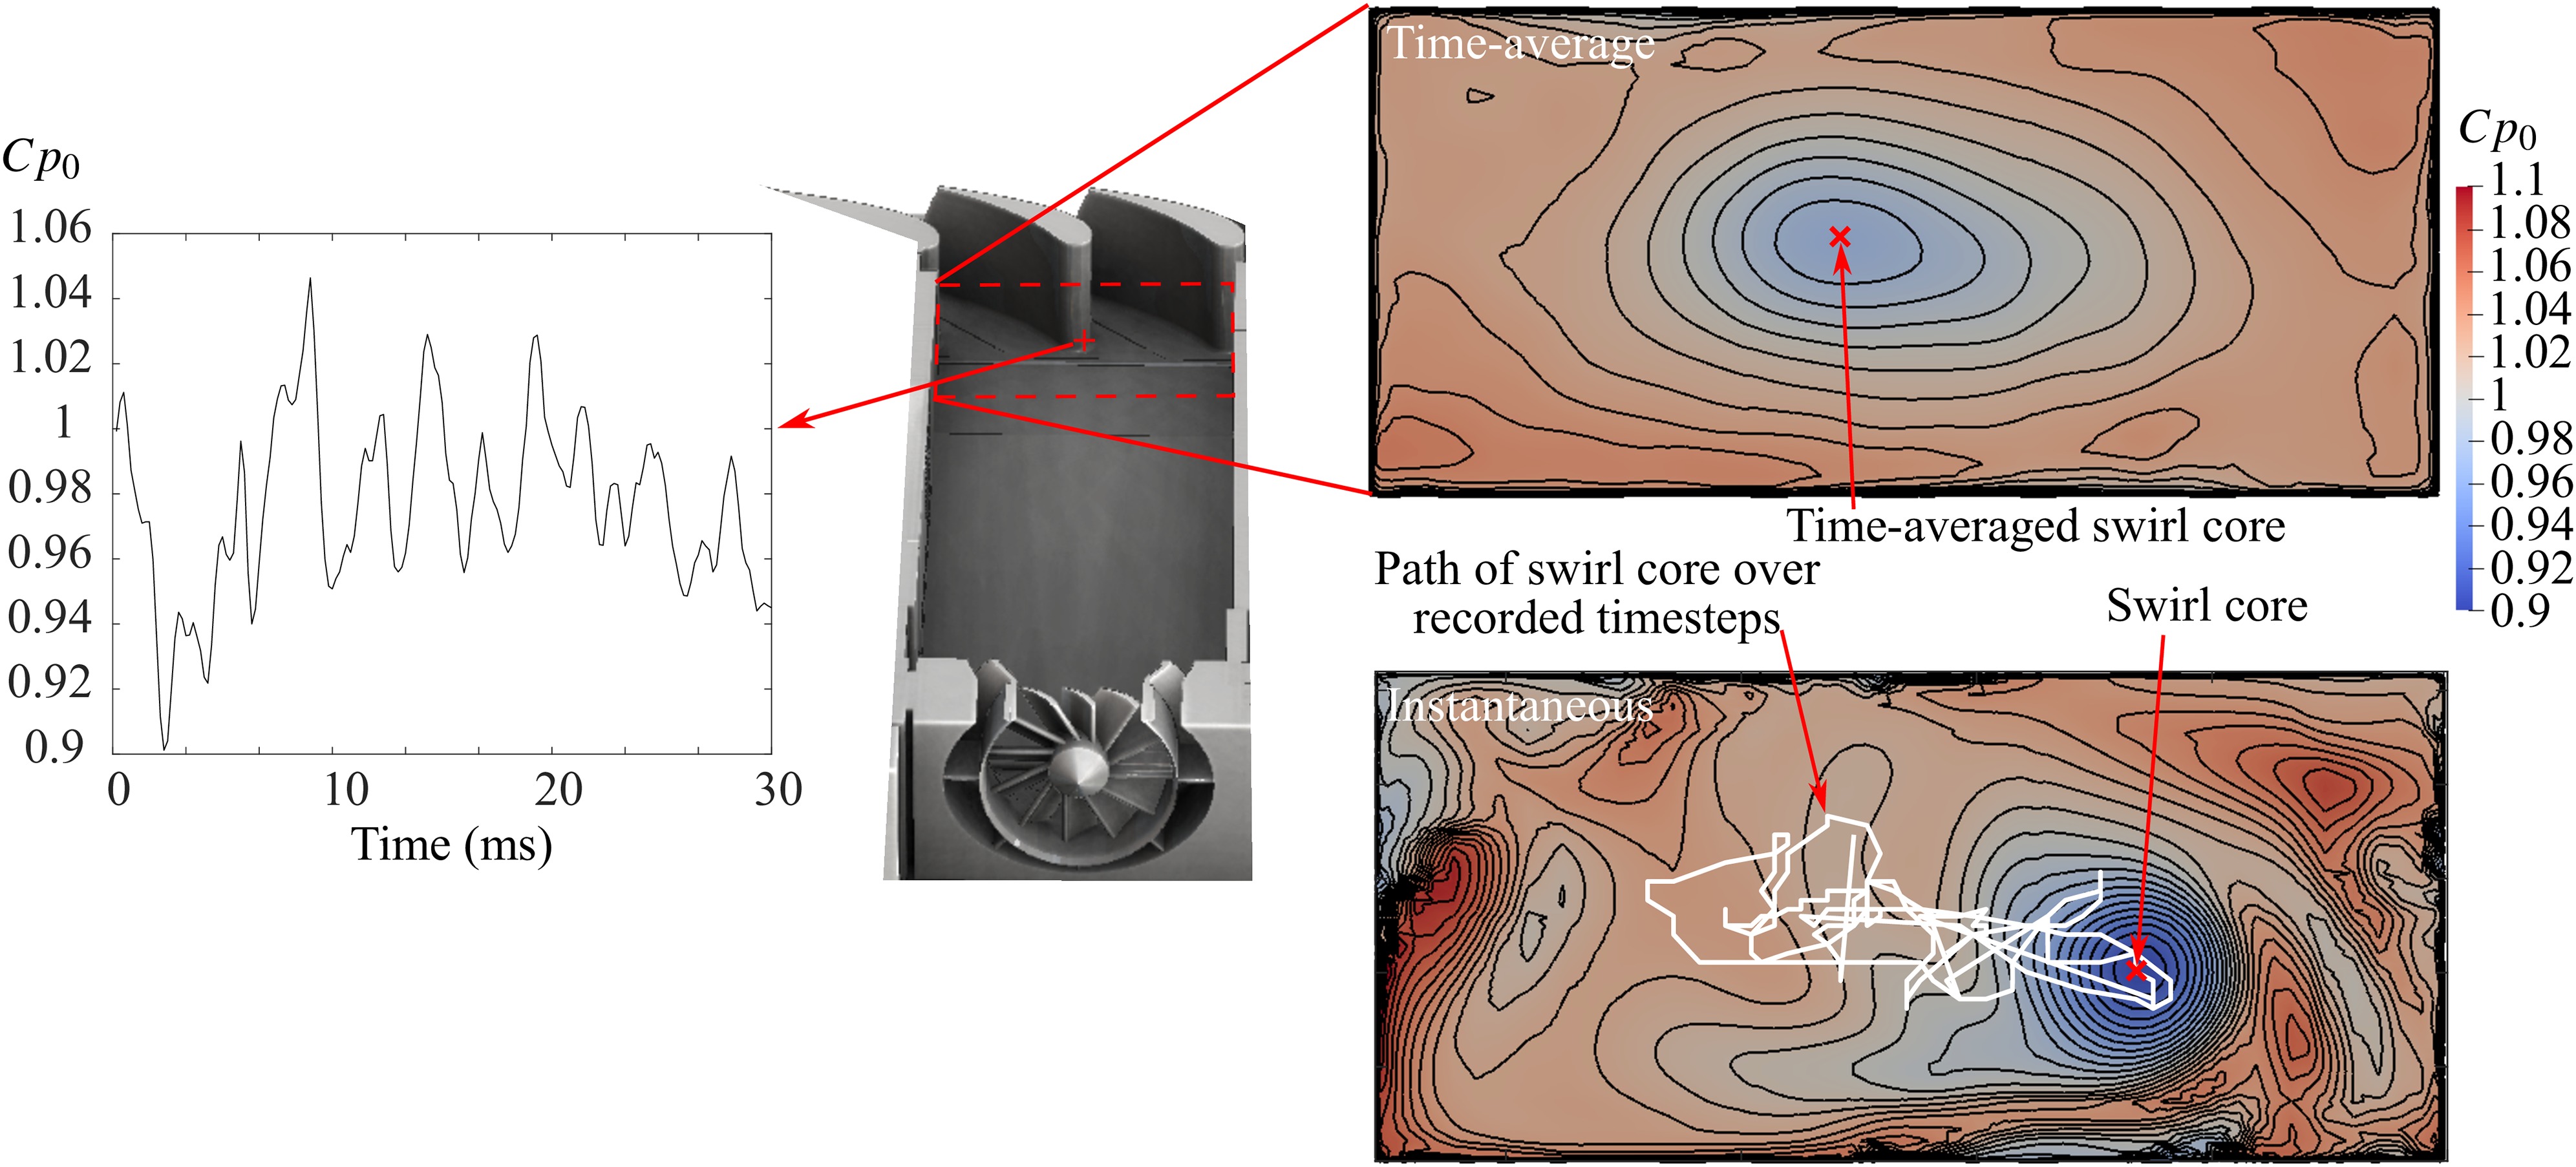
The magnitude and position of the total pressure loss core varies considerably in time. This can change the angle of incidence onto the vanes, and has an effect on both vane loading, and the formation of secondary flows. The position of the residual swirl core is highly variable, being from time to time near the endwall by the PS, by the SS or in the centre of the passage.
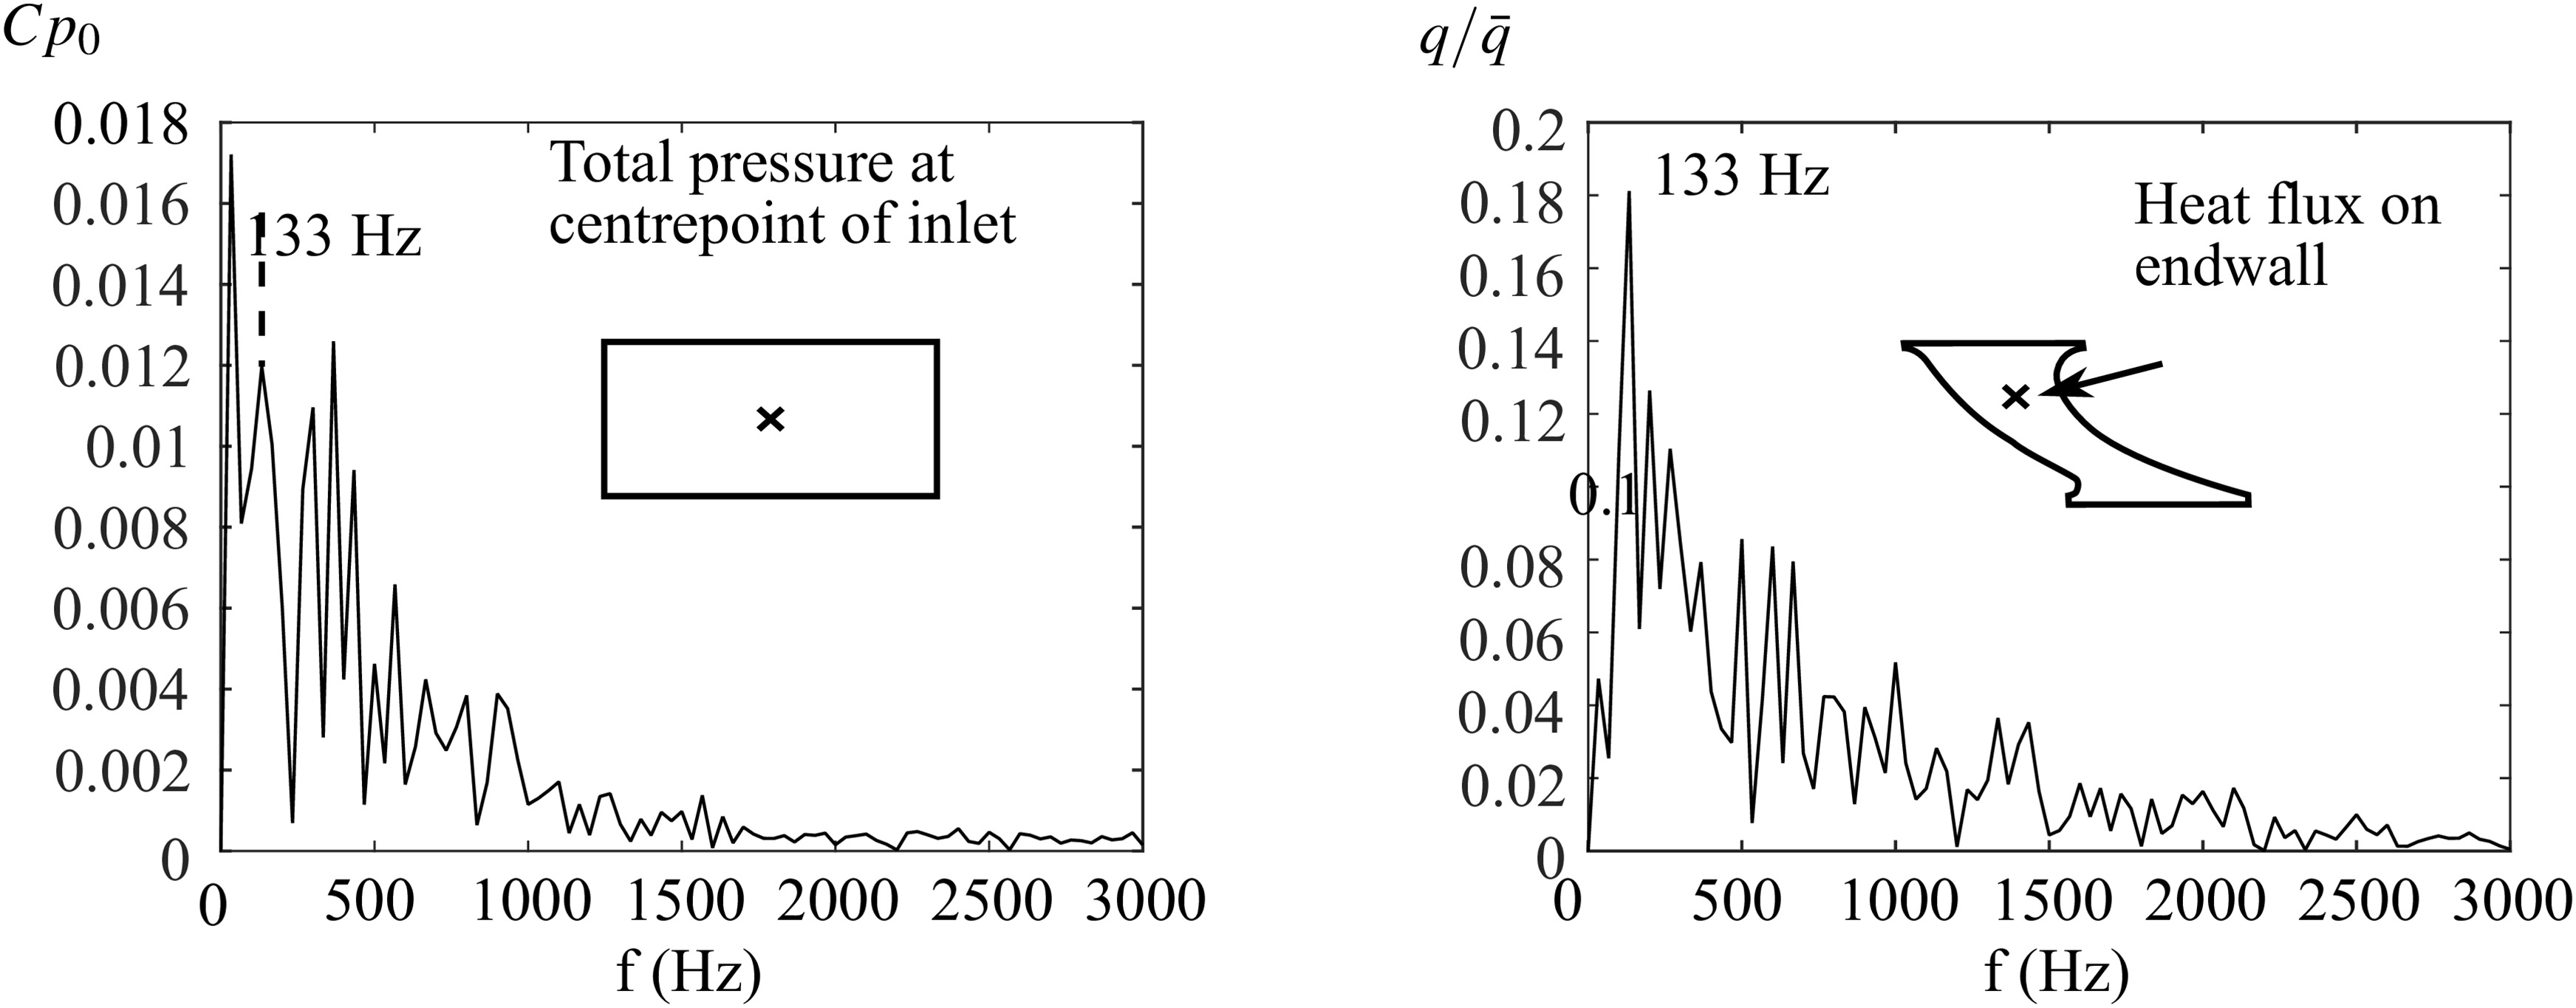
This low frequency unsteadiness of the swirl core is the root cause of the other unsteady phenomena which are described below. This is shown by a frequency analysis of the swirl core, and of a point on the endwall, shown in Figure 5. The discreet Fourier transforms (as calculated by Matlab’s built in FFT function) of the inlet stagnation pressure coefficient at the centre point, and the normalised heat flux on the endwall are shown. The frequency spectra of inlet total pressure and heat flux on the endwall are similar, and have a similar peak at 133 Hz.
Vane loading
Since a linearised vane geometry was used, with axial inflow loading would be nearly radially uniform. However, swirling inflow results in different angles of incidence and therefore different loading depending on span height. Figure 6 shows the loading at 25% and 75% span, compared to the loading at midspan. While the midspan of the vane has a loading curve with adverse pressure gradients only on the second half of the suction side, at 25% and 75% span there are adverse pressure gradients over areas near the leading edge on both suction and pressure side.
Figure 6.
LES: Mean and range of static pressures at 25% and 75% span, compared to the loading at midspan.
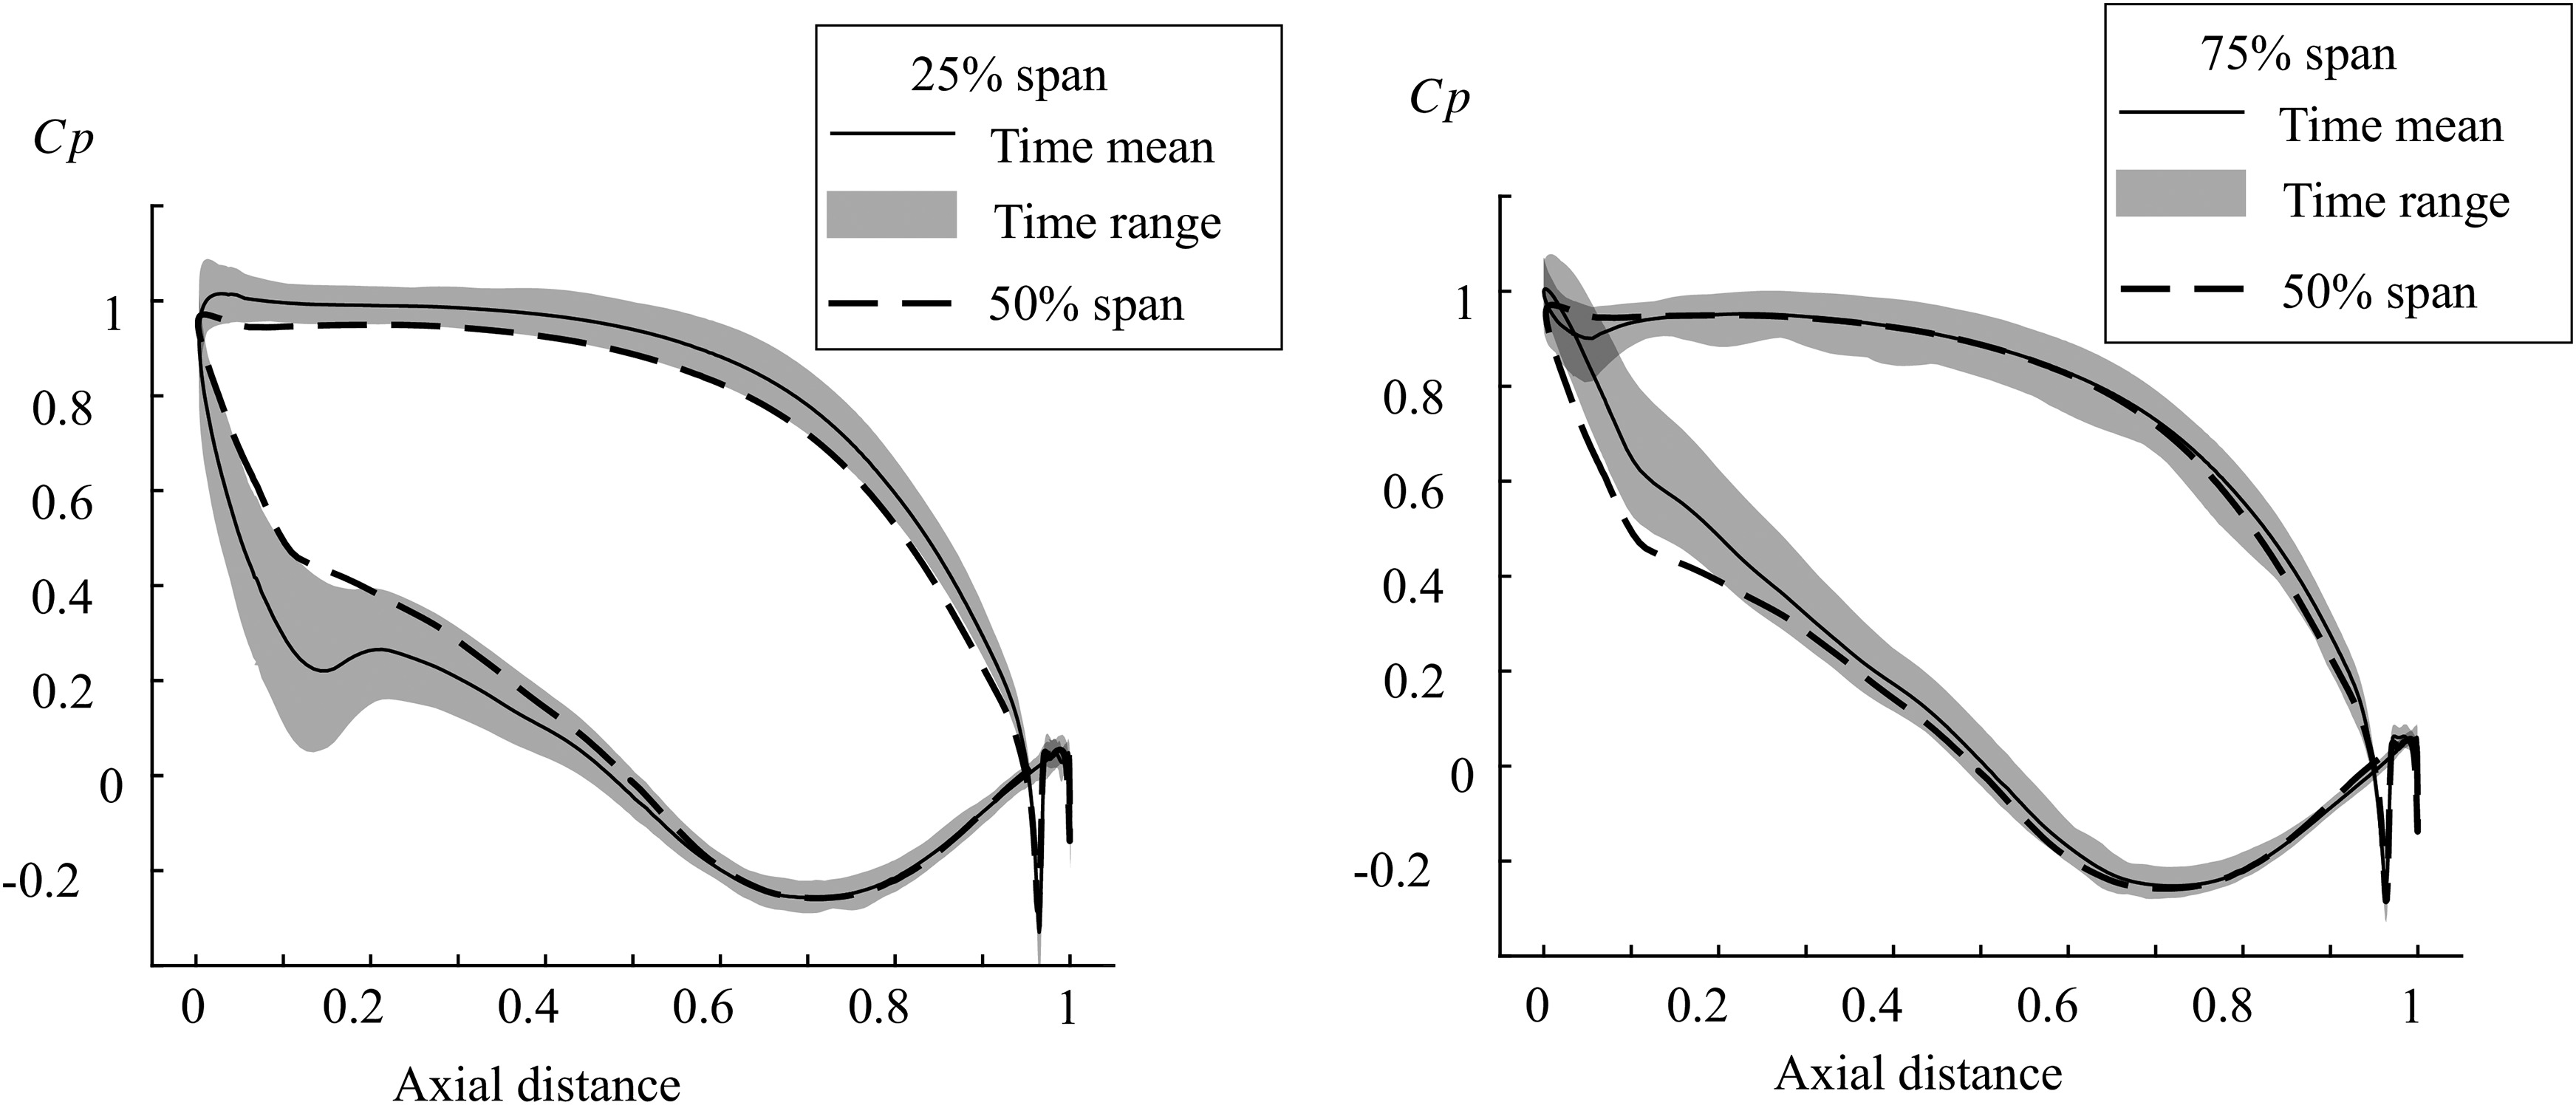
Moreover, the vane loading is highly unsteady, as shown by the range of static pressure coefficient through time. Significant adverse pressure gradients can occur transiently on the vane, which may have a detrimental effect on efficiency if it leads to boundary layer separation. The suction side from leading edge to 30% chord shows the greatest variation in loading. It is believed that the unsteadiness in loading is mainly due to incidence variation, as was found by Jacobi et al. (2017), but blockage due to the swirl core moving between passages may also be a contributing factor. This could be problematic for design, as compensating for the swirl at the time averaged position would still leave the vane geometry sub-optimal at other instances in time.
Vane surface unsteady HTC
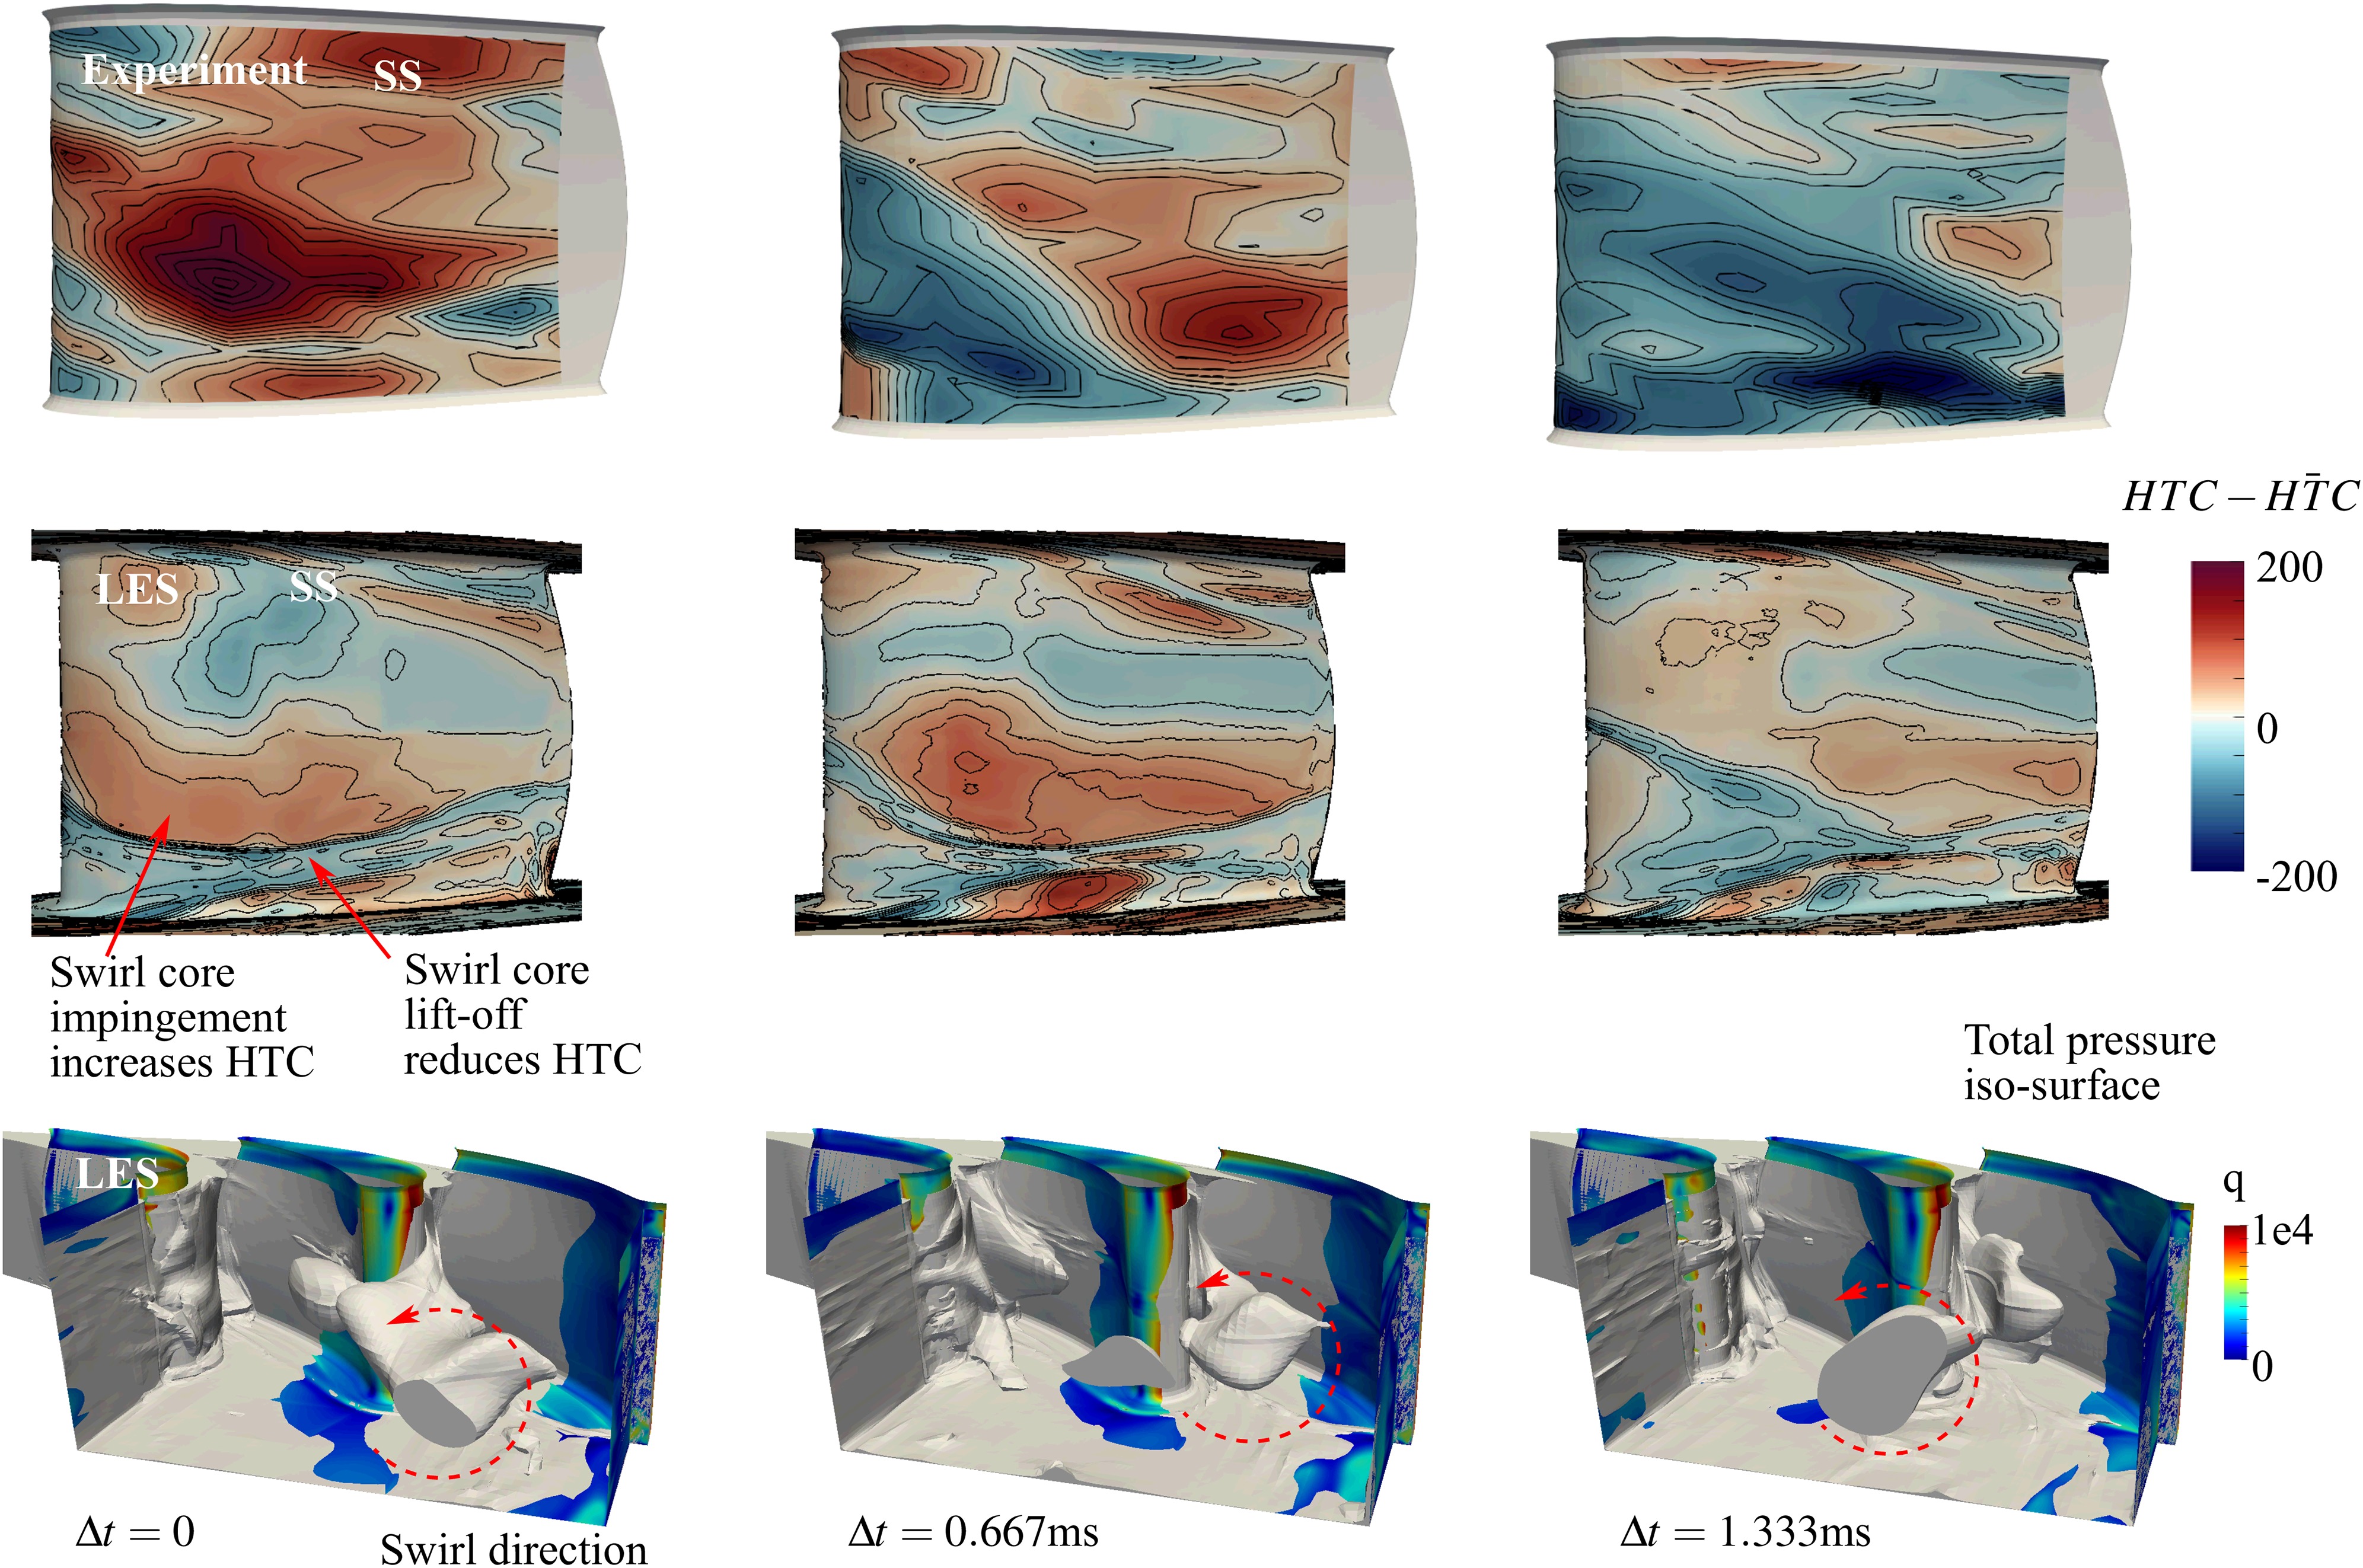
As well as affecting loading, the swirl core persists through the vane passages. In the vane geometry studies here, with two NGV per combustion chamber, the swirl core can move from one passage to another. As the swirl core moves through the passages, it influences the local HTC of the vane surfaces. The high resolution of the experimental data set, with synchronised data acquisition of one side of the vane at a time, allows direct visualisation of this effect. The effect of this unsteady variation in HTC is plotted over the vane area in Figure 7 for a series of timesteps for both LES and experiment. Individual timesteps cannot be matched between LES and experiments, but the time increments are matched between experimental results and LES shown, starting from the point at which the same phenomena occurs in both cases. The movement of the swirl core is visible as the very large structure moving over the vane surfaces, modifying HTC. It is confirmed by examination of LES that this is caused by the movement of the swirl core from the combustion chamber.
Horseshoe vortex near vane leading edge
The locally highest area of HTC, after the wake, is located on the endwall near to the leading edge of the vane, and is caused by the horseshoe vortex. The HV is also highly unsteady, with large fluctuations in instantaneous heat transfer of up to 100% above the time-mean.
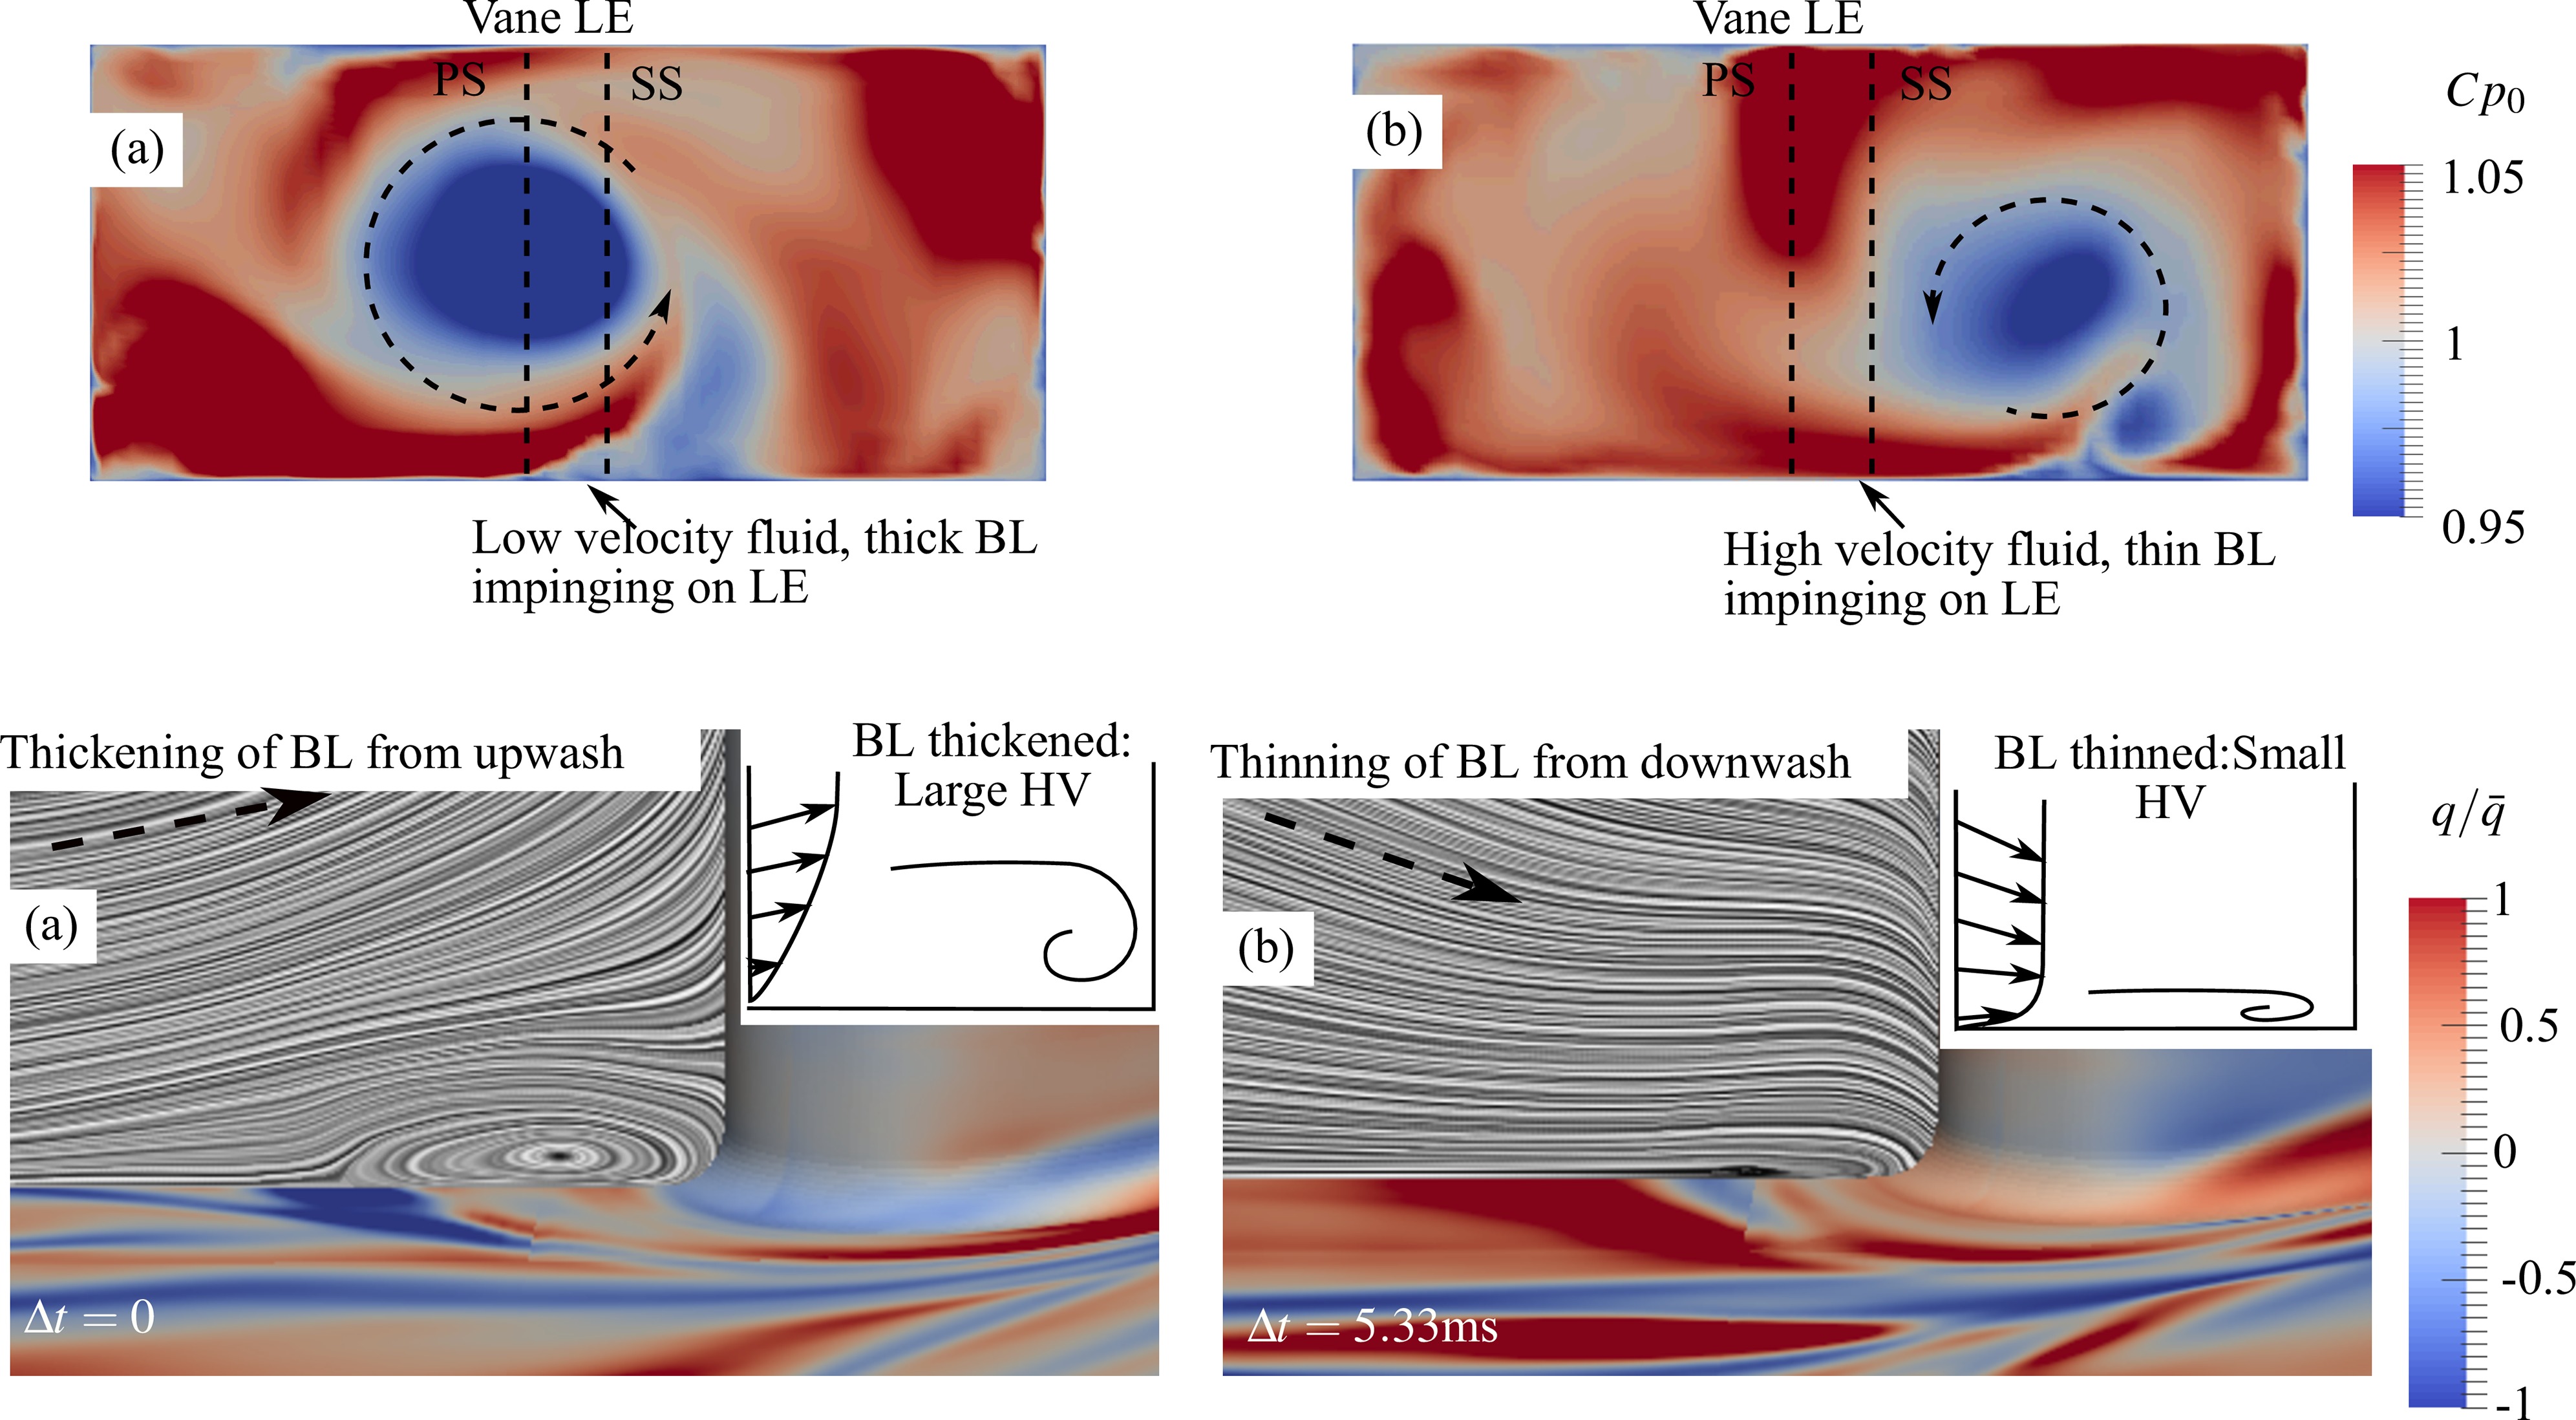
The horseshoe vortex is influenced by the boundary layer thickness and the flow velocity (Baker, 1979). In this flow however, these two properties both vary greatly with time, in the vicinity of the vane-endwall junction, due to the time-varying position of the swirl core. As the swirl core moves from one side of the passage to the other, the boundary layer thickness of the flow impinging onto the central vane changes, and so effects the formation of the horseshoe vortex. Similarly, the axial velocity in the vicinity of the vane endwall junction also varies greatly, leading to changes in the strength of the HV.
This is illustrated in Figure 8 for two LES timesteps, showing both instantaneous inlet conditions and the endwall junction flow which results. In timestep (a), the swirl core is slightly off centre towards the pressure side of the central vane, and there is a radial velocity component lifting-off away from the endwall. This results in a thick boundary layer, which separates and rolls up into a large HV. In timestep (b), the swirl core is to the suction side of the central vane, and the endwall boundary layer is thinned by the impinging velocity component. This accelerates the flow near to the wall, and so there is only a very thin boundary layer to form the horseshoe vortex, resulting in an extremely small vortex. This is similar to the suggestion of Zess and Thole (2002), to reduce the horseshoe vortex by locally accelerating the flow before the vane-endwall junction.
Passage vortex
Usually the passage vortex is a steady phenomenon, but the low frequency fluctuations of the swirl core causes a corresponding unsteady behaviour of the passage vortex. The high density of gauges installed on the test vanes allowed the time varying position of the passage vortex to be found experimentally. This is shown for a sequence of measurement timesteps in Figure 9. The rotation of the passage vortex is such to create a line of lowered HTC towards the suction side, with higher HTC towards the pressure side, due to the impingement and lift-off on each side of the vortex. Therefore, by examination of the instantaneous heat flux contours, the likely position of the passage vortex can be found. The unsteady passage vortex at various times appears to traverse nearly the entirety of the passage, from its own pressure side to the suction side of the adjacent vane. The time taken to move from one side of the passage to another is around 3–3.6 ms, giving a characteristic frequency of a full cycle of around 150 Hz. LES confirms this interpretation of the experimental results, showing that the PV often migrates across the passage, detailed in Figures 10 and 11 below.
Figure 9.
Experiment: unsteady heat flux on endwalls, showing instantaneous footprints of passage vortex.
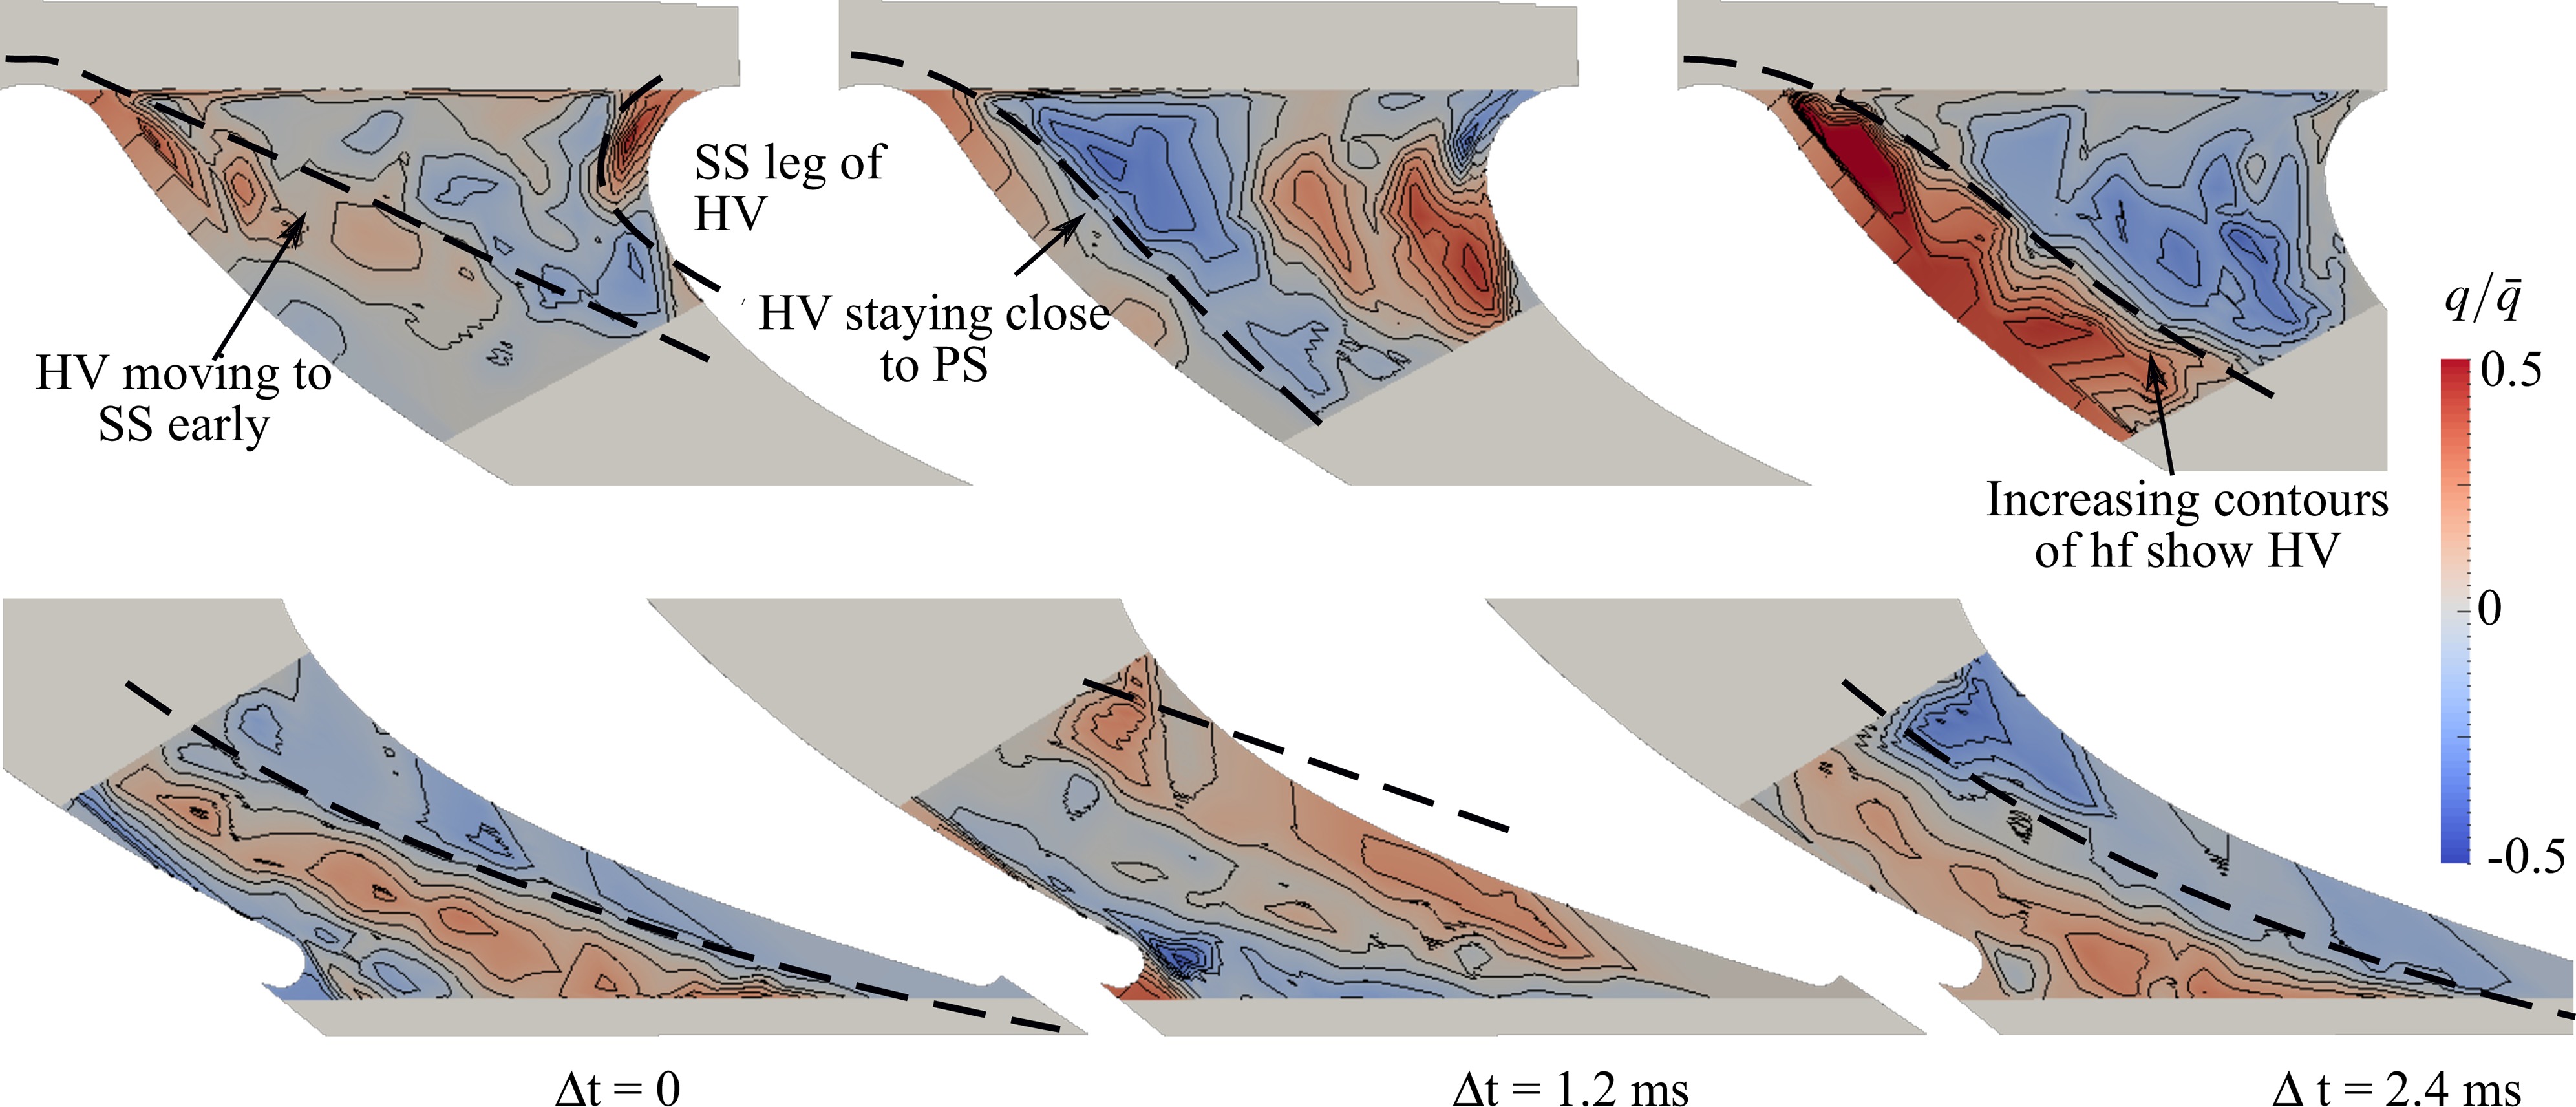
Figure 10.
Detailed snapshot of LES. Pressure side leg of horseshoe vortex can remain attached to pressure side, and secondary HV forms.
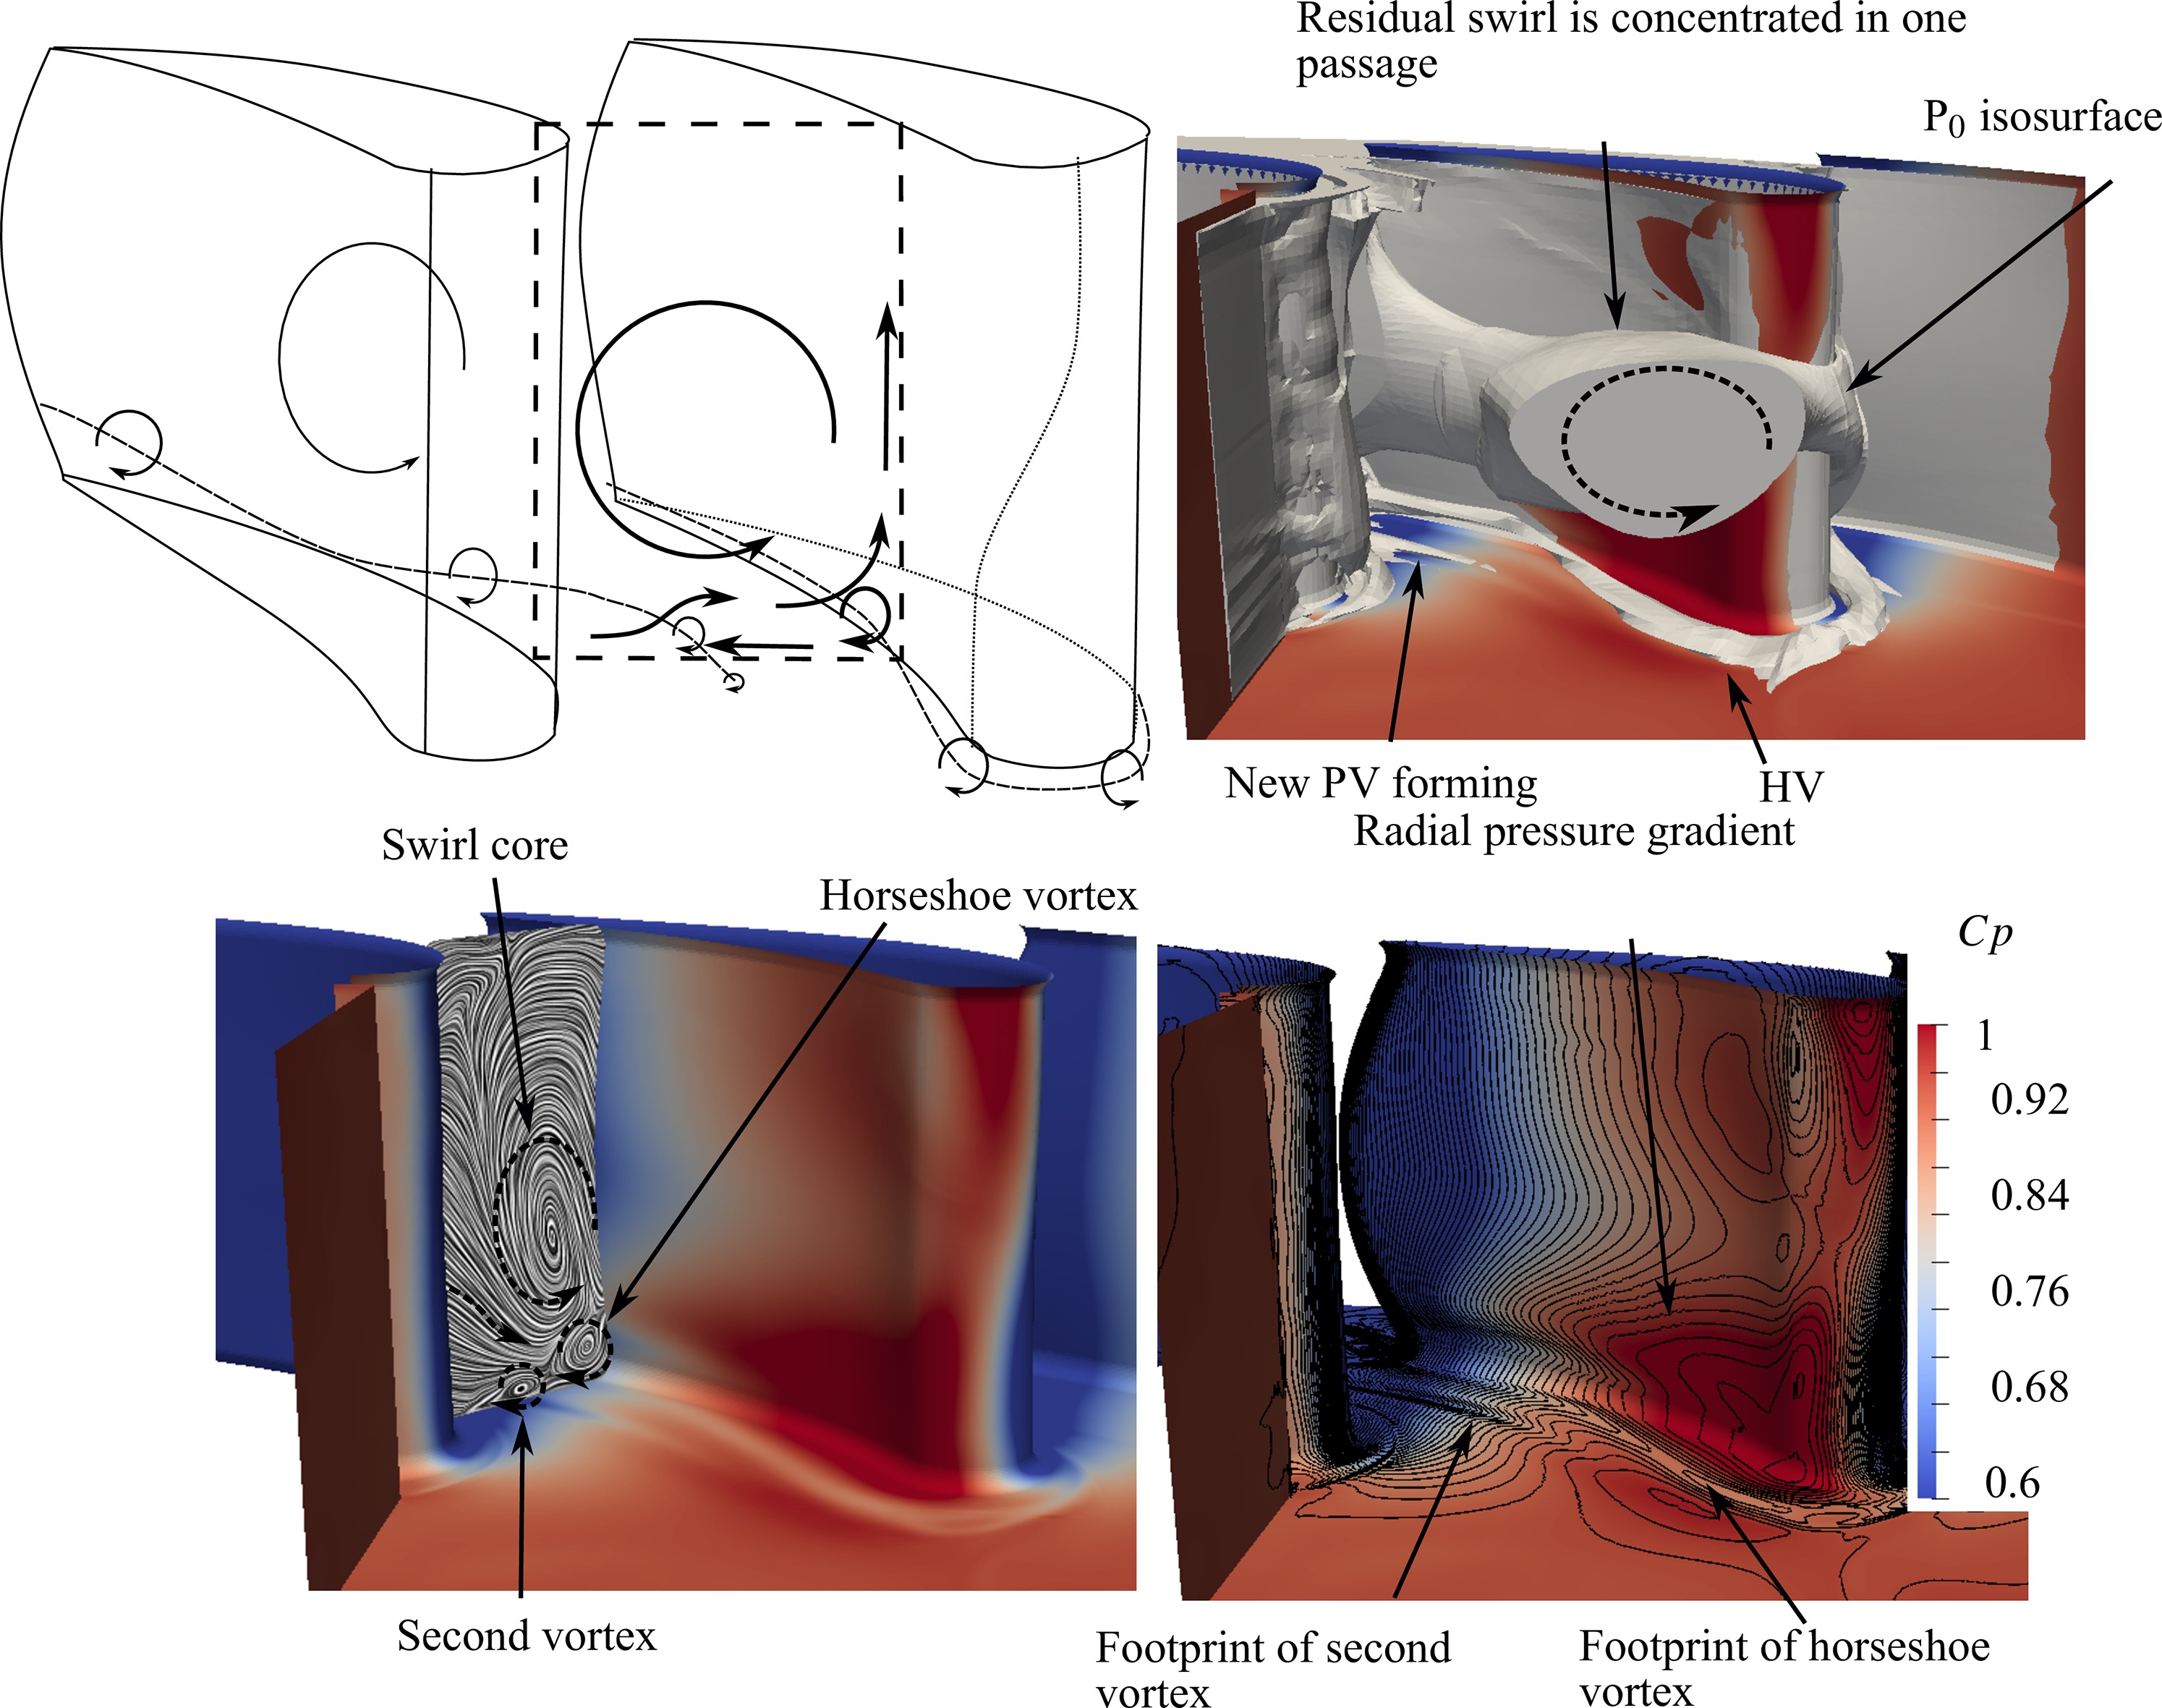
Figure 11.
Four snapshots of LES showing positions of passage vortex and swirl core which transiently occur.
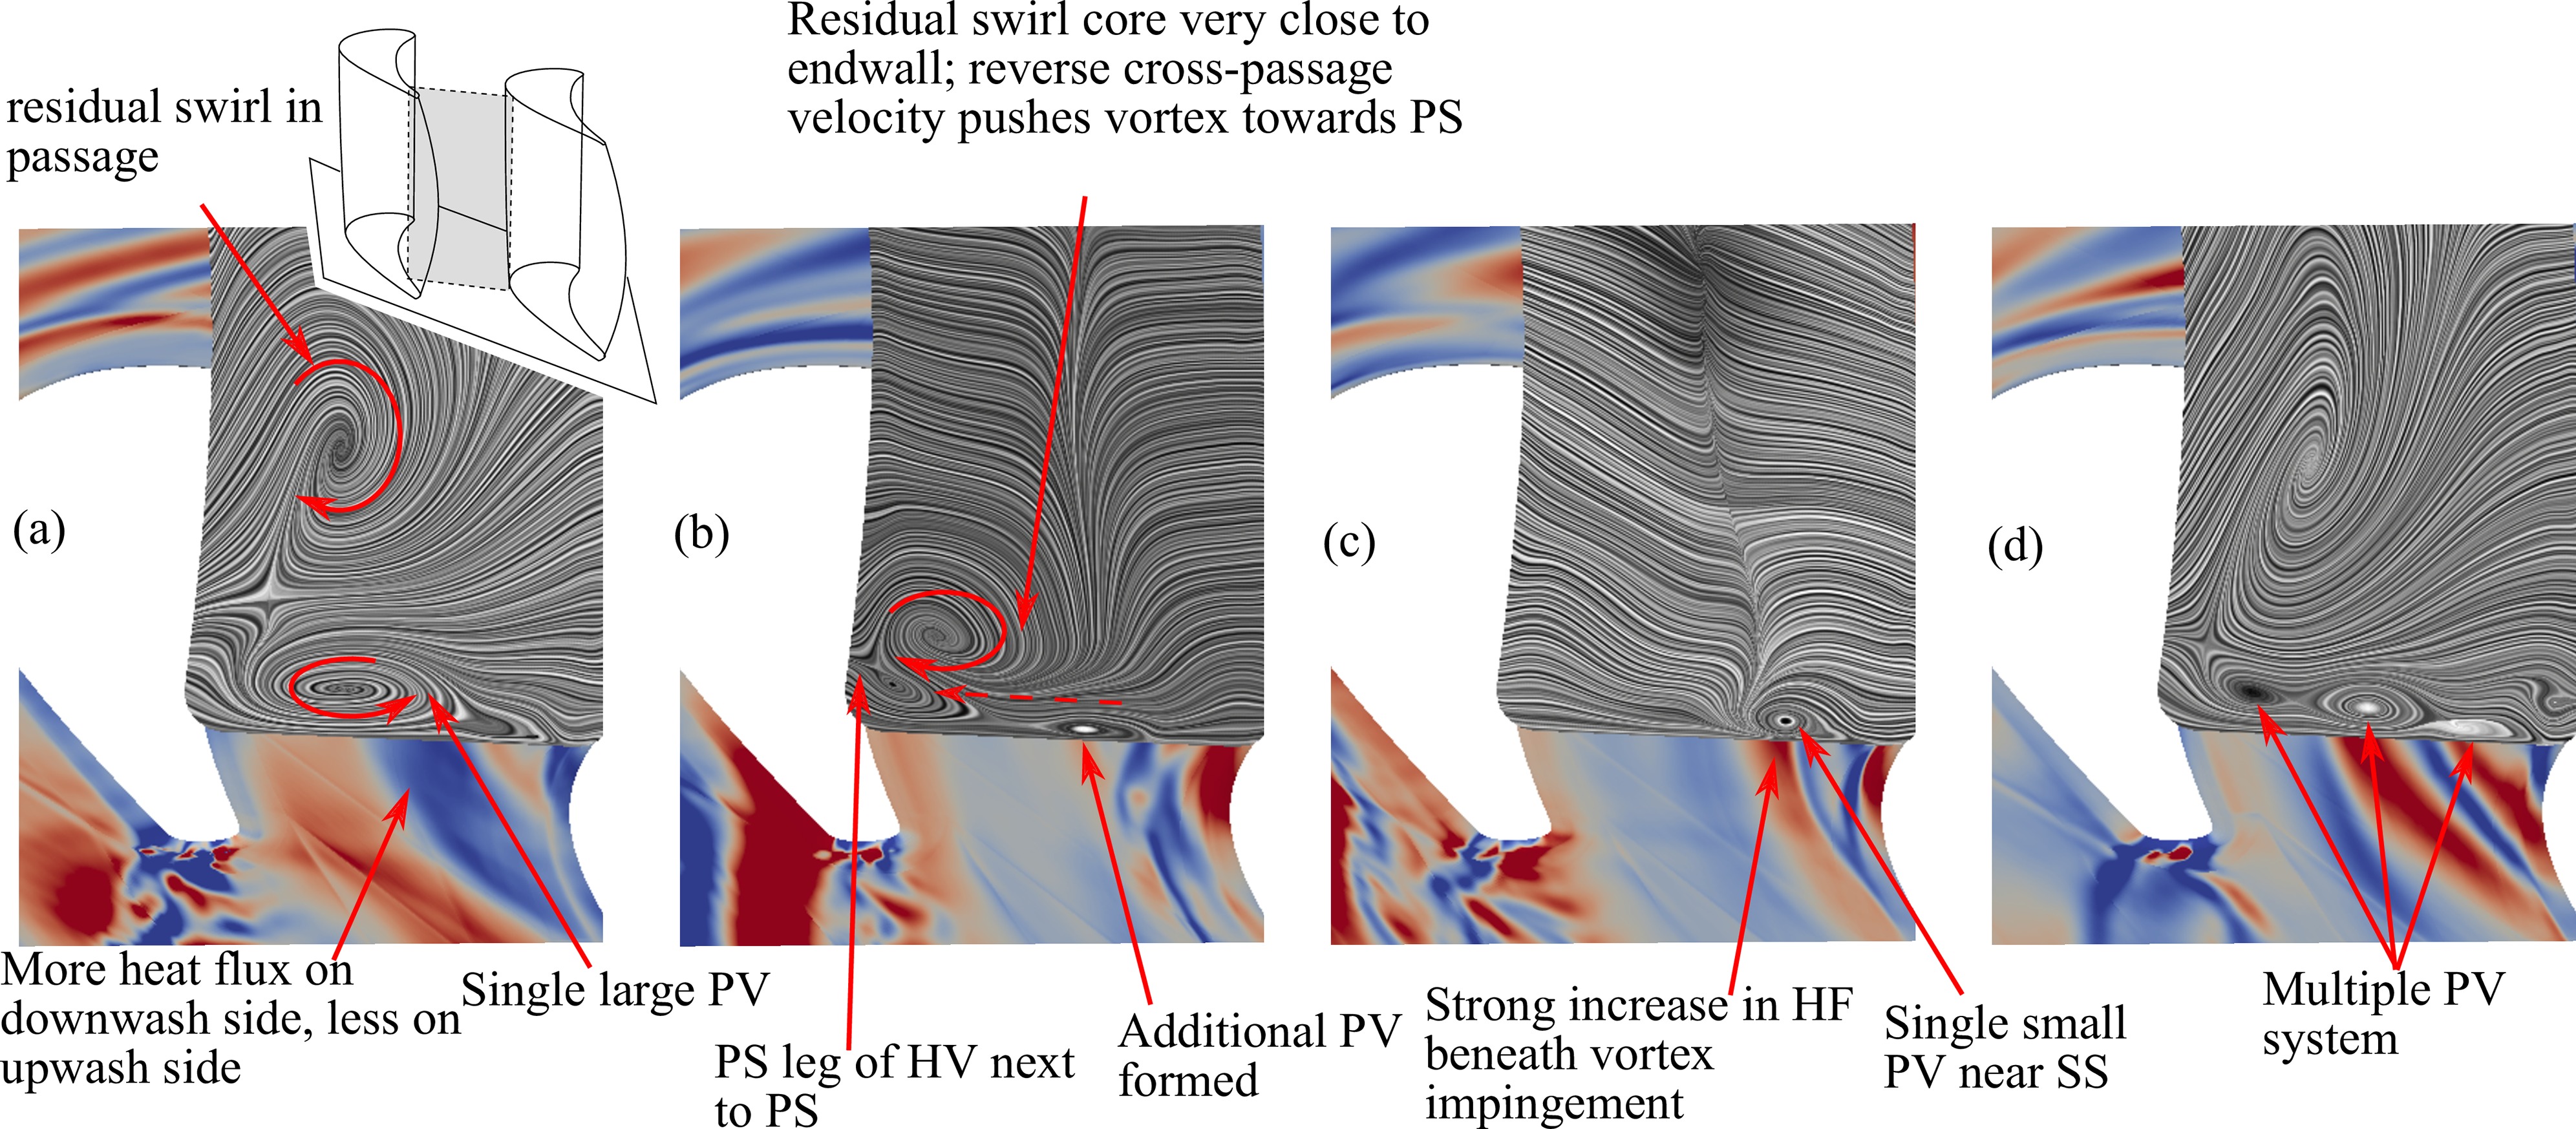
Figure 10 shows a single LES timestep in which the horseshoe vortex remains near to the pressure side instead of straddling the passage towards the adjacent vane suction side. In this timestep the residual swirl core in the passage is causing additional cross passage velocity and a radial pressure gradient. This causes the pressure side horseshoe vortex to remain attached to the pressure side, instead of migrating across towards the suction side. Angular momentum of the residual swirl causes a near endwall flow from suction side towards pressure side. This is against the pressure gradient so the boundary layer separates and rolls up into a second vortex.
Examination of LES dataset over time showed four distinct positions of the passage vortex which occurred at various times. Four snapshots shown in Figure 11 illustrate the variety of positions which were observed. Figure 11a shows a large passage vortex in the middle of the passage; there is enhanced heat transfer on the down-wash side and reduced heat transfer on the up-wash, as expected. The large size of this passage vortex corresponds to the extremely large HV which is generated at the LE at this time (see Figure 8).
In Figure 11b the swirl core has moved very close to the endwall and pressure side of this passage. There is an ordinary passage vortex nearer to the suction side; very close to the pressure side an additional vortex has formed, counter-rotating with the swirl core.
In Figure 11c there is a small and localised passage vortex, nearby to the suction surface, as is expected in the ordinary model.
Finally Figure 11d shows a multiple vortex system. The residual swirl in the passage is tending to create a cross passage velocity towards the pressure side, while secondary flows are in the opposite direction. This has led to the formation of multiple vortices instead of a single passage vortex.
Time-averaged measurements
The overall, time average heat transfer measurements, and overall levels of unsteadiness on the surface, are shown in Figure 12 over the vane surfaces and endwalls for both experimental measurements and LES. LES and experiment generally agree well, except for some discrepancies which are thought to be due to the use of a wall function near-wall treatment, rather than having LES fully resolved to the wall. The use a wall function is imposing the assumption of a turbulent boundary layer; this leads to an over-prediction of HTC where the boundary layer is in reality laminar, particularly the leading edge and on the endwall near to the pressure side behind the horseshoe vortex.
Figure 12.
Experiment: Time average HTC measured using thin film gauges over vane surfaces and endwalls.

There is a large low heat transfer triangle covering most of the upstream part of the endwall. This is a result of both comparatively low flow velocities combined with an intact boundary layer transferring from the transition duct.
On the endwall close by to the stagnation point of the vane and around the first part of the suction side surface, there is a much higher HTC. This is due to the horseshoe vortex at the leading edge causing flow to directly impinge on the endwall surface, resulting in extremely high heat transfer (Praisner and Smith, 2006a,b).
Further down the passage towards the throat, flow is accelerated. The increase in velocity results in a consequent increase in endwall HTC. Heat transfer is greatest towards the suction side of the endwall, and lower towards the pressure side, caused by secondary flows increasing boundary layer thickness near the suction side, and reducing it near the pressure side, as well as passage vortex impingement increasing HTC towards the pressure side, and lift-off reducing HTC near the suction side. The highest HTC occurs in the wake behind the trailing edge of the vane. This local HTC at this point is double the HTC at the midpoint of the throat.
As for the vane surfaces, the suction surface has the greatest HTC. The pressure surface has a lower HTC in the upstream part of the vane, which then increases towards the throat, as on the endwall.
Overall unsteadiness, caused by the phenomena discussed previously, is quantified as the root-mean-square (RMS) amplitude of the fluctuations in HTC. This is plotted in Figure 13, for both vane surfaces and endwall. The highest levels of fluctuation are on the endwall.
Figure 13.
Experiment: Unsteady fluctuation in heat transfer on vane surfaces and endwalls. Note different scale for endwalls and vane surfaces.

There is a high amplitude of unsteady HTC on the endwall near the leading edge of the vane on the right hand side of the endwall plot. This is caused by the HV intermittently causing flow impingement onto the endwall.
Moving across the passage towards the pressure side, there is a significant level of fluctuation within the low HTC triangle upstream. However, close to the pressure side there is a quiescent region with almost no fluctuation in HTC. It has been suggested (Harrison, 1989) that this indicates a fresh, laminar boundary layer being generated behind the horseshoe vortex. The thin, laminar boundary layer transitioning to turbulence may partly explain the high HTC levels observed near to the pressure side.
Progressing along the pressure side downstream, fluctuations steadily increase. This mirrors the increase in HTC in this region. Towards the suction side of the vane there is less fluctuation.
Past the end of the vane in the wake there is an extremely high amplitude of HTC fluctuations, as well as an extremely high time averaged HTC. This is due to the turbulent boundary layer from the vane surfaces being shed.
On the vane surfaces fluctuation levels are less than on the endwall. The greatest fluctuations occur in a band around the midspan of the vane. This is caused by fluctuation of the swirl core in the inflow.
Summary and conclusion
This combined experimental and computational study shows some of the many complex flow interactions which are often overlooked in simplified studies.
While the NGV are often thought of as a steady flow area, in fact there is a great deal of unsteadiness resulting from the time-varying combustor outflow. This is not simply high turbulence, but coherent structures such as the swirl core, which persist over time, but vary in position. Many of these flow interactions are highly unsteady in nature, and are not picked up by steady state CFD, or even unsteady CFD if it does not have the correct time-varying inlet conditions (Cubeda et al., 2018). The ordinary view of secondary flows in the NGV as being essentially steady structures is shown to be oversimplified. These unsteady interactions create a great difference in the flow field, and may affect losses and heat transfer. Vane loading is also highly variable in time, which may have effects on aerodynamics.
The unsteady effects on heat transfer occur at a low enough frequency that they could have a significant effect on component surface temperature. It is thought that the relatively low frequency phenomena discussed in this paper may have a detrimental effect on film cooling flows, though this will require further investigation.
The high resolution, simultaneously in time and space, of the heat flux measurements allows for direct visualisation and study of the movement of heat transfer modifying structures over the endwall and vane surfaces. The combination of using experimental and computational techniques together has proves extremely valuable, as the advantages of both can be combined to give meaningful and accurate results.
Large-scale unsteady structures from the combustion chamber can modify the passage vortex in nozzle guide vanes from a steady state phenomena to being highly unsteady. The passage vortex appears to remain as a distinct structure, but one which is unsteady in its position. This can be caused by the fluctuating swirl core position and residual swirl in the passage.
The horseshoe vortex near the leading edge was also found to be highly unsteady. A quiescent region behind the horseshoe vortex indicates the creation of a thin laminar boundary layer, which then results in an increased HTC downstream as it transitions to turbulence.
The fact that such large effects occur in the first vane shows the importance of designing combustors and first vanes in an integrated manner, as there can be great benefits to the first vane flow field resulting from changes to the combustor. At the least, first vane design should be in light of the steady-state swirl angles and the consequent effect on loading. Unsteady effects are more difficult to design against, but knowing that they exist may still help to inform design. For example, suggestions to manipulate secondary flows based on the exact position of the passage vortex may be more difficult if the passage vortex is in fact sweeping the entire passage.
It would be difficult to design NGV always using unsteady simulation, and while unsteady simulations can inform where losses are taking place, one is often left none the wiser about what can be done in prevention. In this case, the unsteadiness in for the most part generated not within the NGV, but in the combustor; therefore preventing it is ultimately in the realm of combustor design. While it would be difficult to adapt the types of cascades typically used in turbine research to include reactive flow, it may be possible to add a representation of the NGV to model can combustors used in combustor development, so that knock-on effects on the NGV may be considered early on in the characterisation of combustor designs.
Nomenclature
BL
Boundary layer
CFD
Computational Fluid Dynamics
(Total) pressure coefficient
HF
Heat flux (Wm−2)
HTC
Heat Transfer Coefficient (Wm−2 k−1)
HV
Horseshoe Vortex
LE
Leading Edge
LES
Large Eddy Simulation
NGV
Nozzle Guide Vanes
NOx
Nitrogen oxide, NO, and nitrogen dioxide, NO2
Pressure (Pa)
Total pressure (Pa)
PS
Pressure Side
PV
Passage Vortex
q
Heat Flux (Wm−2)
Re
Reynolds number
rms
Root Mean Square
SS
Suction Side
St
Strouhal number
T
Temperature (K)
TE
Trailing Edge
TFG
Thin Film temperature Gauge
Time step between frames