Nomenclature
C
Blade chord
Cx
Axial chord
H
Blade span (used in the computation)
s
Local curve length of the suction side
S
Total curve length of the suction side
τ
Tip gap size
t
Pitch
Cp0
Total pressure loss coefficient = (P01−P0)/(P01−P2)
HTC
Heat transfer coefficient = q / (Tad−Tw)
Ma
Mach number
Re
Reynolds number = ρVC/μ
P0
Total pressure
T0
Total temperature
Tad
Adiabatic wall temperature
Tw
Wall temperature
q
Local heat flux
V
Velocity
ρ
Density
μ
Dynamic viscosity
ϕ
Flow coefficient
Introduction
In gas turbines, the tip clearance exists between the tip of turbine rotor blade and the stationary casing to prevent rubbing. The hot gas is driven across the blade tip due to the pressure difference between the blade pressure side and suction side, forming tip leakage flow. The tip leakage flow reduces the turbine efficiency and work output. According to 06, the tip leakage loss could account for one third of the total aerodynamic loss of a turbine rotor.
Winglet tips were found to be able to reduce the tip leakage loss. A winglet refers to the extension part at the turbine tip region. It can be applied on a flat tip to form a flat-winglet tip or a squealer tip to form a squealer-winglet tip. The latter is preferred because many studies have shown that squealer tips can produce lower loss than the flat tips 08, 09, 11. With the additional design of winglets, the tip leakage loss of the squealer-winglet tip is believed to be lower than that of the flat-winglet tip. The aerodynamic performance of the squealer-winglet tip has been studied on both linear cascades 26, 19, 05 and rotating rigs 07. In general, it was found that squealer-winglet tips performed better than the squealer tips.
Heat transfer is an important aspect for the tips of rotors in high pressure turbines. A review of turbine blade tip heat transfer is presented by 03. A number of studies related to the flat tips or the squealer tips were published, e.g. 02, 04, 21, 10, 13. Fewer studies focus on the heat transfer of the squealer-winglet tips. 16 found that the squealer-winglet tip had lower average mass/heat transfer compared with the squealer tip. 18 found that the pressure side winglet reduced the tip average heat transfer coefficient by 1.5% on a suction-sided squealer tip. In a transonic turbine cascade, 14 measured the heat transfer on winglet tip surface and near-tip side-walls of a unique squealer-winglet tip. Compared with the flat tip, they found a region of higher Nusselt number close to the tip on the suction surface. Nevertheless, the winglet tip geometries studied in different literatures are very different.
In a previous study by 24, the heat transfer performance of three different cavity-winglet tips was investigated experimentally and numerically in a transonic turbine cascade at a tip clearance of 2.1% chord. It was found that the heat transfer coefficient was very high on the pressure side winglet due to the flow separation reattachment and also quite high on the side surface of the suction side winglet due to the impingement of the tip leakage vortex. Their results also showed that the effect of endwall motion between the blade tip and casing was significant, which was also observed by other researchers, such as 23, 20, 17, 15, 25.
For a turbine, the size of the tip clearance varies and this effect changes the thermal performance of the tips. This paper presents a following work of 24. The aim is to understand the effect of tip clearance on the thermal performance of different winglet tips with endwall motion. In this study, two winglet tips and a baseline cavity tip are investigated at three tip clearances of 1.1, 2.1 and 3.1% chord. The heat transfer on the tip and near tip surface are presented and the flow field is analysed to give explanations to the thermal performance of the blade tips.
Computational details
Tip geometry
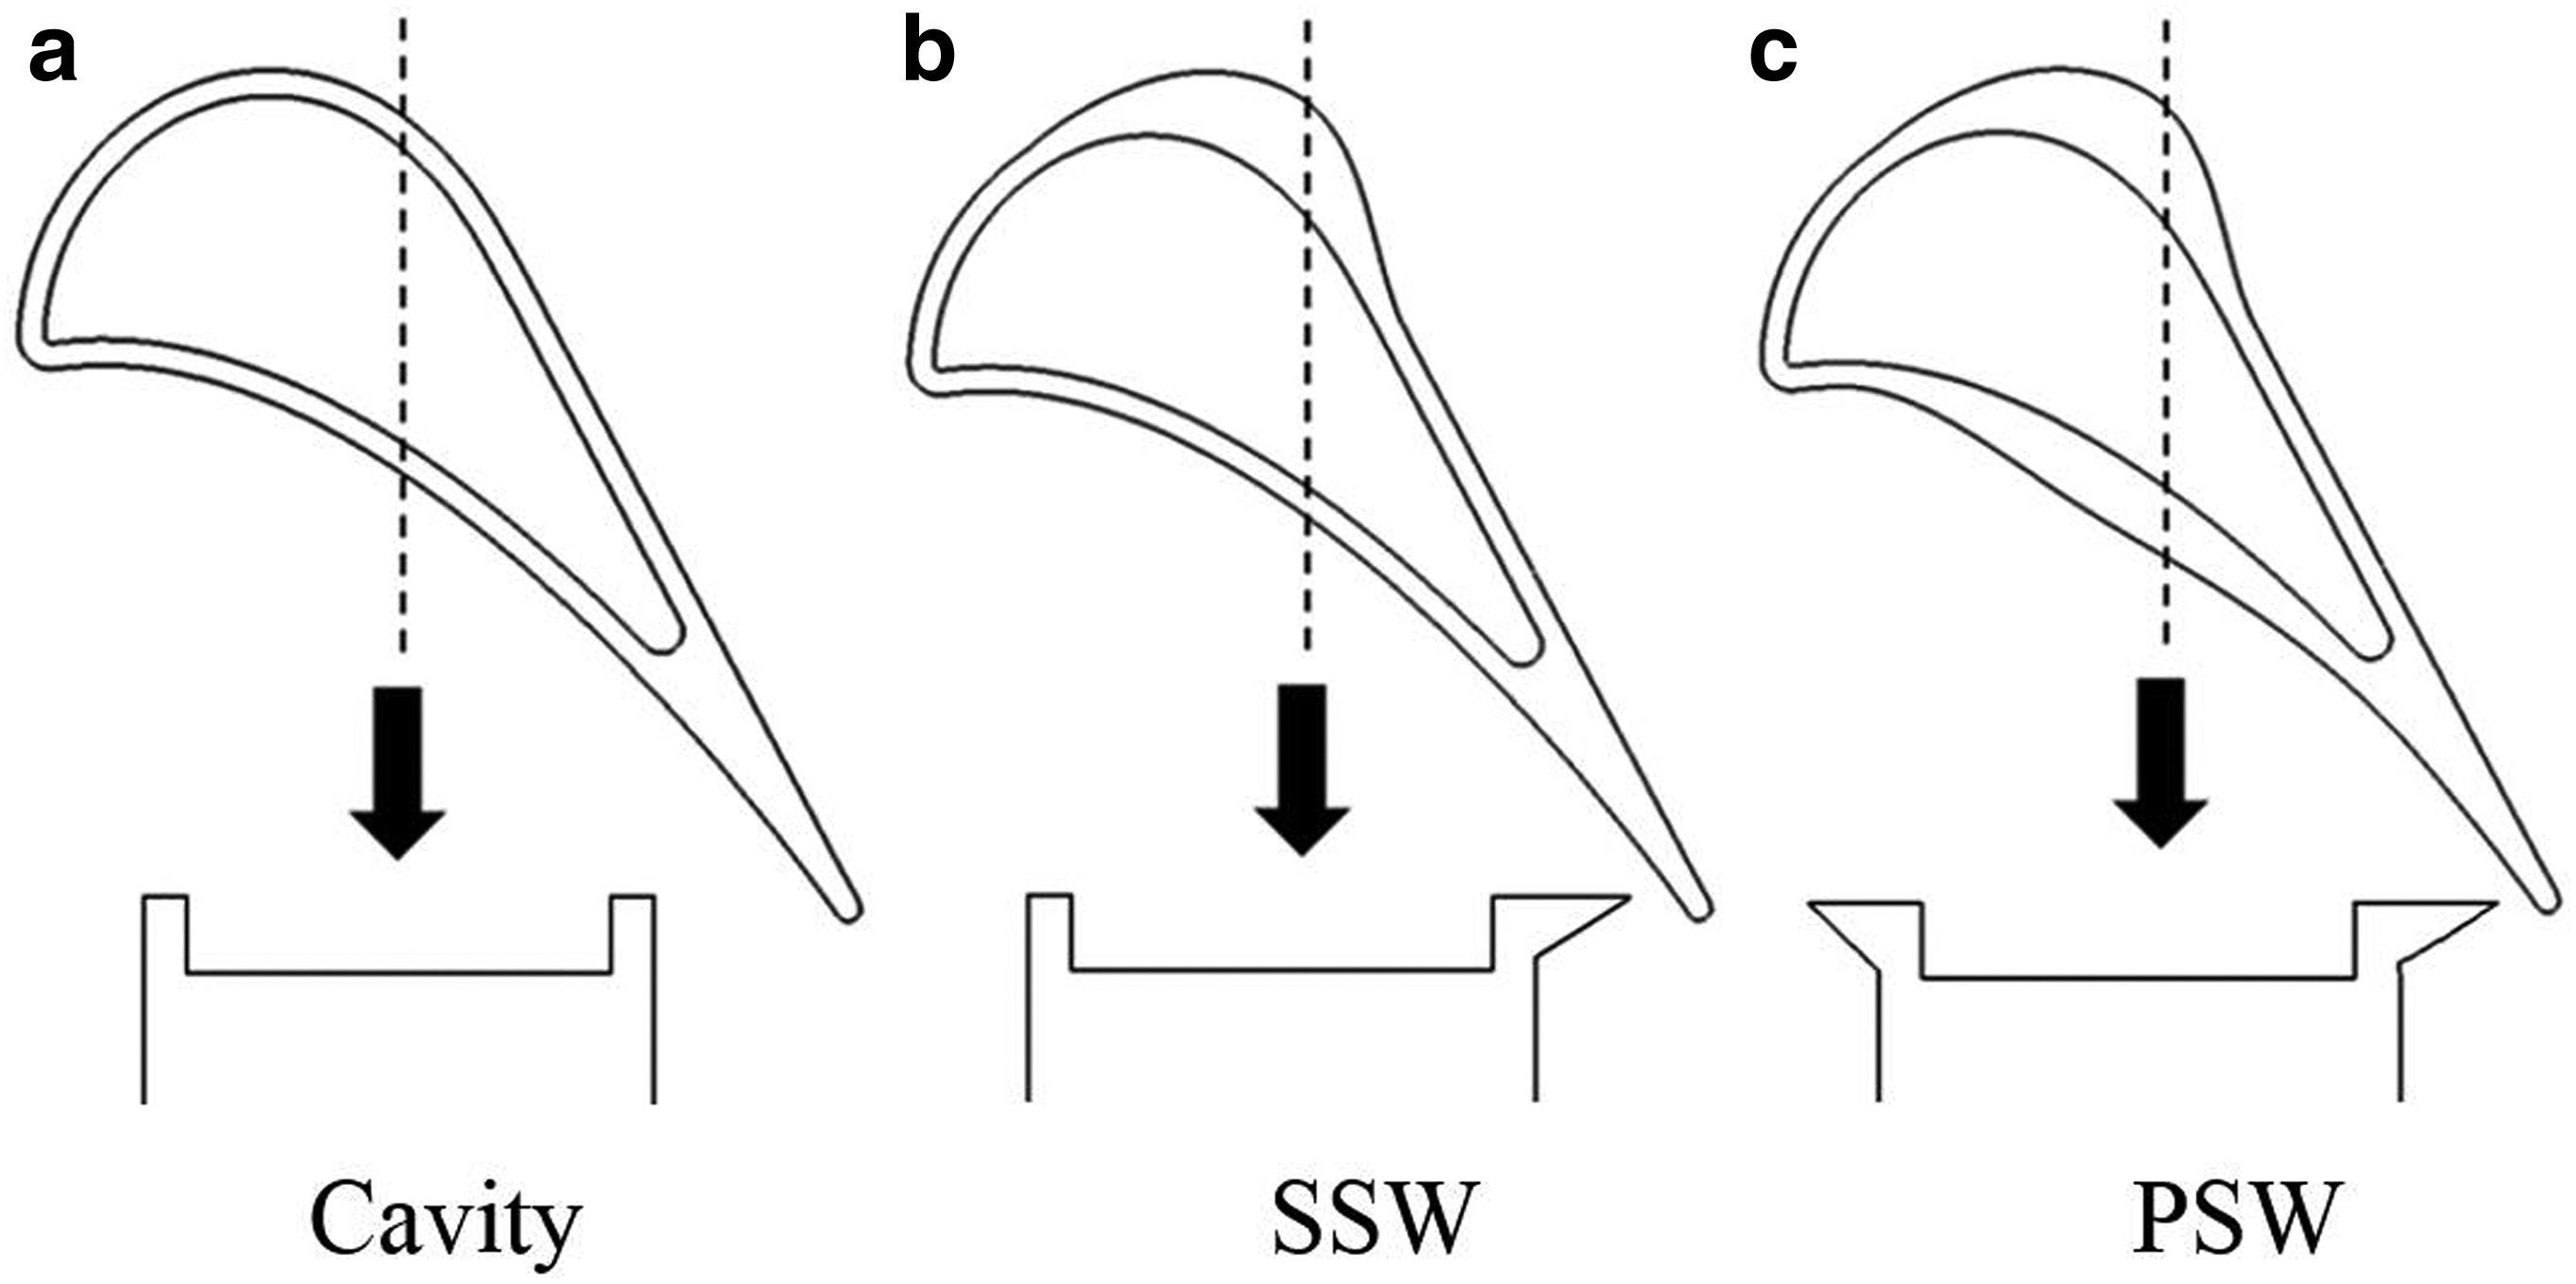
The tip geometries are shown in Figure 1. They are the same as those used in the previous study by 24. The width and height of the cavity squealer are 2.6 and 5.1% chord respectively. The winglet tip “SSW” has a suction side fore-part winglet between 0.15Cx and 0.62Cx. The winglet tip “PSW” has the same suction side winglet as “SSW” and a pressure side winglet. The design of the suction side winglet is based on the method proposed by 27. The cascade profile is the blade geometry near the tip of a modern transonic high pressure turbine rotor. The main parameters of the cascade are listed in Table 1.
Meshing and computational solver
Figure 2 shows the computational domain and mesh of the cavity tip. The computational domain uses one blade with periodic boundary conditions to simulate a row of blades. The inlet of the computational domain is located 0.3 axial chord upstream of the cascade and the domain outlet is located 1.2 axial chord downstream of the cascade.
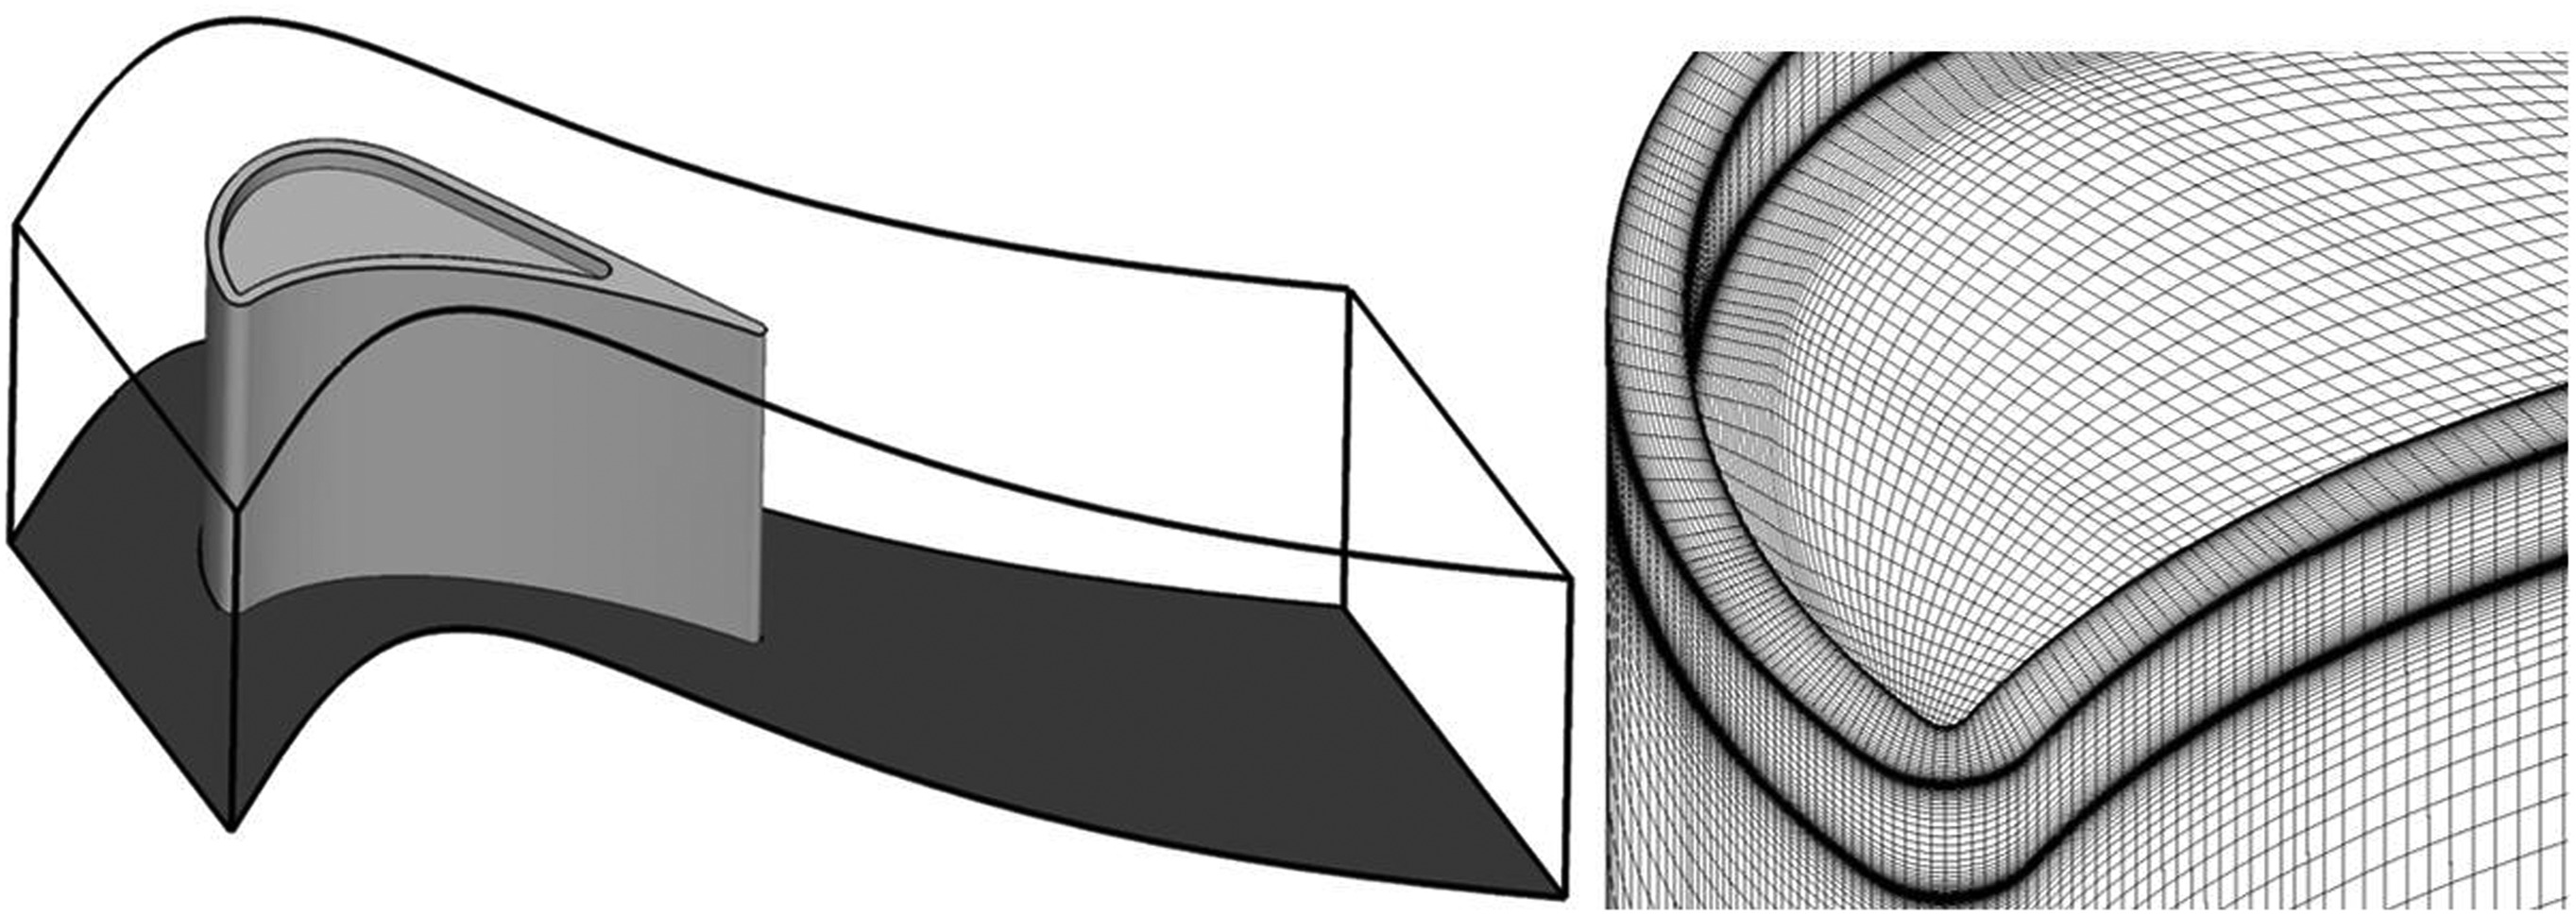
The meshes are built with commercial software ICEM CFD. All of the meshes are structured hexahedral with mesh growth factor less than 1.3. The tip average y+ is around 2.
The Commercial software ANSYS Fluent is employed to solve the steady Reynolds-averaged Navier-Stokes (RANS) equations, which are discretized in space using a second order. The turbulence model is Spalart-Allmaras model. The “pressure inlet” and “pressure outlet” conditions are applied to the inlet and outlet of the computational domain. For each case, the inlet flow parameters are all uniform. The inlet turbulence intensity is 10%. The “hub” is set as “symmetry” condition. The “casing” is set as a moving wall to simulate the relative motion between the blade tip and the casing, because it was found that effects of the centrifugal force and the Coriolis force were much smaller than the effect relative endwall motion 22, 01. The flow coefficient is 0.4. The cascade exit Mach number is 1.2 and the exit Reynolds number (based on chord) is 1.7 × 10⁶.
The blade surface heat transfer coefficient (HTC) is obtained based on the results of two calculations. One with blade surface set as adiabatic wall and the other with blade surface set as isothermal wall with wall temperature of Tw. HTC is defined as follows:
where q is the local heat flux obtained in the calculation with isothermal wall temperature of Tw, Tad is the adiabatic wall temperature obtained in the calculation with adiabatic wall condition. In the current study, Tw is 197K, which gives an engine representative gas to wall temperature ratio of 1.5.
The mesh sensitivity study is conducted on the winglet tip “PSW” at a tip clearance of 2.1%C. Three different mesh quantities of 6.5, 8.5 and 10 million are used. The mesh was refined in the spanwise direction. The tip average y+ and average heat transfer coefficient are listed in Table 2. The tip average HTC decreases by 1.8 and 1.9% when the mesh quantity increases from 6.5 to 8.4 million and 10 million.
Experimental validation
Figure 3 shows the experimental and predicted tip HTC of the winglet tip “PSW” without endwall motion at two tip clearances of 1.1%C and 2.1%C for validation. The details of the experiment and the result analysis for tip clearance of 2.1%C have been reported by 24. The HTC is obtained by the same method used by 12. The experimental uncertainty of the tip area-weighted averaged HTC is ±9.4%. The HTC is quite high on the pressure side winglet surface. As the tip clearance increases, the HTC on the cavity floor surface and on the suction side winglet surface increases, while the HTC on the pressure side winglet surface decreases. The CFD well predicts these trends.
Figure 3.
Experimental and predicted tip heat transfer coefficient of winglet tip “PSW” without endwall motion.

Figure 4 presents the HTC distribution at two axial locations of 0.5Cx and 0.9Cx as indicated in Figure 3. In Figure 4, both the CFD and experiment show that the HTC is relatively low inside the cavity. The CFD under predicts the HTC value on the pressure side winglet and inside the cavity, but agrees well with the experiment on the suction side winglet. In Figure 4, the CFD result shows that HTC decreases as tip clearance increases. However, the experimental result shows that the HTC decreases on the pressure side but increases on the suction side. Note that at the two locations, the discrepancy is large near the blade tip edge and squealer corner. One possible reason is that the blade tip edge radius is not considered in the calculation, so the flow separation above the squealer/winglet can not be modelled accurately. Another reason is that the three-dimentional conduction effect is ignored in the experimental data processing.
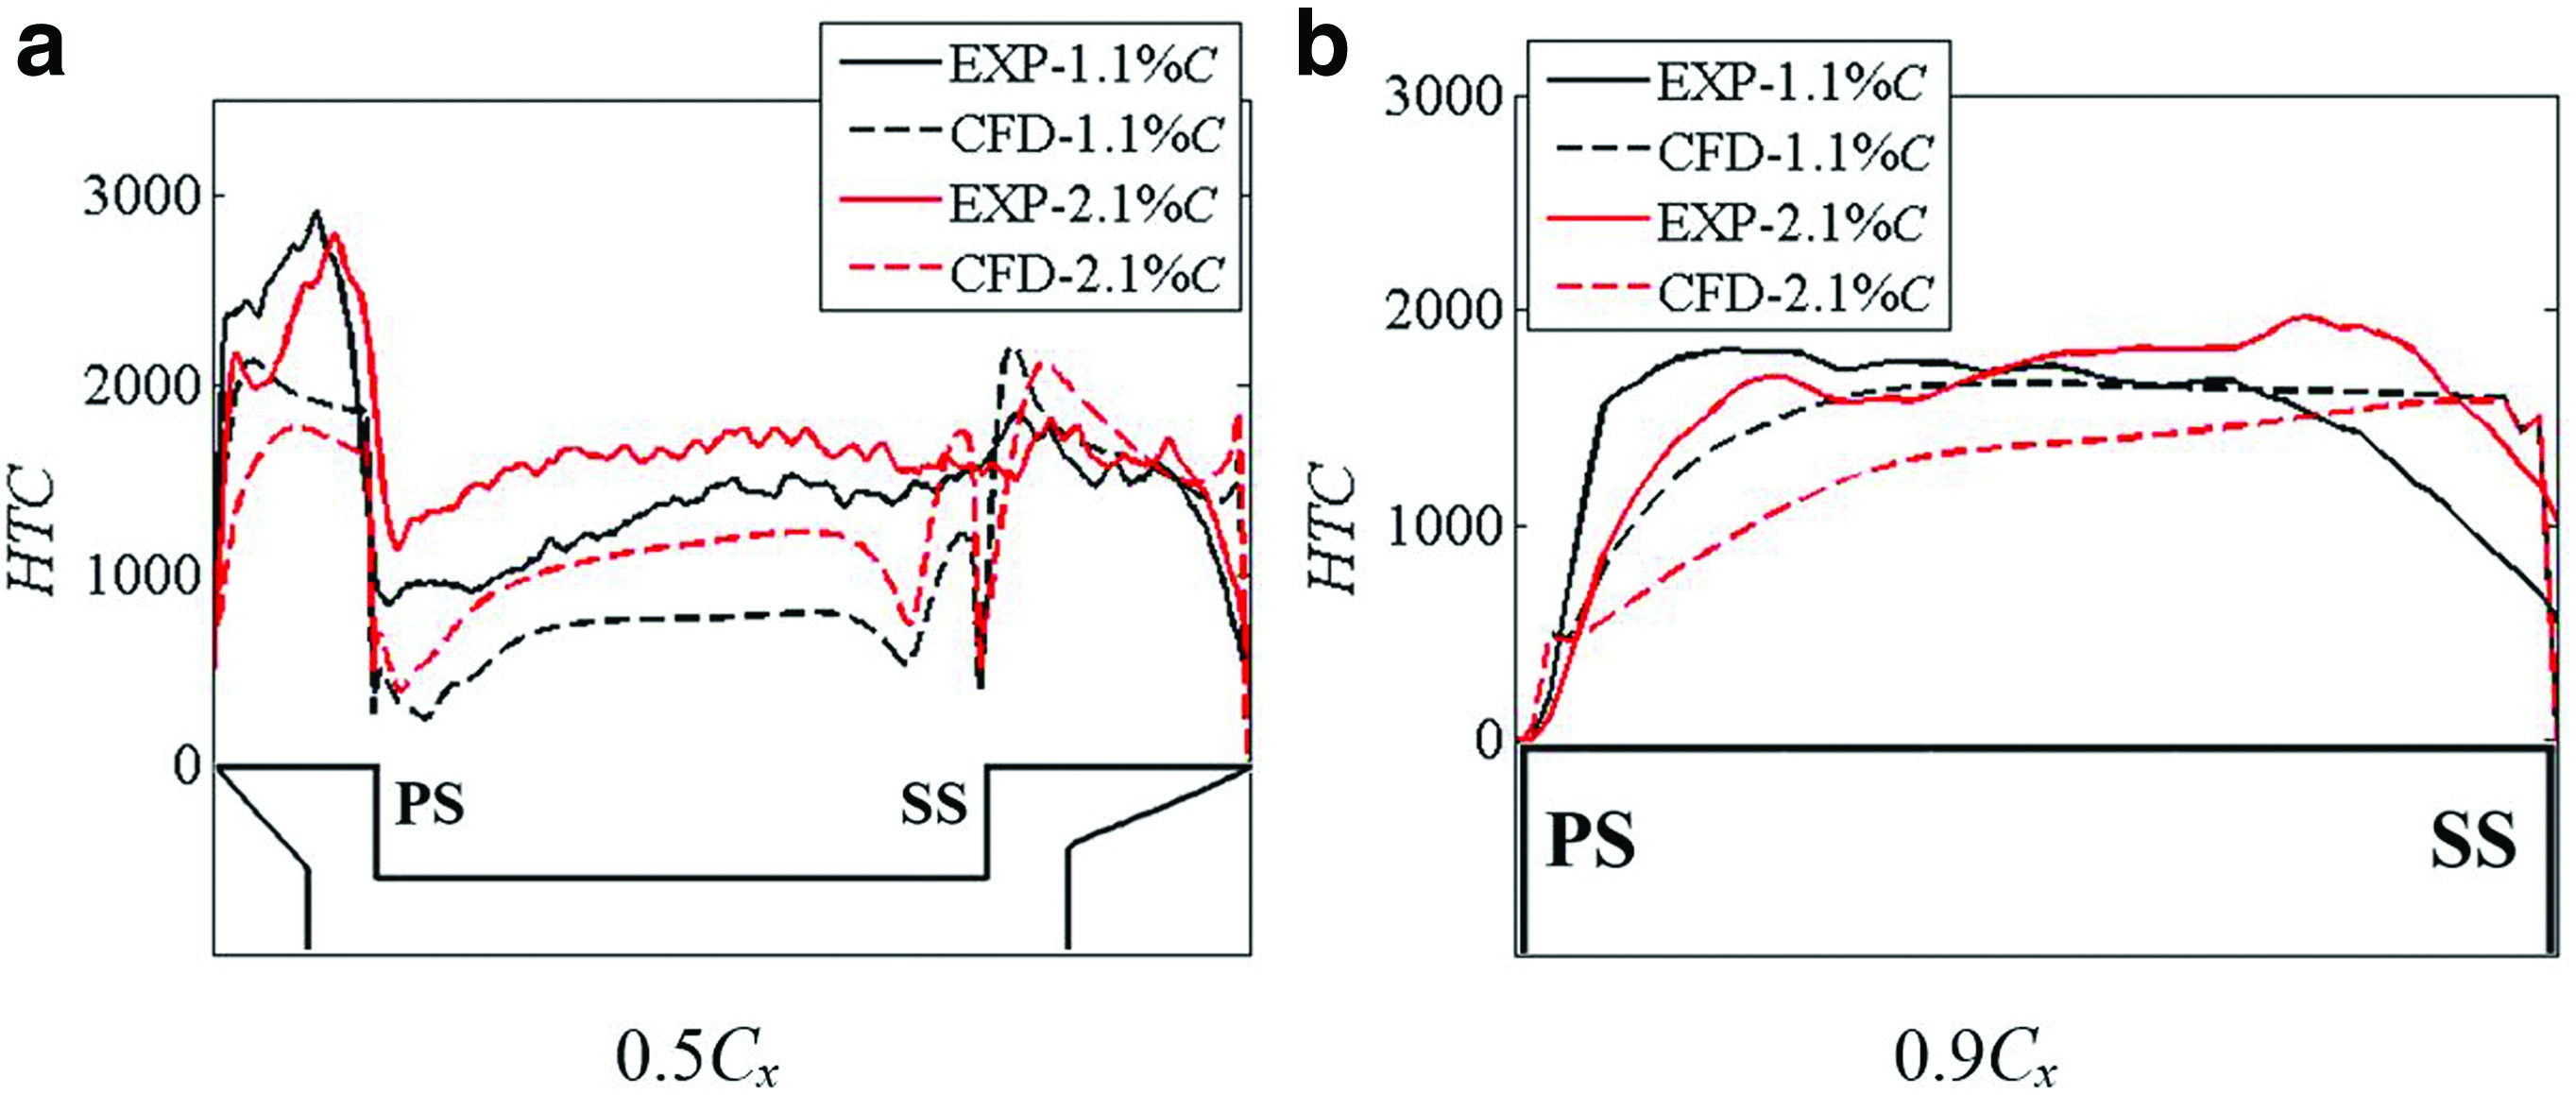
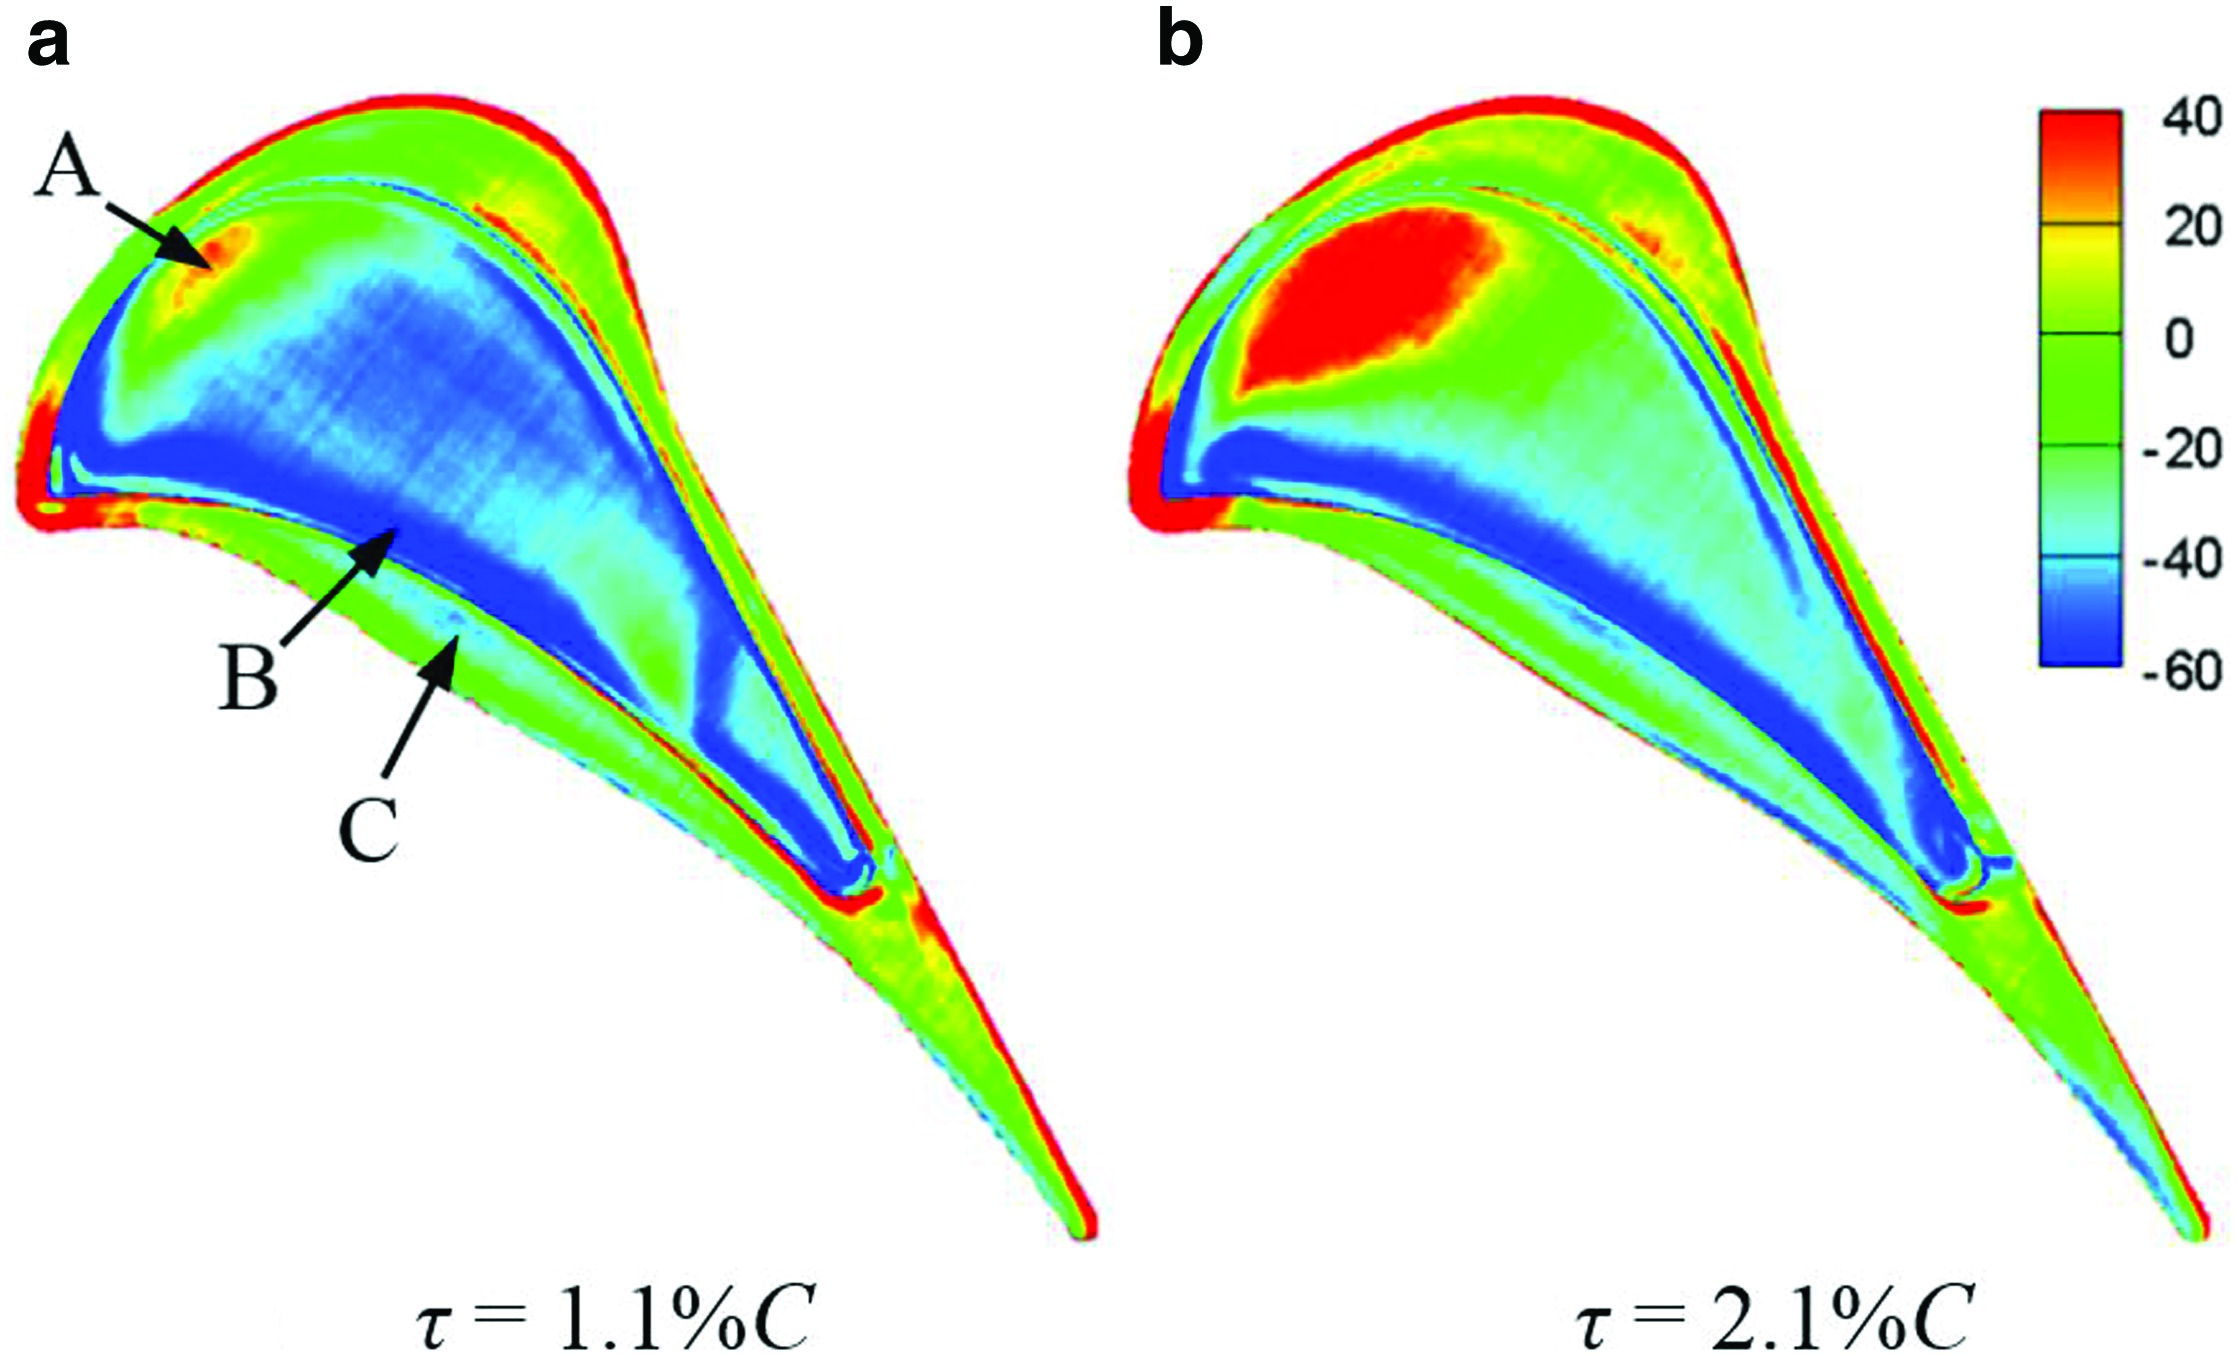
Figure 5 shows the relative HTC difference between the numerical and experimental results. Inside the cavity, the CFD under predicts the HTC in most areas except for region “A.” The biggest difference occurs in region “B” near the pressure side winglet, where the CFD under predicts the HTC by 50 to 75%. On the pressure side, suction side winglet surfaces and near the trailing edge region, the relative difference is mainly within ±20% except for region “C” and the blade tip edge.
Results and Discussion
The results presented in this part are obtained by numerical methods with relative endwall motion. Besides, all the flow field results are obtained based on the simulations with the “blade” and “casing” set as the adiabatic wall.
Tip heat transfer results
Figure 6 shows the distribution of tip heat transfer coefficient of different tip geometries with endwall motion. For the cavity tip, as the tip clearance increases, the HTC on the cavity floor surface generally increases. The area of high HTC region “A” and “C” becomes bigger while the area of low HTC region “B” becomes smaller. The HTC above the pressure side squealer decreases with the tip clearance.
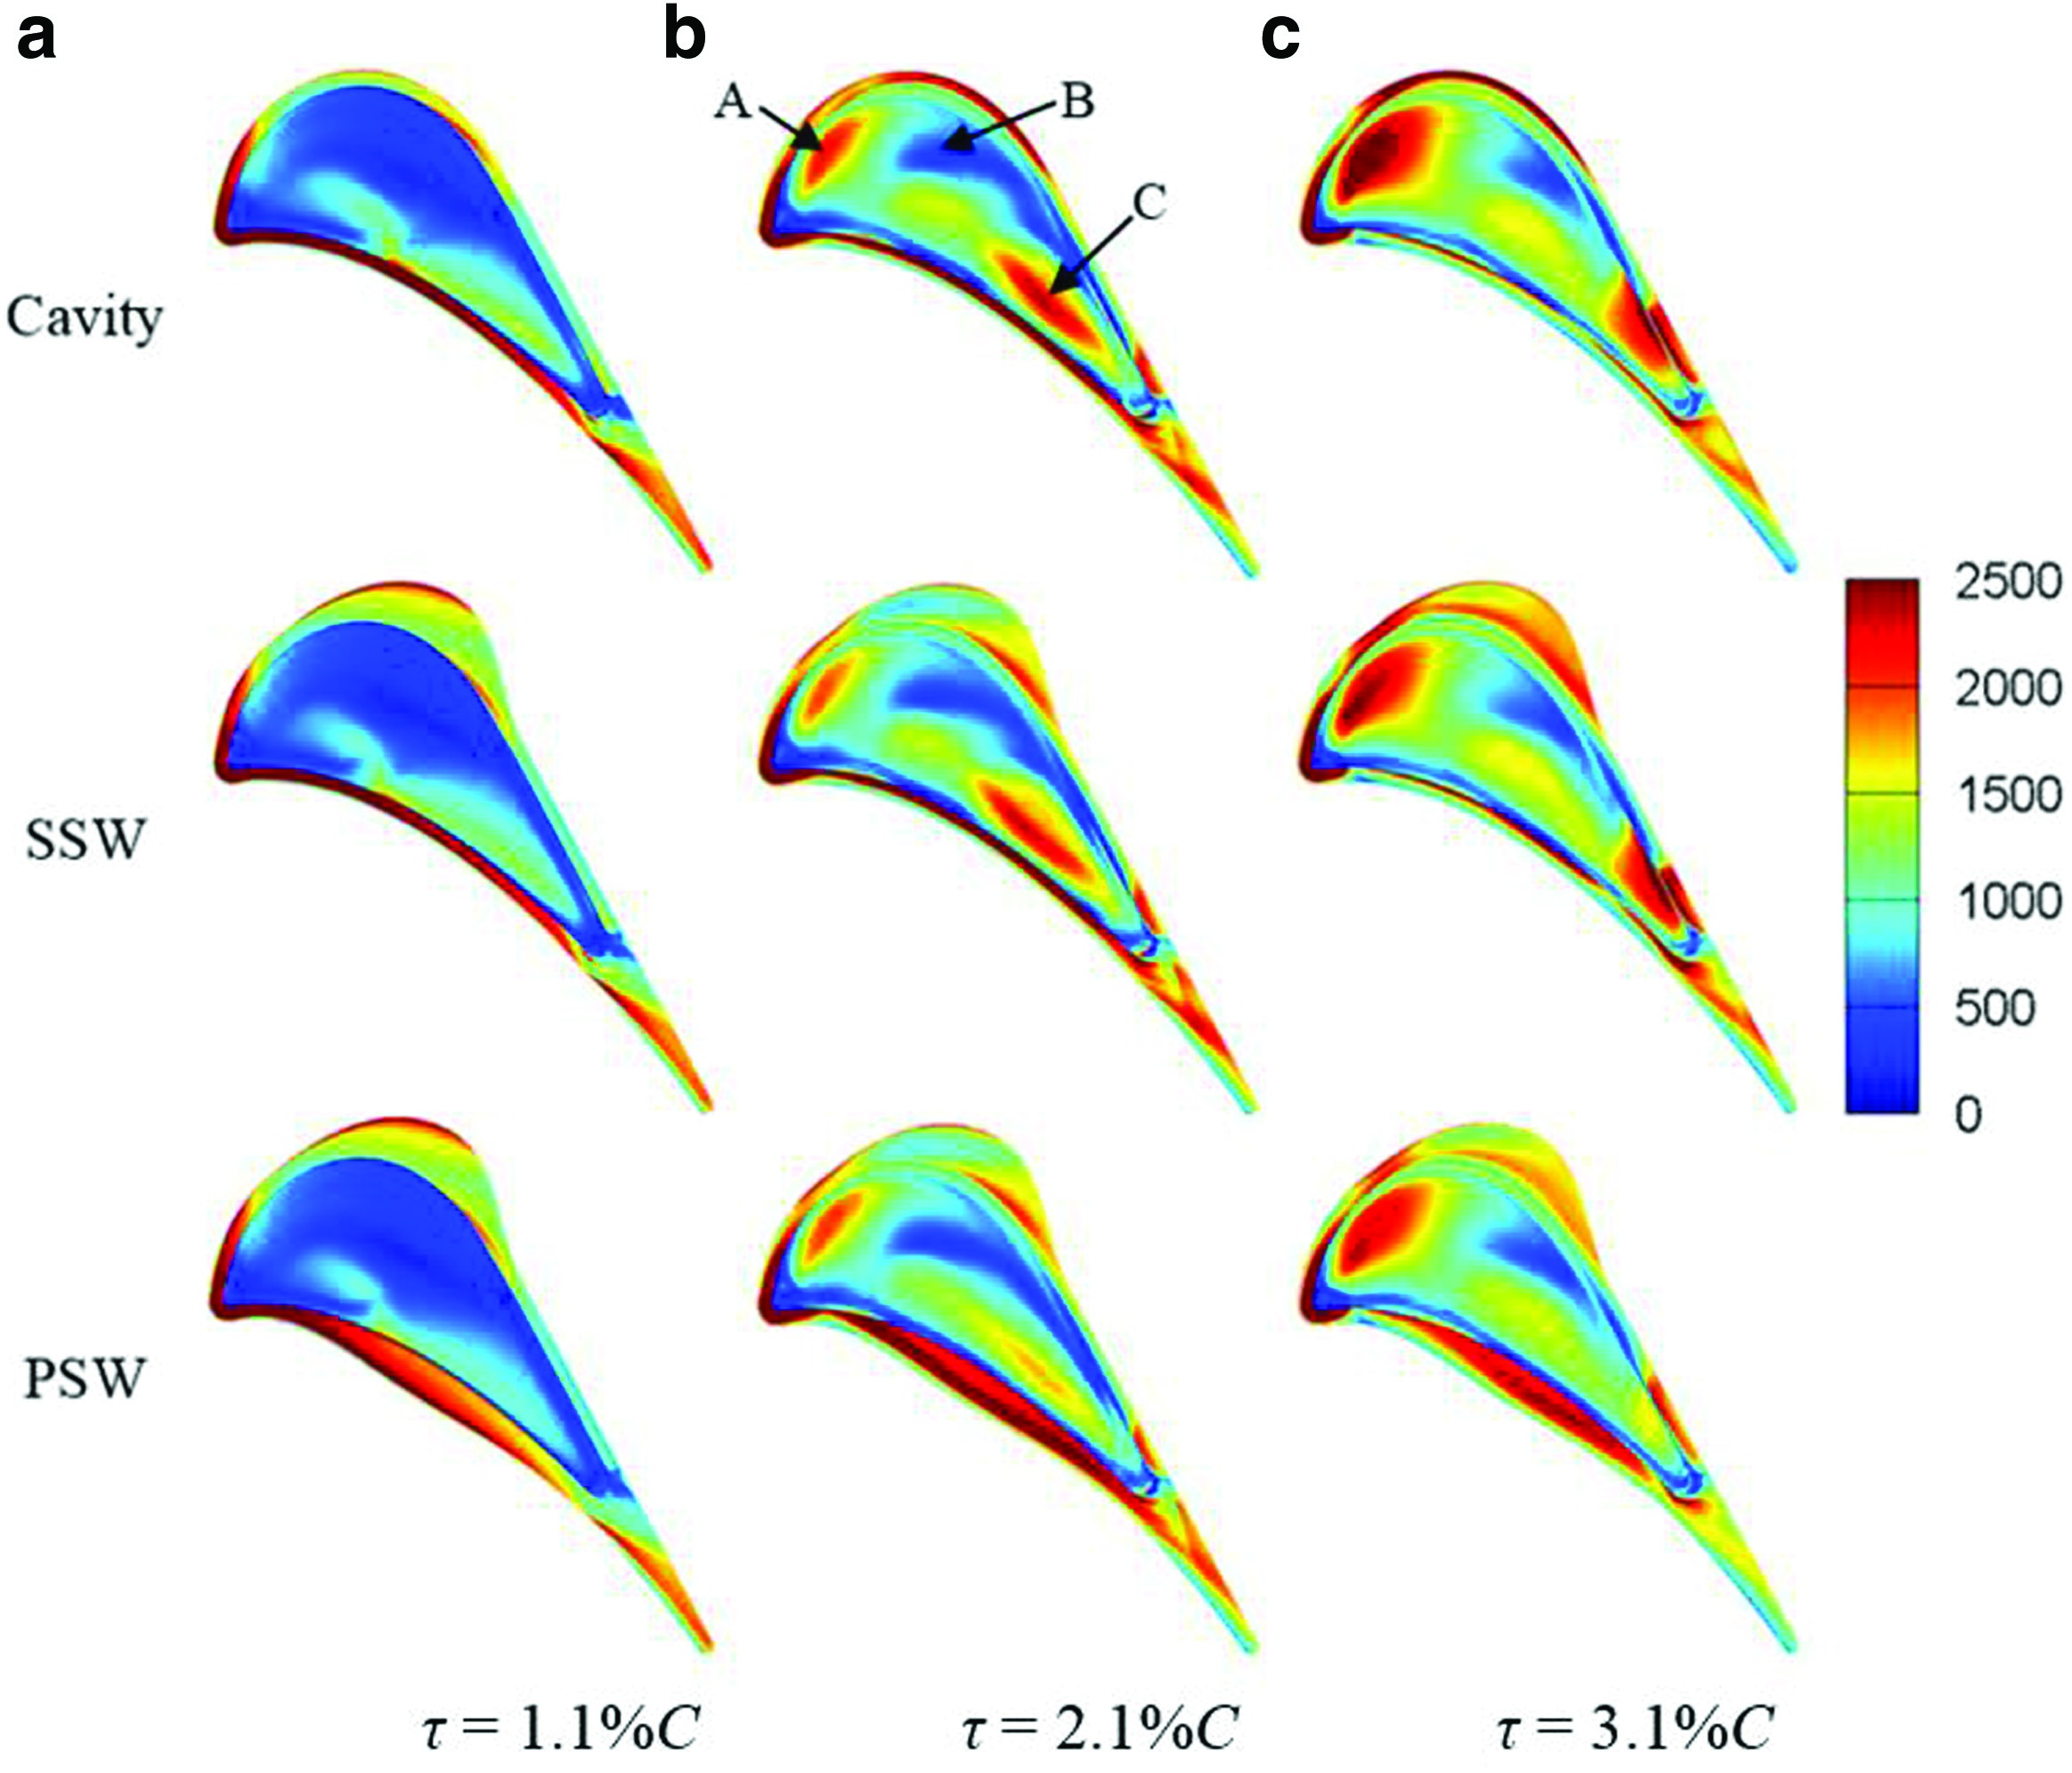
Compared with the cavity tip, the suction side winglet has little effect on the HTC distribution above the pressure side squealer and on the cavity floor surface at all tip clearances. The pressure side winglet slightly reduces the HTC on the cavity floor, but the distribution pattern is very similar with that of the cavity tip. The HTC on the pressure side winglet is much higher than that on the suction side winglet. As the size of the tip gap increases from 1.1%C to 3.1%C, the HTC on the pressure side winglet first increases and then decreases. The winglets mainly change the flow structure locally above the winglet geometries, and the HTC distribution on the suction side winglet of “SSW” and “PSW” is very similar. So, the tip flow structure of winglet tip “PSW” will be presented to explain the tip heat transfer results.
Figure 7 shows the HTC distribution on inner vertical squealer surface of winglet tip “PSW.” The results of cavity tip and winglet tip “SSW” are not presented because they are quite similar with the result of “PSW.” At the smallest tip clearance, the HTC is less than 1000 W/m2·K in most areas. A local high-HTC spot appears in region “A” on the pressure side and the maximum HTC value is about 2900 W/m2·K. As the tip clearance increases, the HTC increases because the flow velocity inside the cavity near the vertical squealer increases with the tip clearance as shown in Figure 10 and Figure 11. At tip clearances of 2.1%C and 3.1%C, the HTC in region “B” and “C” is relatively larger. The maximum value in region “B” is 2300 W/m2·K and 2900 W/m2·K for τ = 2.1%C and τ = 3.1%C respectively, while it is about 4600 W/m2·K in region “C” for the two tip clearances.
Figure 11.
Mach number on the cross section plane in the blade rear part region of winglet tip “PSW”: (a) 1.1%C, (b) 2.1%C, and (c) 3.1%C.
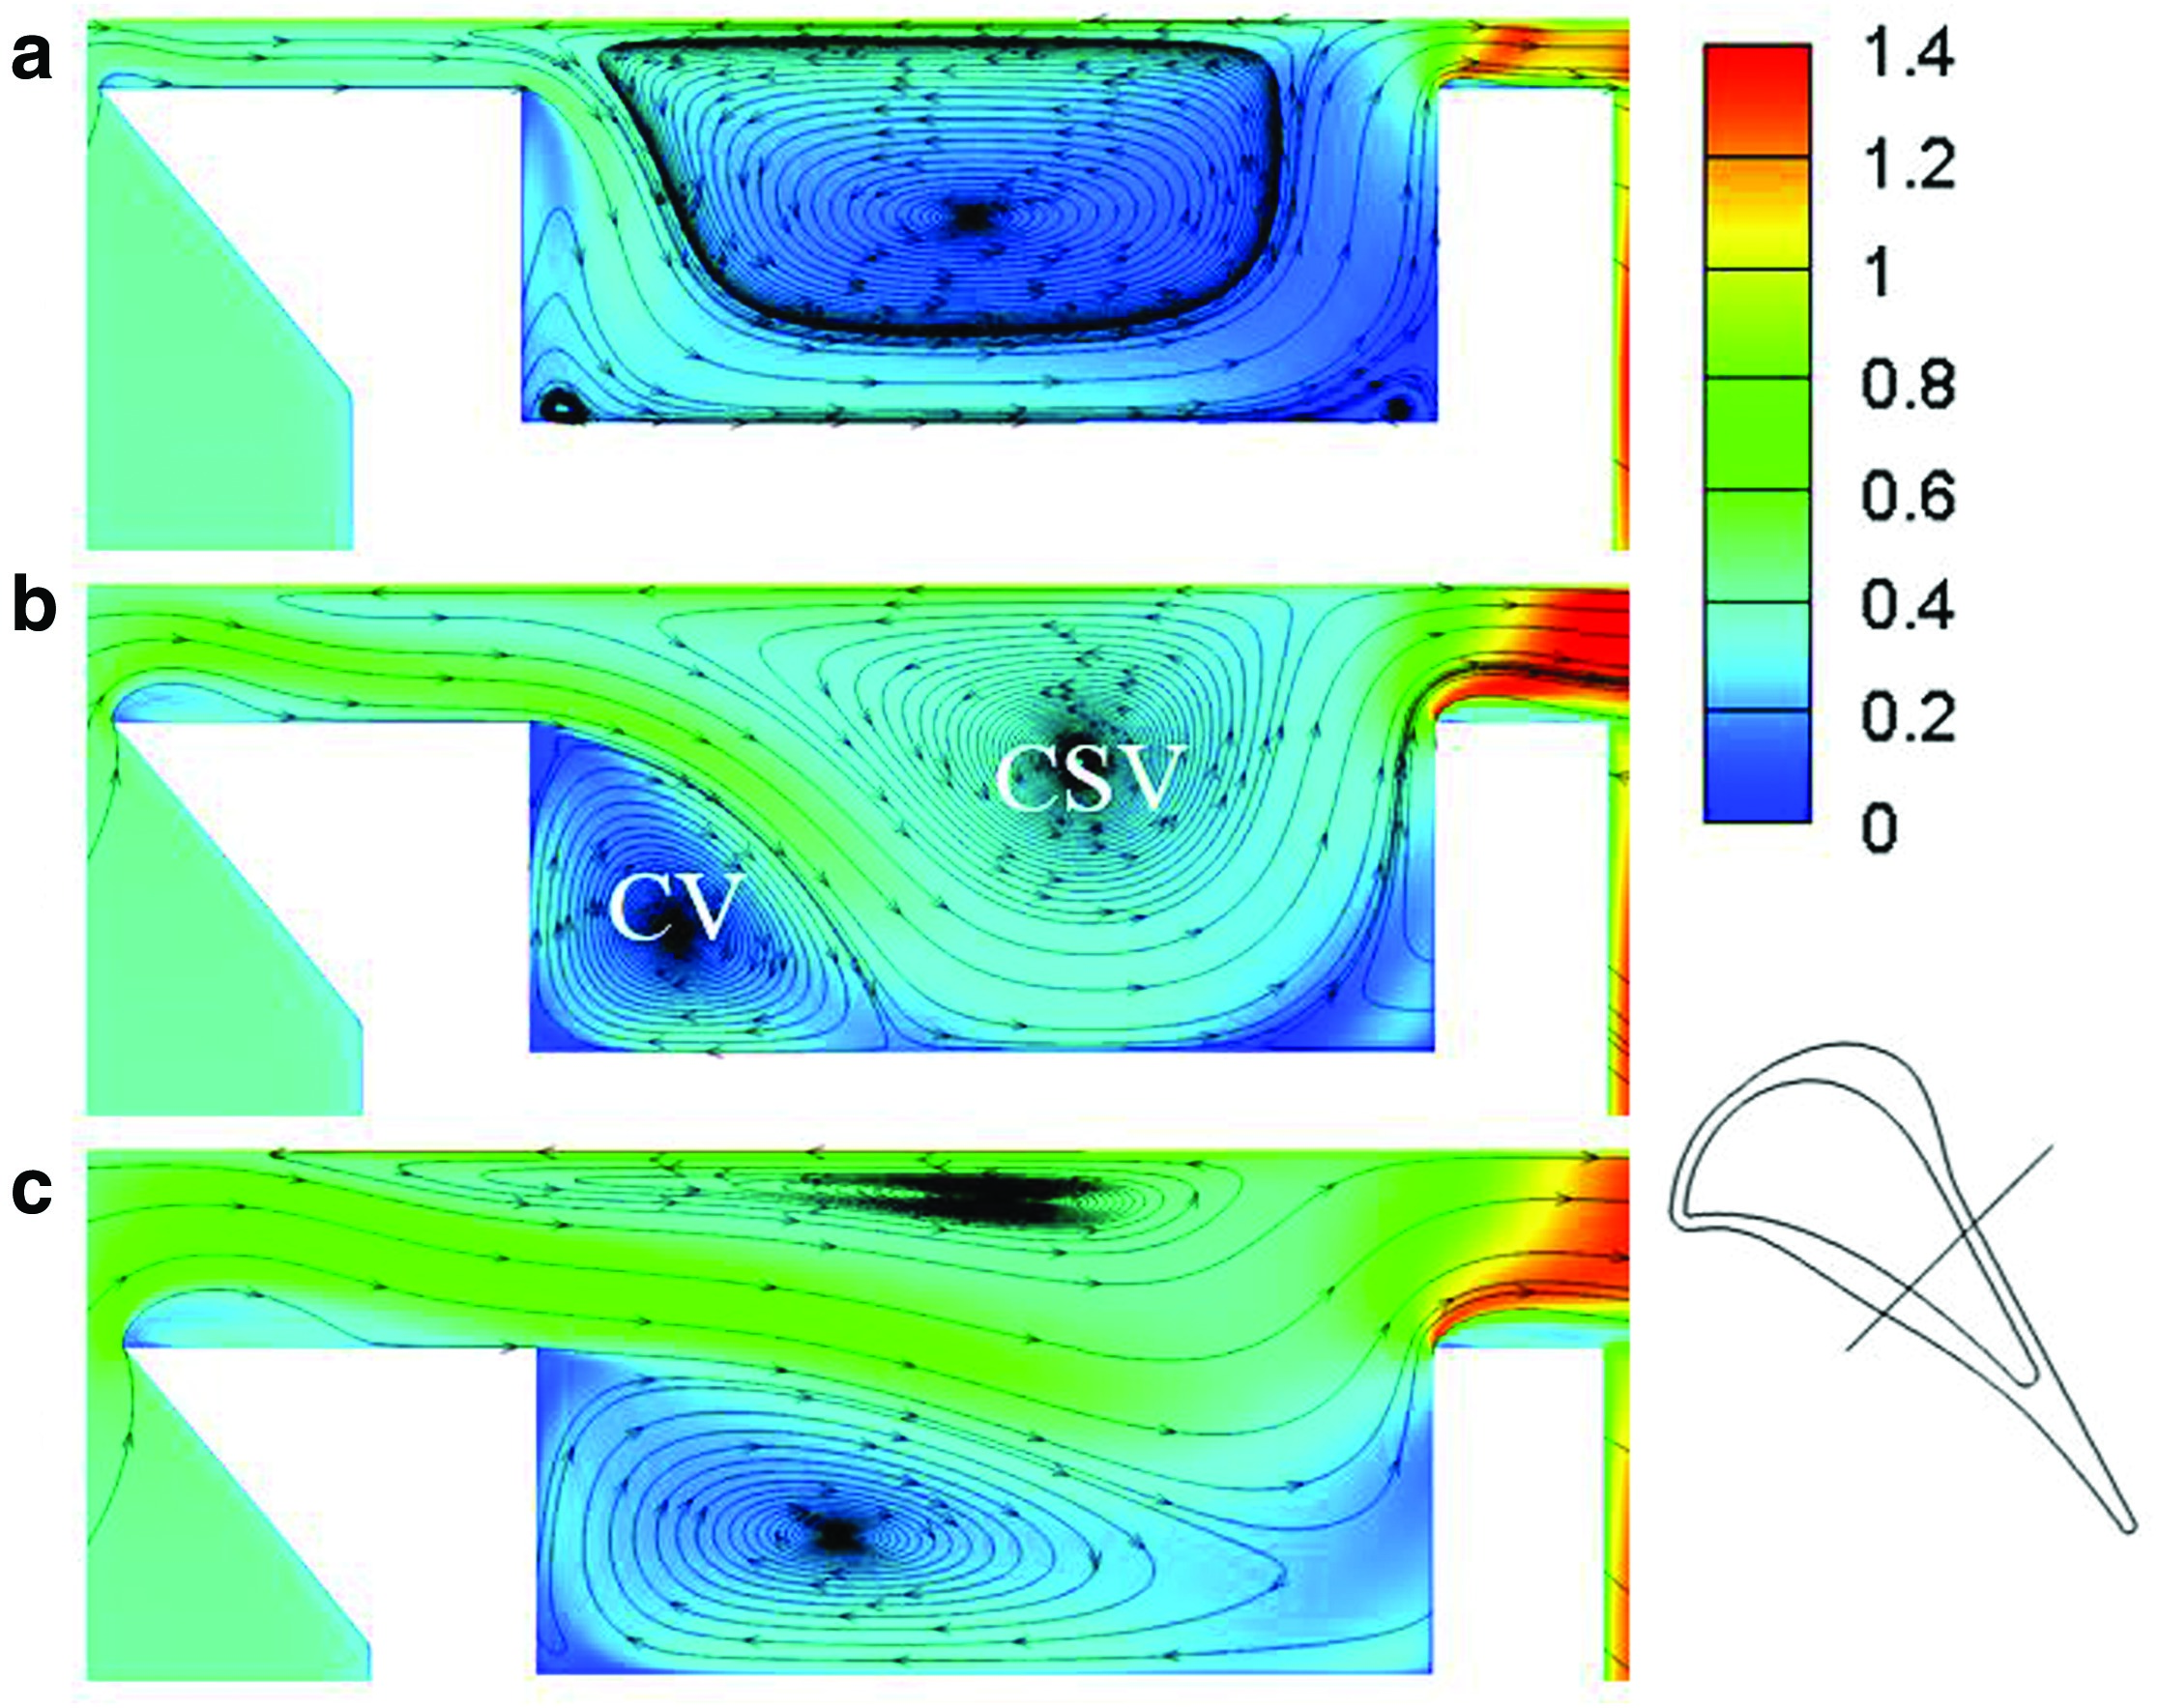
Figure 10.
Mach number distribution on the cross section plane in the blade frontal region of winglet tip “PSW”: (a) 1.1%C, (b) 2.1%C, and (c) 3.1%C.
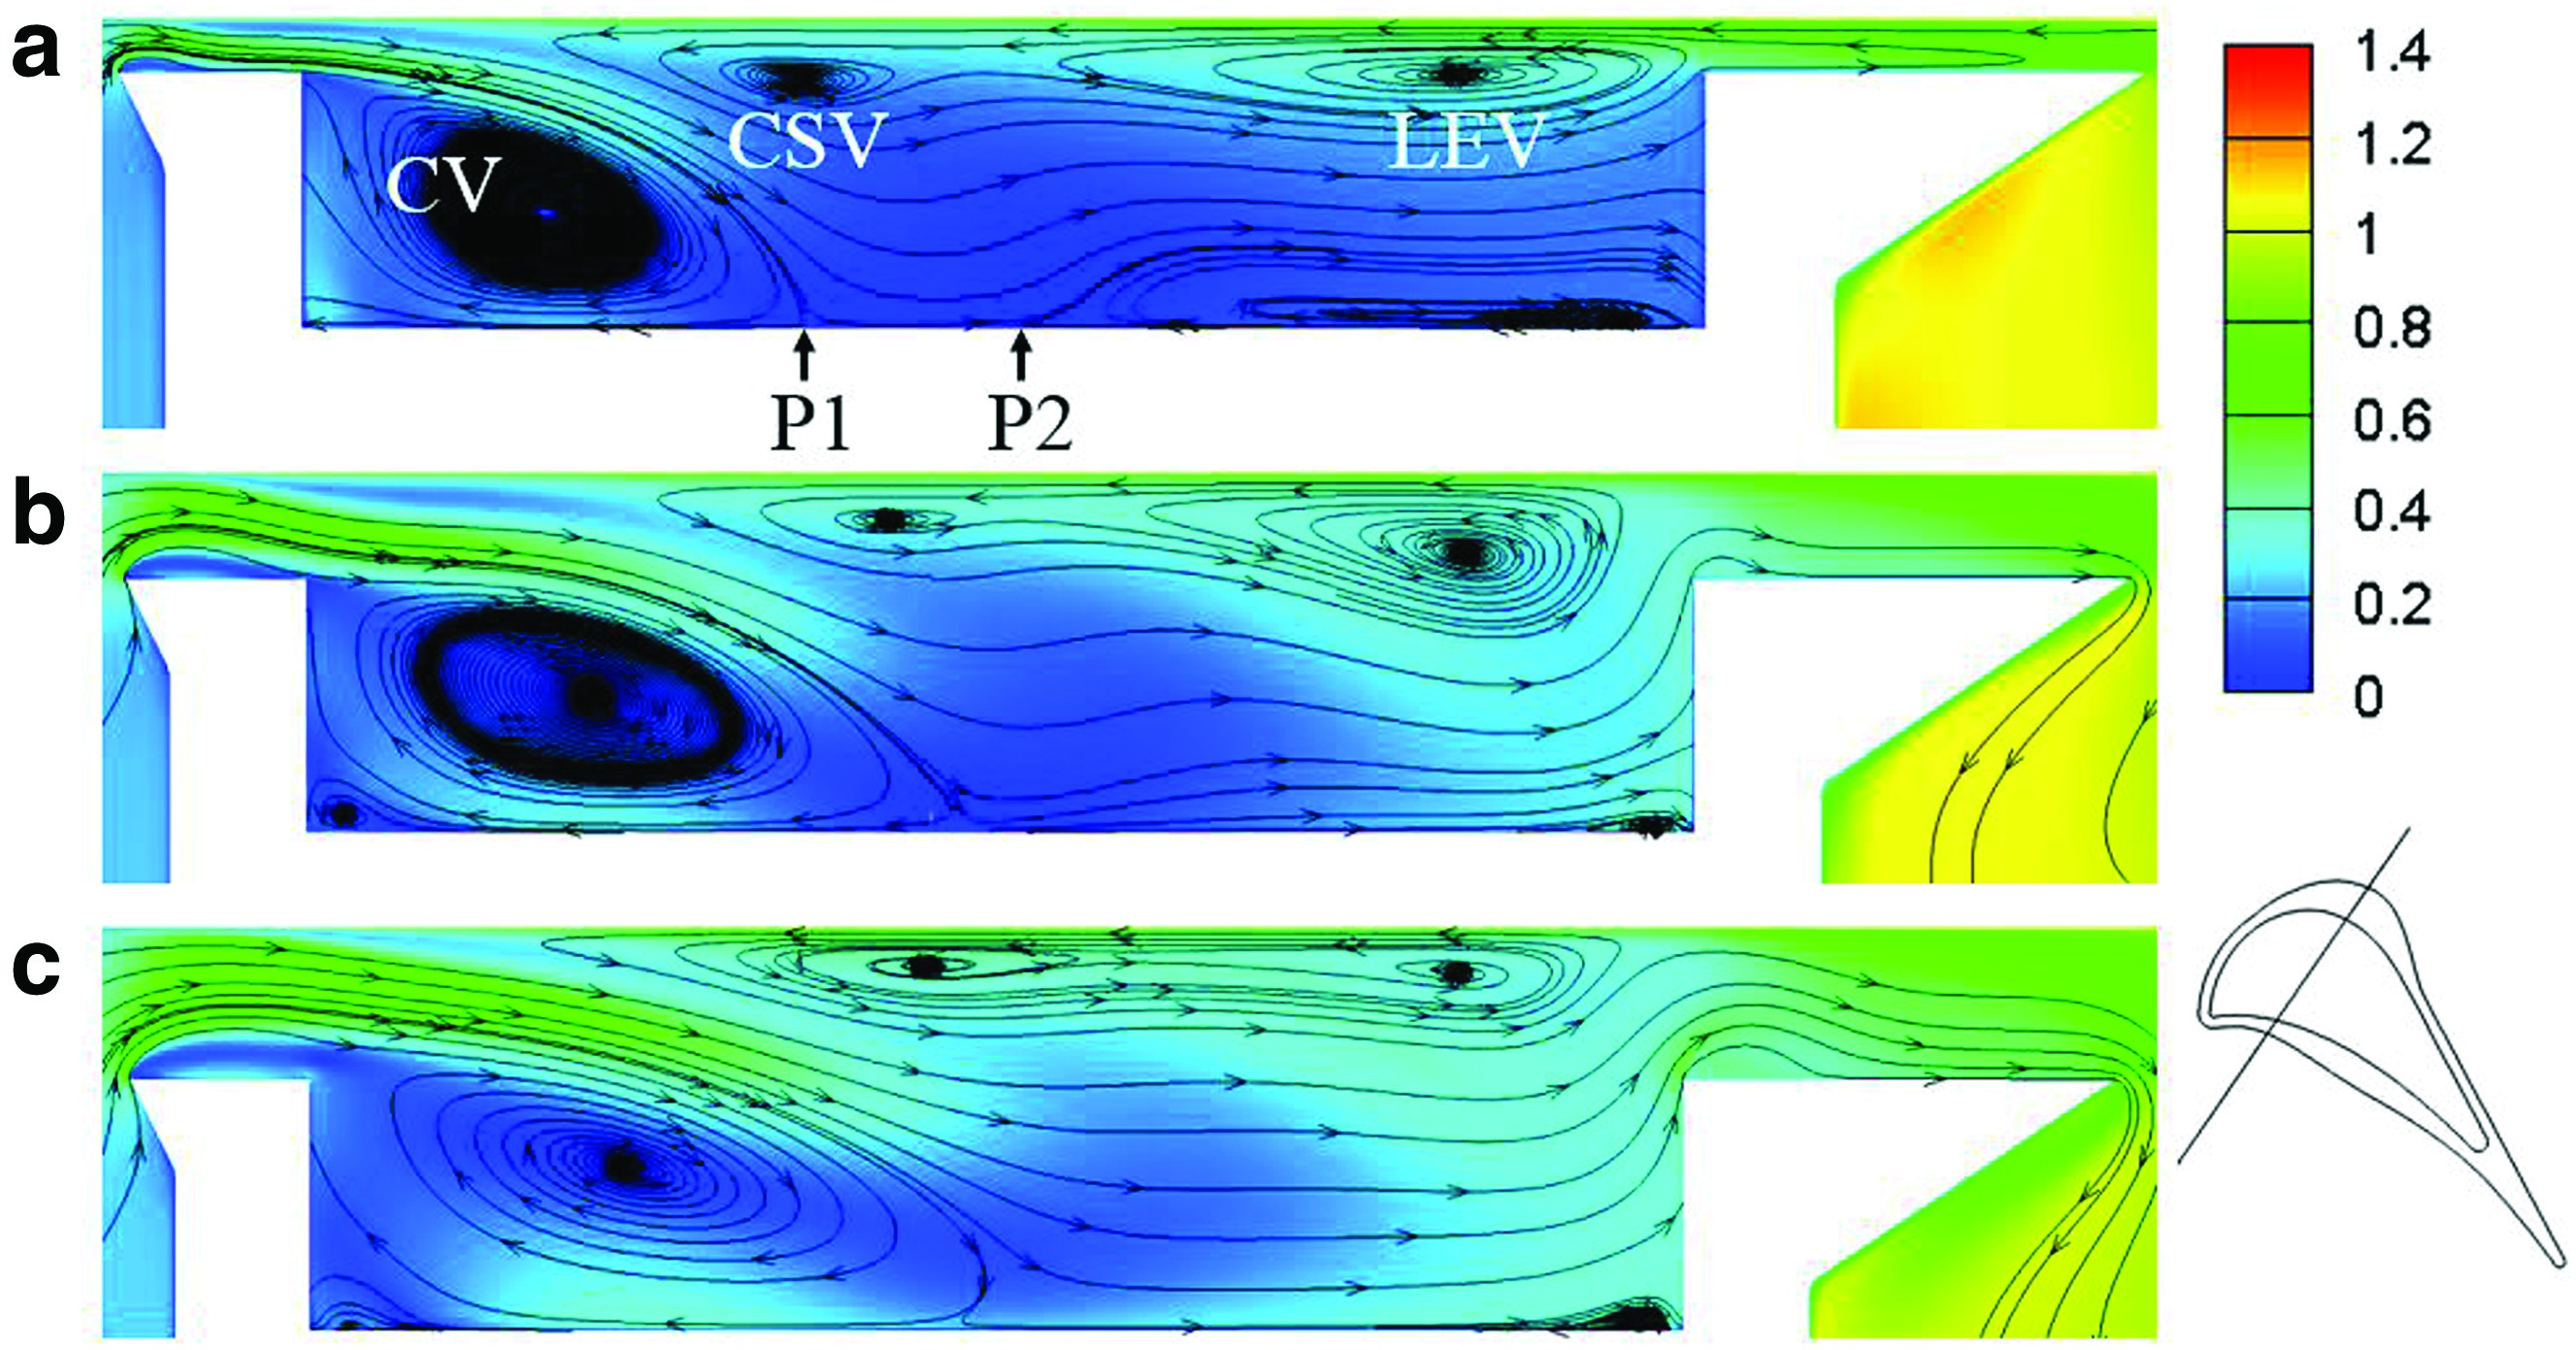
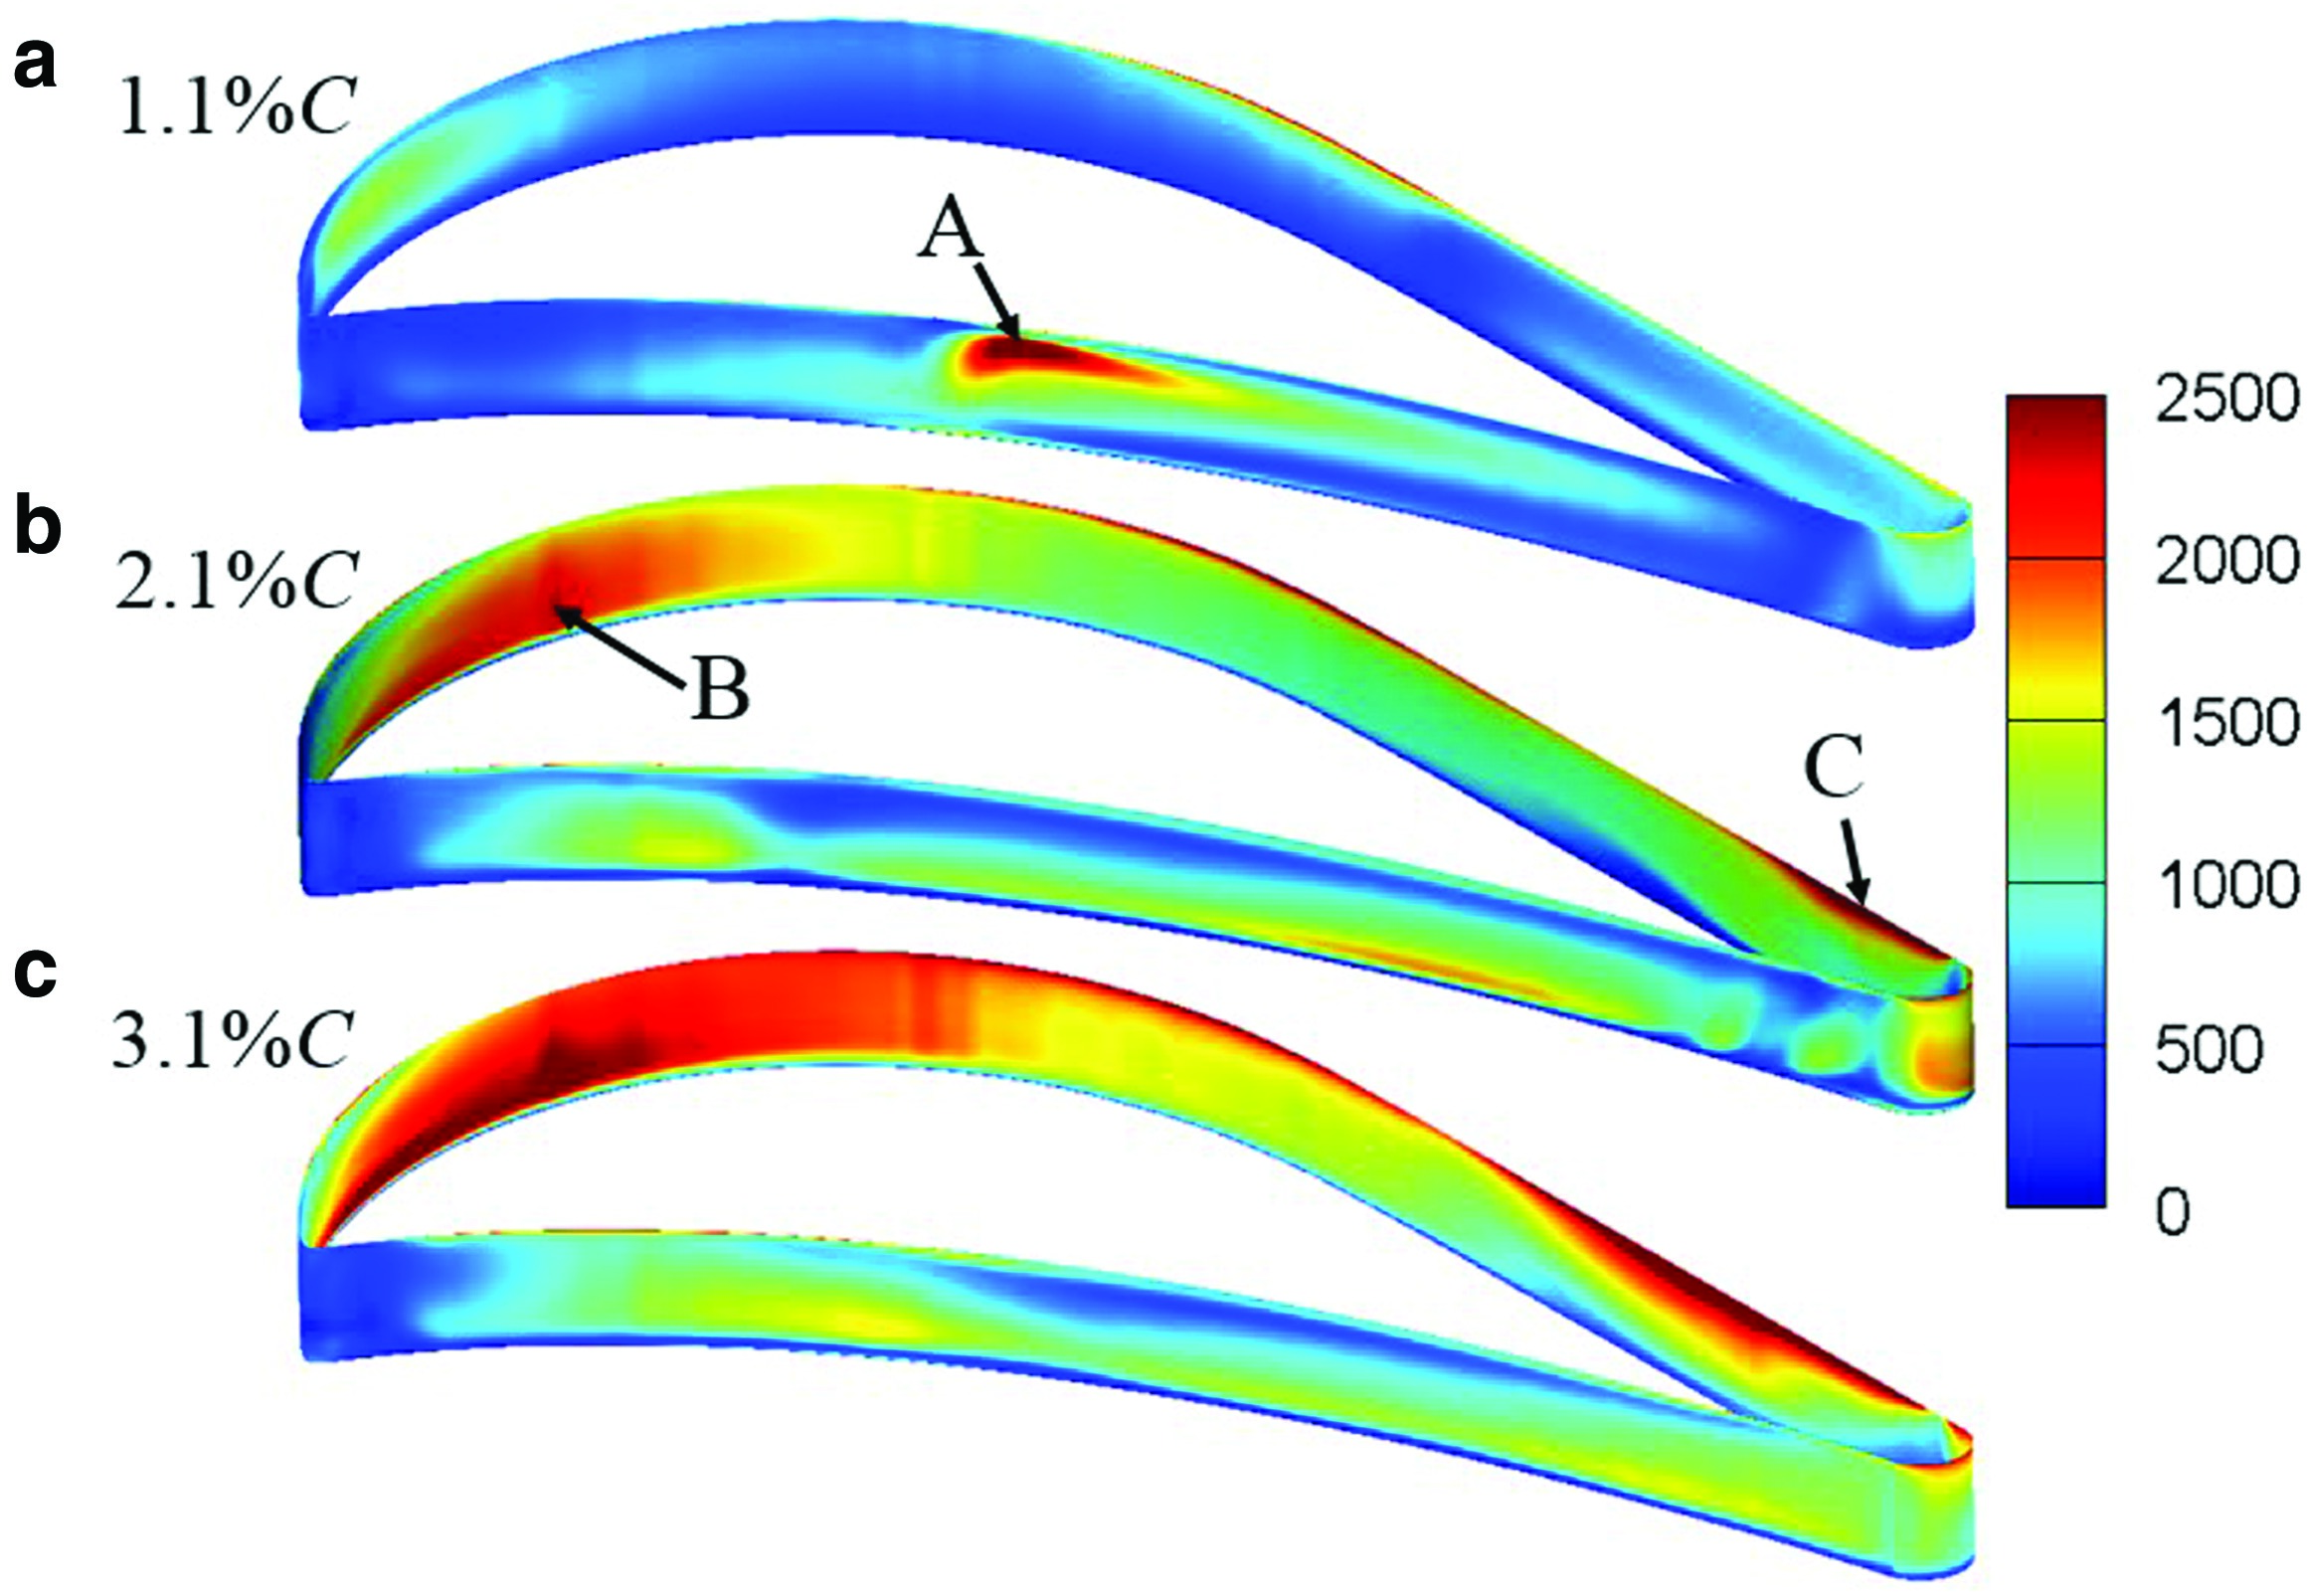
Figure 8 shows the Mach number distributions and two-dimensional streamlines on the cut plane in the middle of the tip gaps of winglet tip “PSW.” The dark contour lines correspond to Ma = 1. The flow enters the tip gap from the pressure side and front part of the suction side region. At all tip clearances, the subsonic flow dominates the region inside the tip gap except for the region above the suction side squealer after the middle chord, where the flow becomes supersonic. The flow inside the tip gap is deflected due to the shear force caused by the endwall motion. The flow is deflected more towards the tangential direction at a smaller tip gap. The Mach number of the flow within the tip cavity generally increases with the tip clearance.

Figure 9 shows the 3D tip flow streamlines of winglet tip “PSW” coloured by flow Mach number at three tip clearances. Near the leading edge, the flow enters the tip gap and impinges on the cavity floor surface, which results in the high HTC region “A” shown in Figure 6. Then the flow rolls up to form the “Leading Edge Vortex”(LEV). Above the pressure side winglet, the flow first separates and then reattaches on the winglet surface, which results in local high HTC as shown in Figure 6. The height and length of the separation zone increases as the tip clearance increases. Inside the cavity, the flow entering from the pressure side rolls up to form the “Cavity Vortex”(CV), the size of which increases as the tip clearance increases. It is interesting to find that at the smallest tip clearance, the CV seems to be divided into two parts: the part near leading edge has a relatively larger size while the other is smaller and is confined to the pressure side squealer corner. It is the impingement of the CV that leads to the high HTC region “B” shown in Figure 6. The flow near the casing is strongly affected by the endwall motion and it rolls up to form the “Cavity Scraping Vortex”(CSV). On the contrary to the “CV,” the size of this vortex reduces as the tip clearance increases, which will be further discussed later.
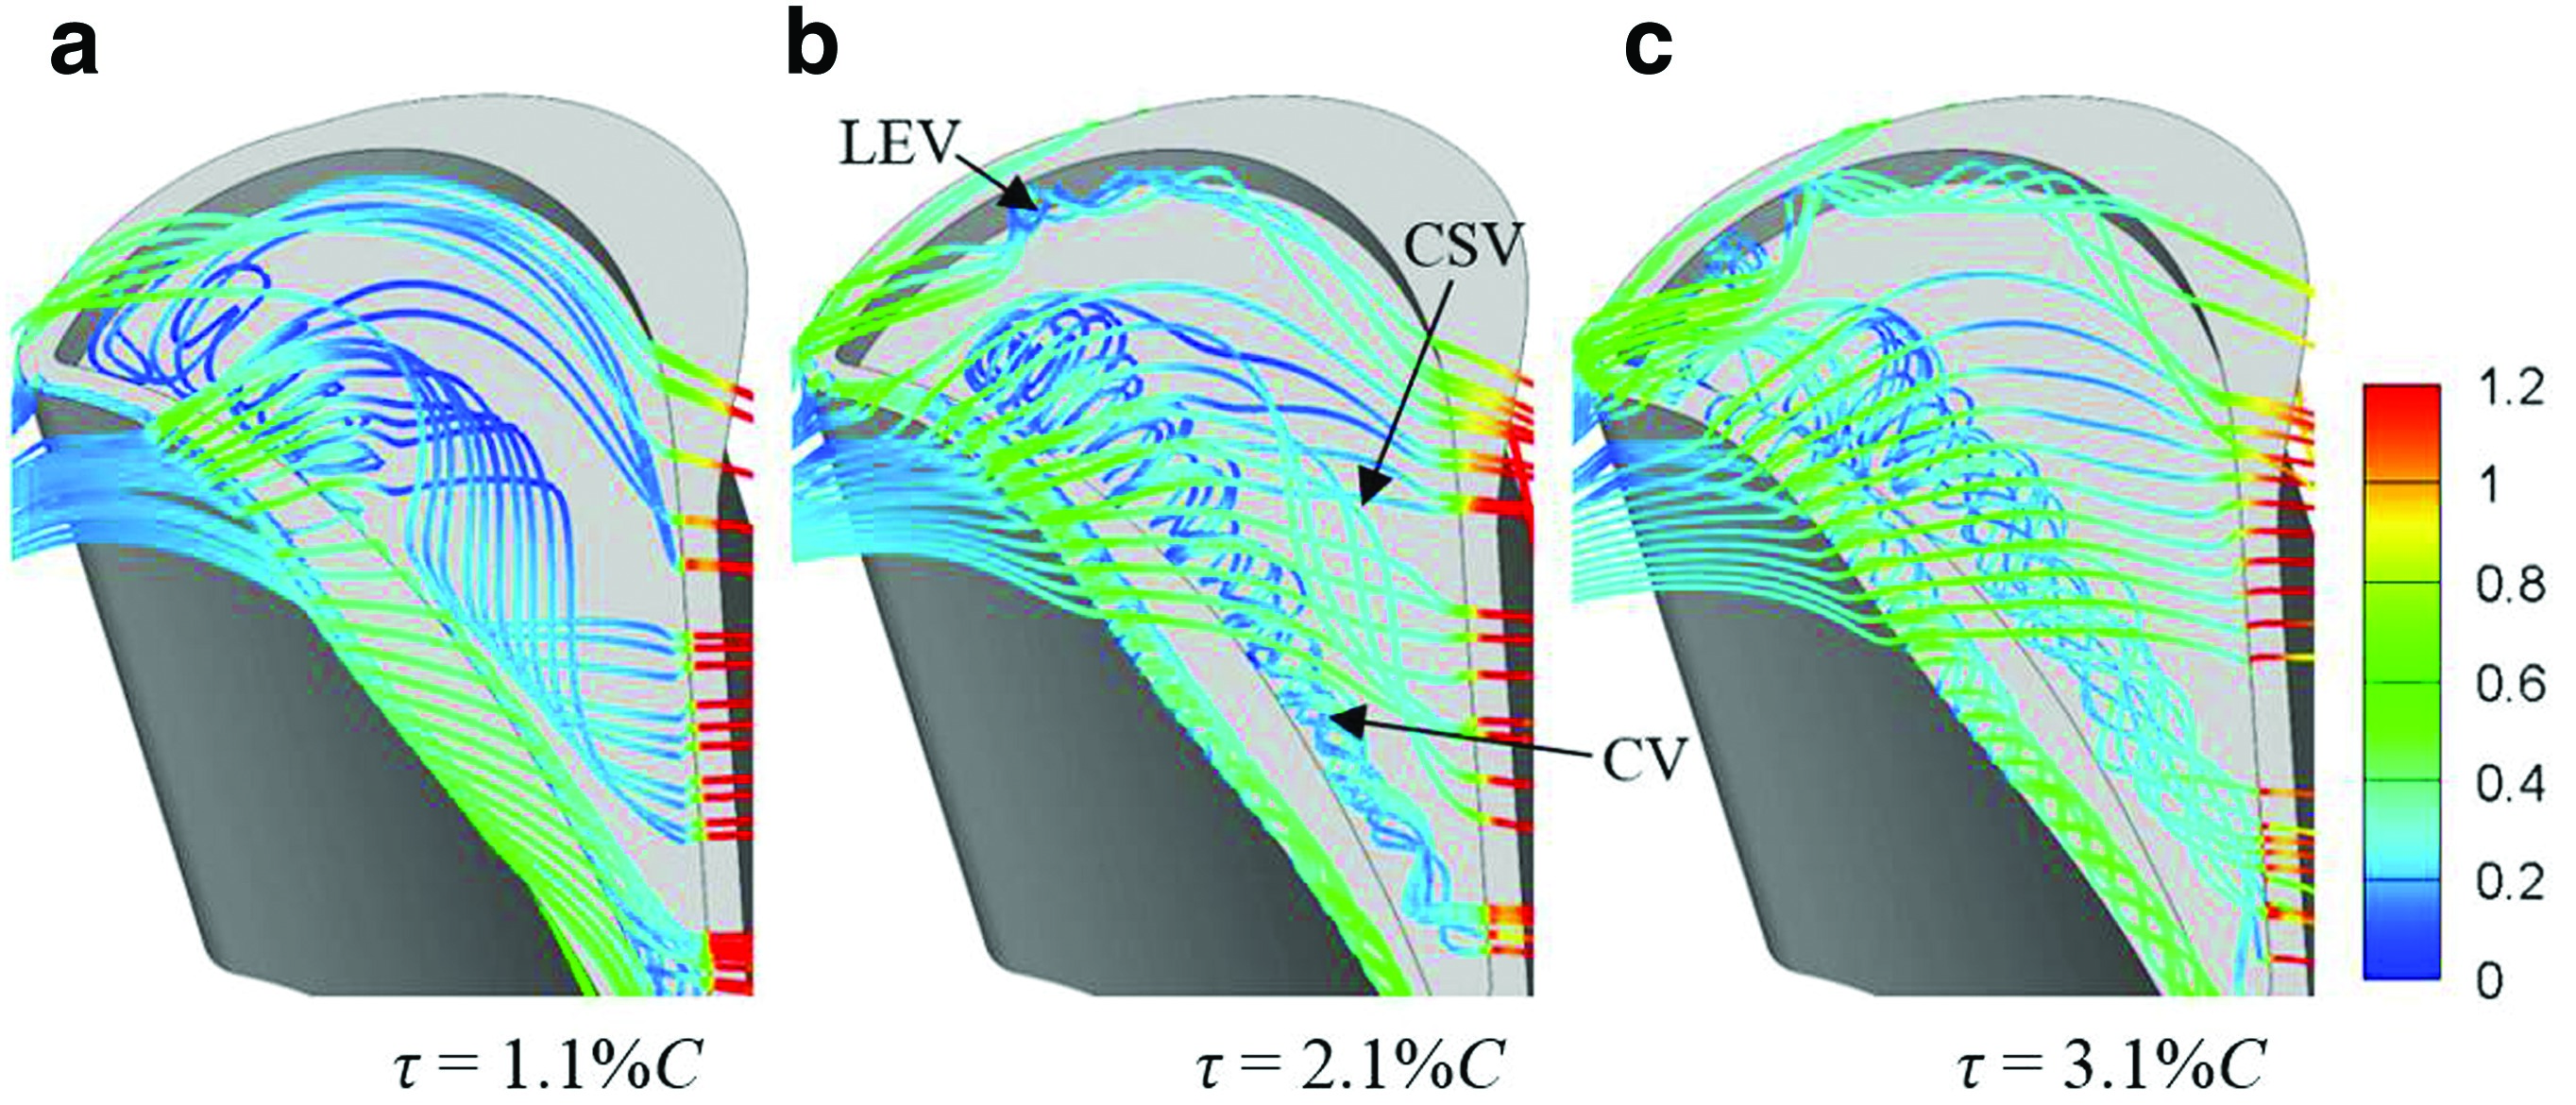
Figure 10 shows the Mach number contours along with two-dimensional streamlines on a cross section plane in the frontal blade passage of winglet tip “PSW.” As the tip clearance increases, the size of both the separation bubble above the pressure side winglet and suction side winglet becomes larger. Note that the flow hardly reattaches on the top of the pressure side winglet at the largest tip clearance. Above the cavity floor, the structures of the CV, the CSV and the LEV can be identified clearly. In Figure 10, “P1” indicates the impingement singularity point, and “P2” indicates the separation singularity point, at which the flow begins an upward motion and results in very low HTC in region “B” shown in Figure 6.
Figure 11 shows the Mach number contours along with two-dimensional streamlines on a cross section plane in the rear blade passage of winglet tip “PSW.” As tip clearance increases, the size of CV increases and the size of the CSV decreases. The CSV impinges on the cavity floor surface at tip clearance of 1.1%C and 2.1%C, causing high-HTC region “C” in Figure 6. At the smallest tip clearance of 1.1%C, the size of the CV on this plane is much smaller than that shown in Figure 10, which is consistent with that observed in Figure 9.
Figure 12 shows the wall shear stress and the limit streamline on the cavity floor surface of winglet tip “PSW.” The distribution pattern of the wall shear stress is consistent with the HTC distribution pattern shown in Figure 6. The red dashed line indicates the impingement singularity (“P1” in Figure 10 and the white dashed line indicates the separation singularity (“P2” in Figure 10. With a larger tip clearance, the wall shear stress near the blade leading edge is bigger, which reveals a stronger impingement effect in this region and hence higher HTC. At τ = 3.1%C, the high-HTC region “C” shown in Figure 6 is located below the red dashed line, which indicates that the high HTC here is mainly caused by the impingement of the CV. However, for tip clearance of 1.1%C and 2.1%C, part of the high HTC region “C” is located above the red dashed line, indicating that CSV is partly responsible for the high HTC on the cavity floor. This has been proven by Figure 11, which shows that the CSV is very close to the cavity floor surface and the impingement effect is significant at these two tip clearances. The white dashed line in the low wall shear stress region shows that the low HTC on the cavity floor is mainly caused by the flow upward motion induced by the CSV.
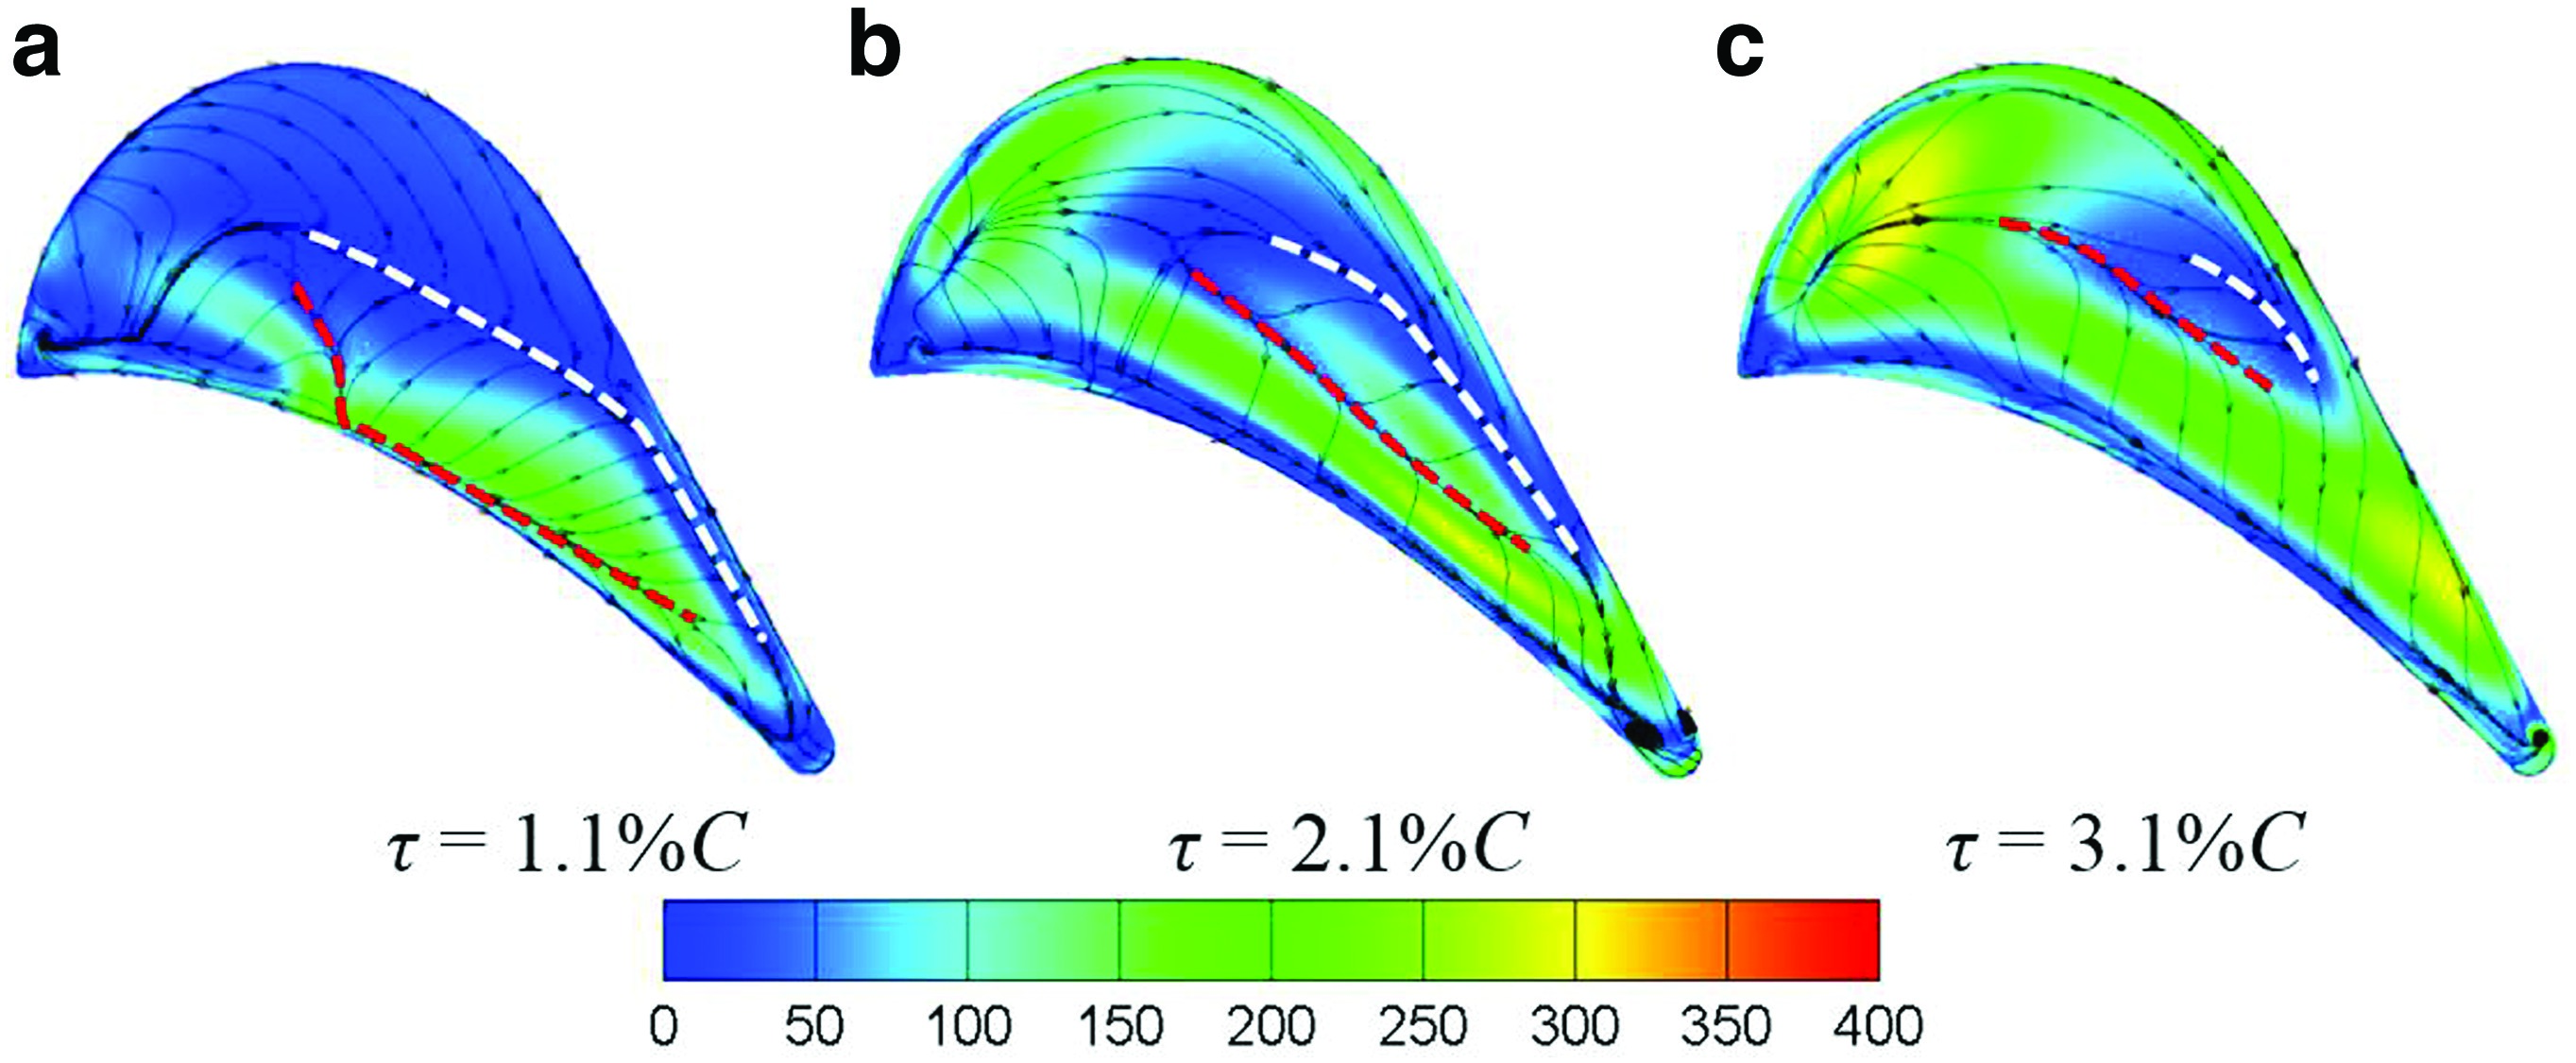
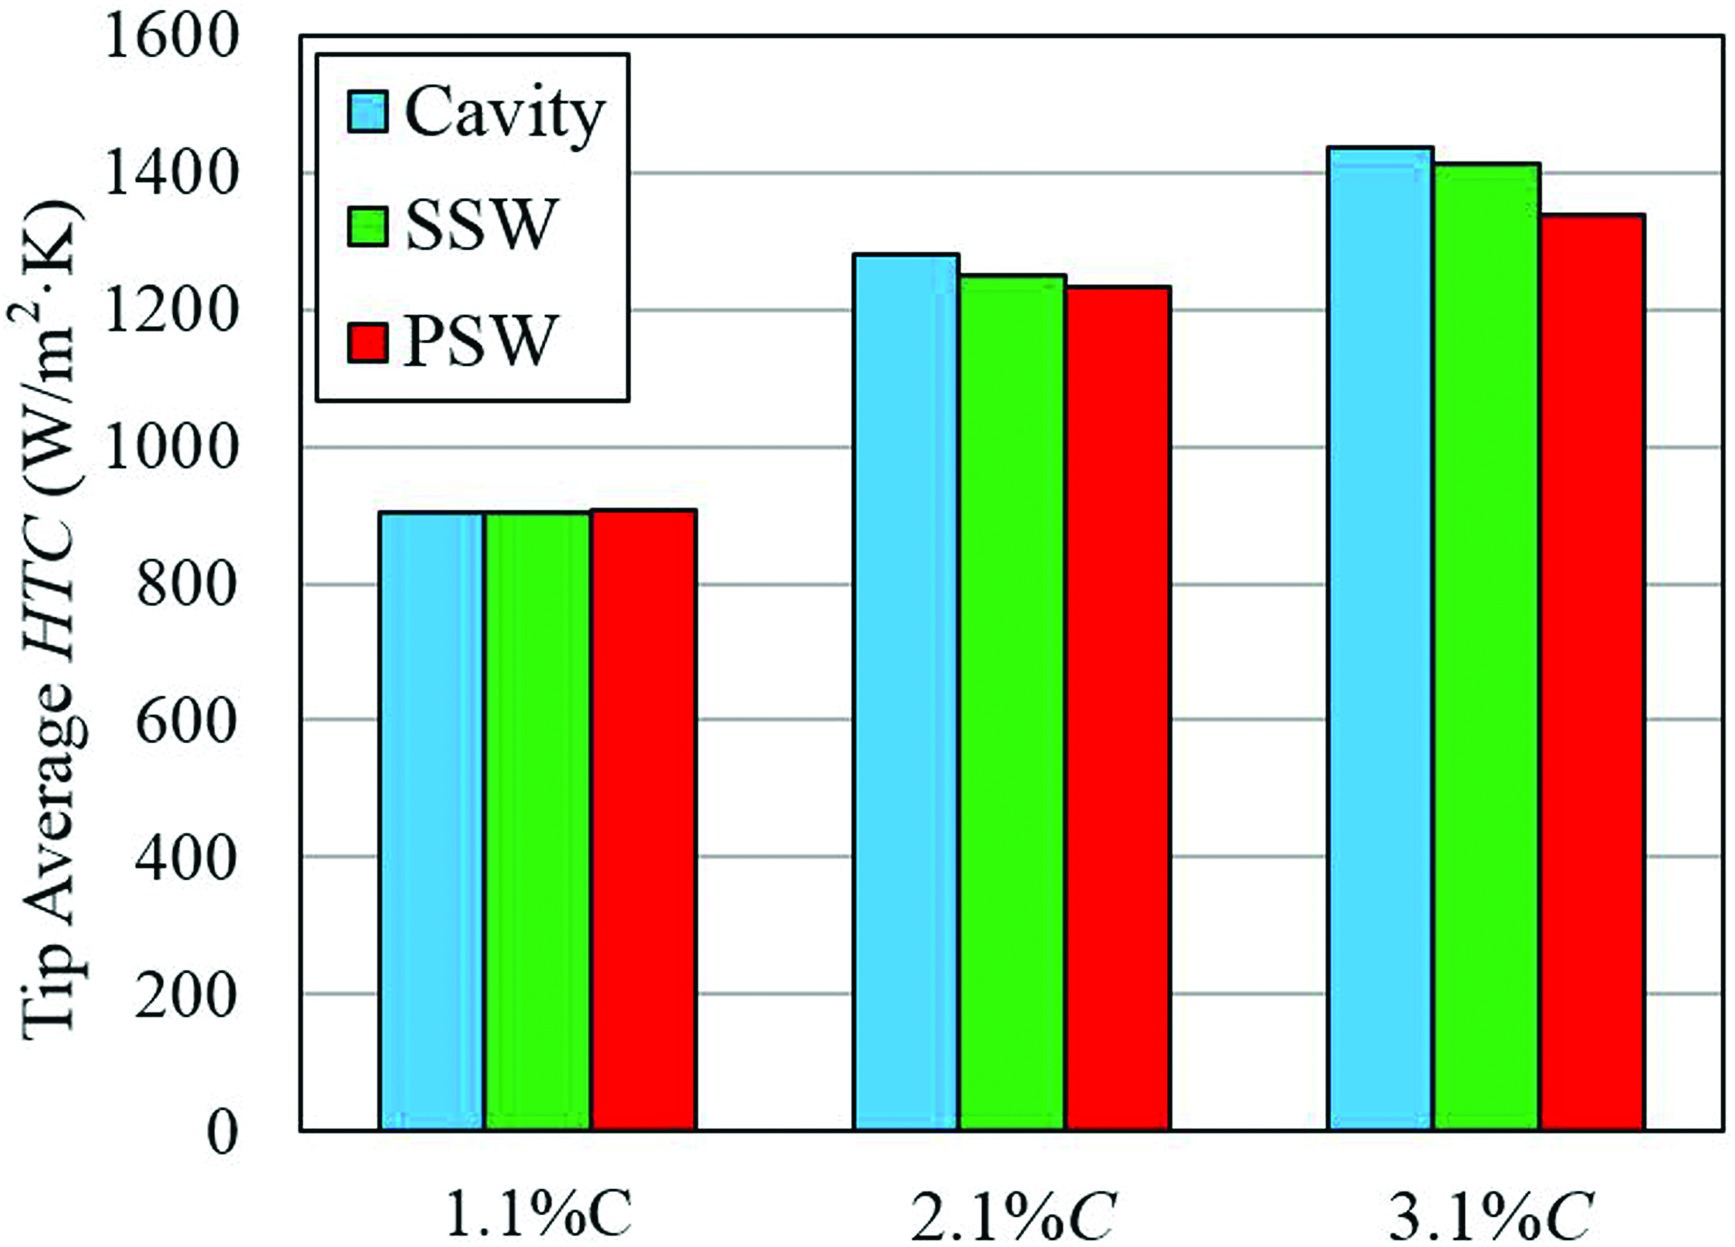
Figure 13 shows the area-weighted average HTC on the blade tip of all tips. In general, the average HTC increases with the tip clearance. At the smallest tip clearance of 1.1%C, the difference between the average HTC of all tips is negligible. Compared with the cavity tip, the winglet tip “SSW” reduces the average HTC by 2.2% and 1.7% for τ = 2.1%C and τ = 3.1%C respectively, and the corresponding decrement of winglet tip “PSW” is 3.7 and 6.7%.
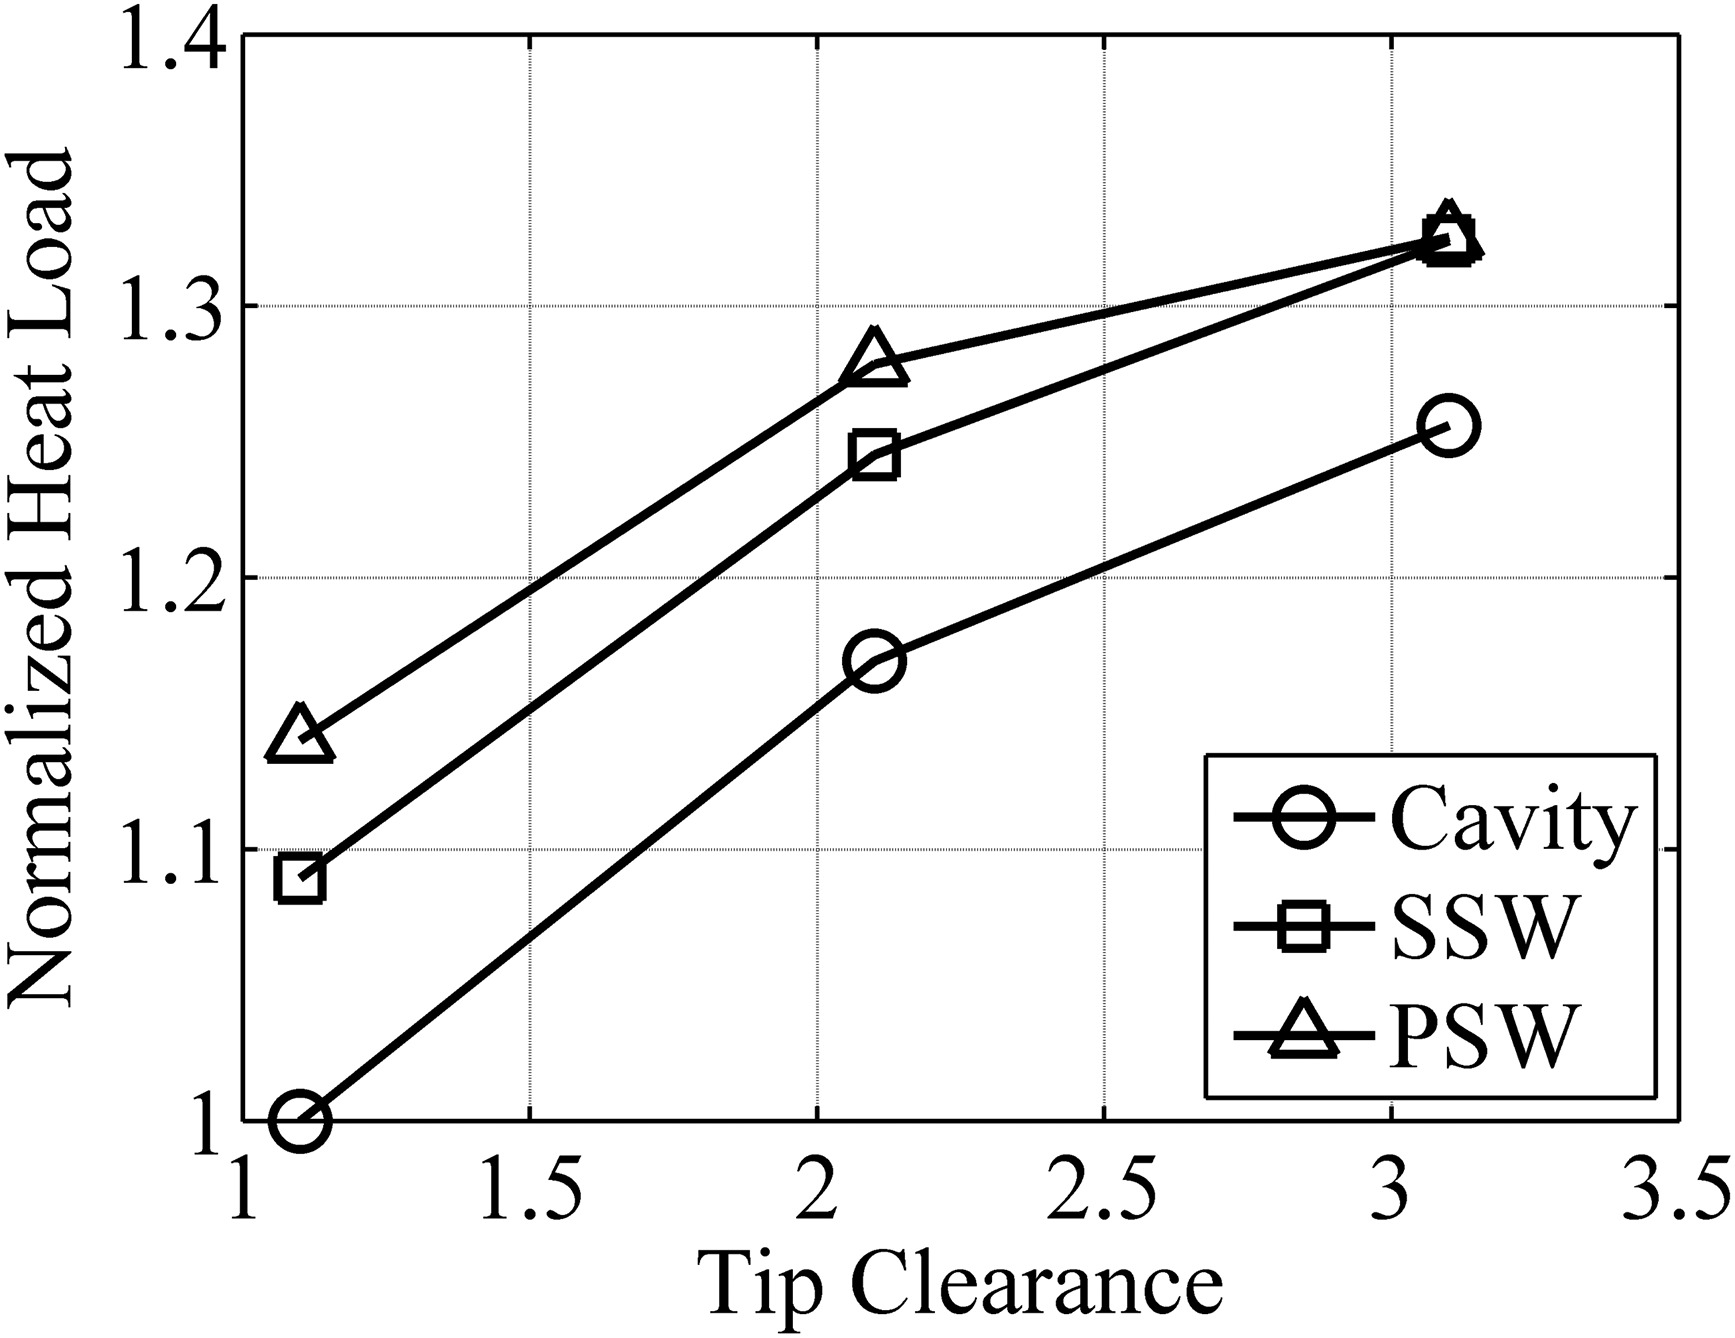
The heat load Q is another important parameter for heat transfer study. It is defined as follows:
where q is the local heat flux in the small area dA. For a blade tip, a higher heat load requires a larger mass of the coolant flow, which may reduce the engine performance. Figure 14 shows the total heat load on the tip surface at three tip clearances. The heat load is normalized by the total tip heat load of cavity tip at the smallest tip clearance of 1.1%C. For all tips, the total tip heat load increases with the tip clearance. The winglet tip “PSW” has the largest heat load because it has the largest tip surface area. At the largest tip clearance, the heat load of winglet tip “PSW” and “SSW” is nearly the same.
Blade suction side heat transfer results
Figure 15 shows the HTC distribution on the blade suction side surface for all tips at different tip clearances. A high-HTC strip (indicated by “A” in Figure 15 appears near the tip region. Specifically, the HTC is quite high on the side surface of the suction side winglet (indicated by “B” in Figure 15.
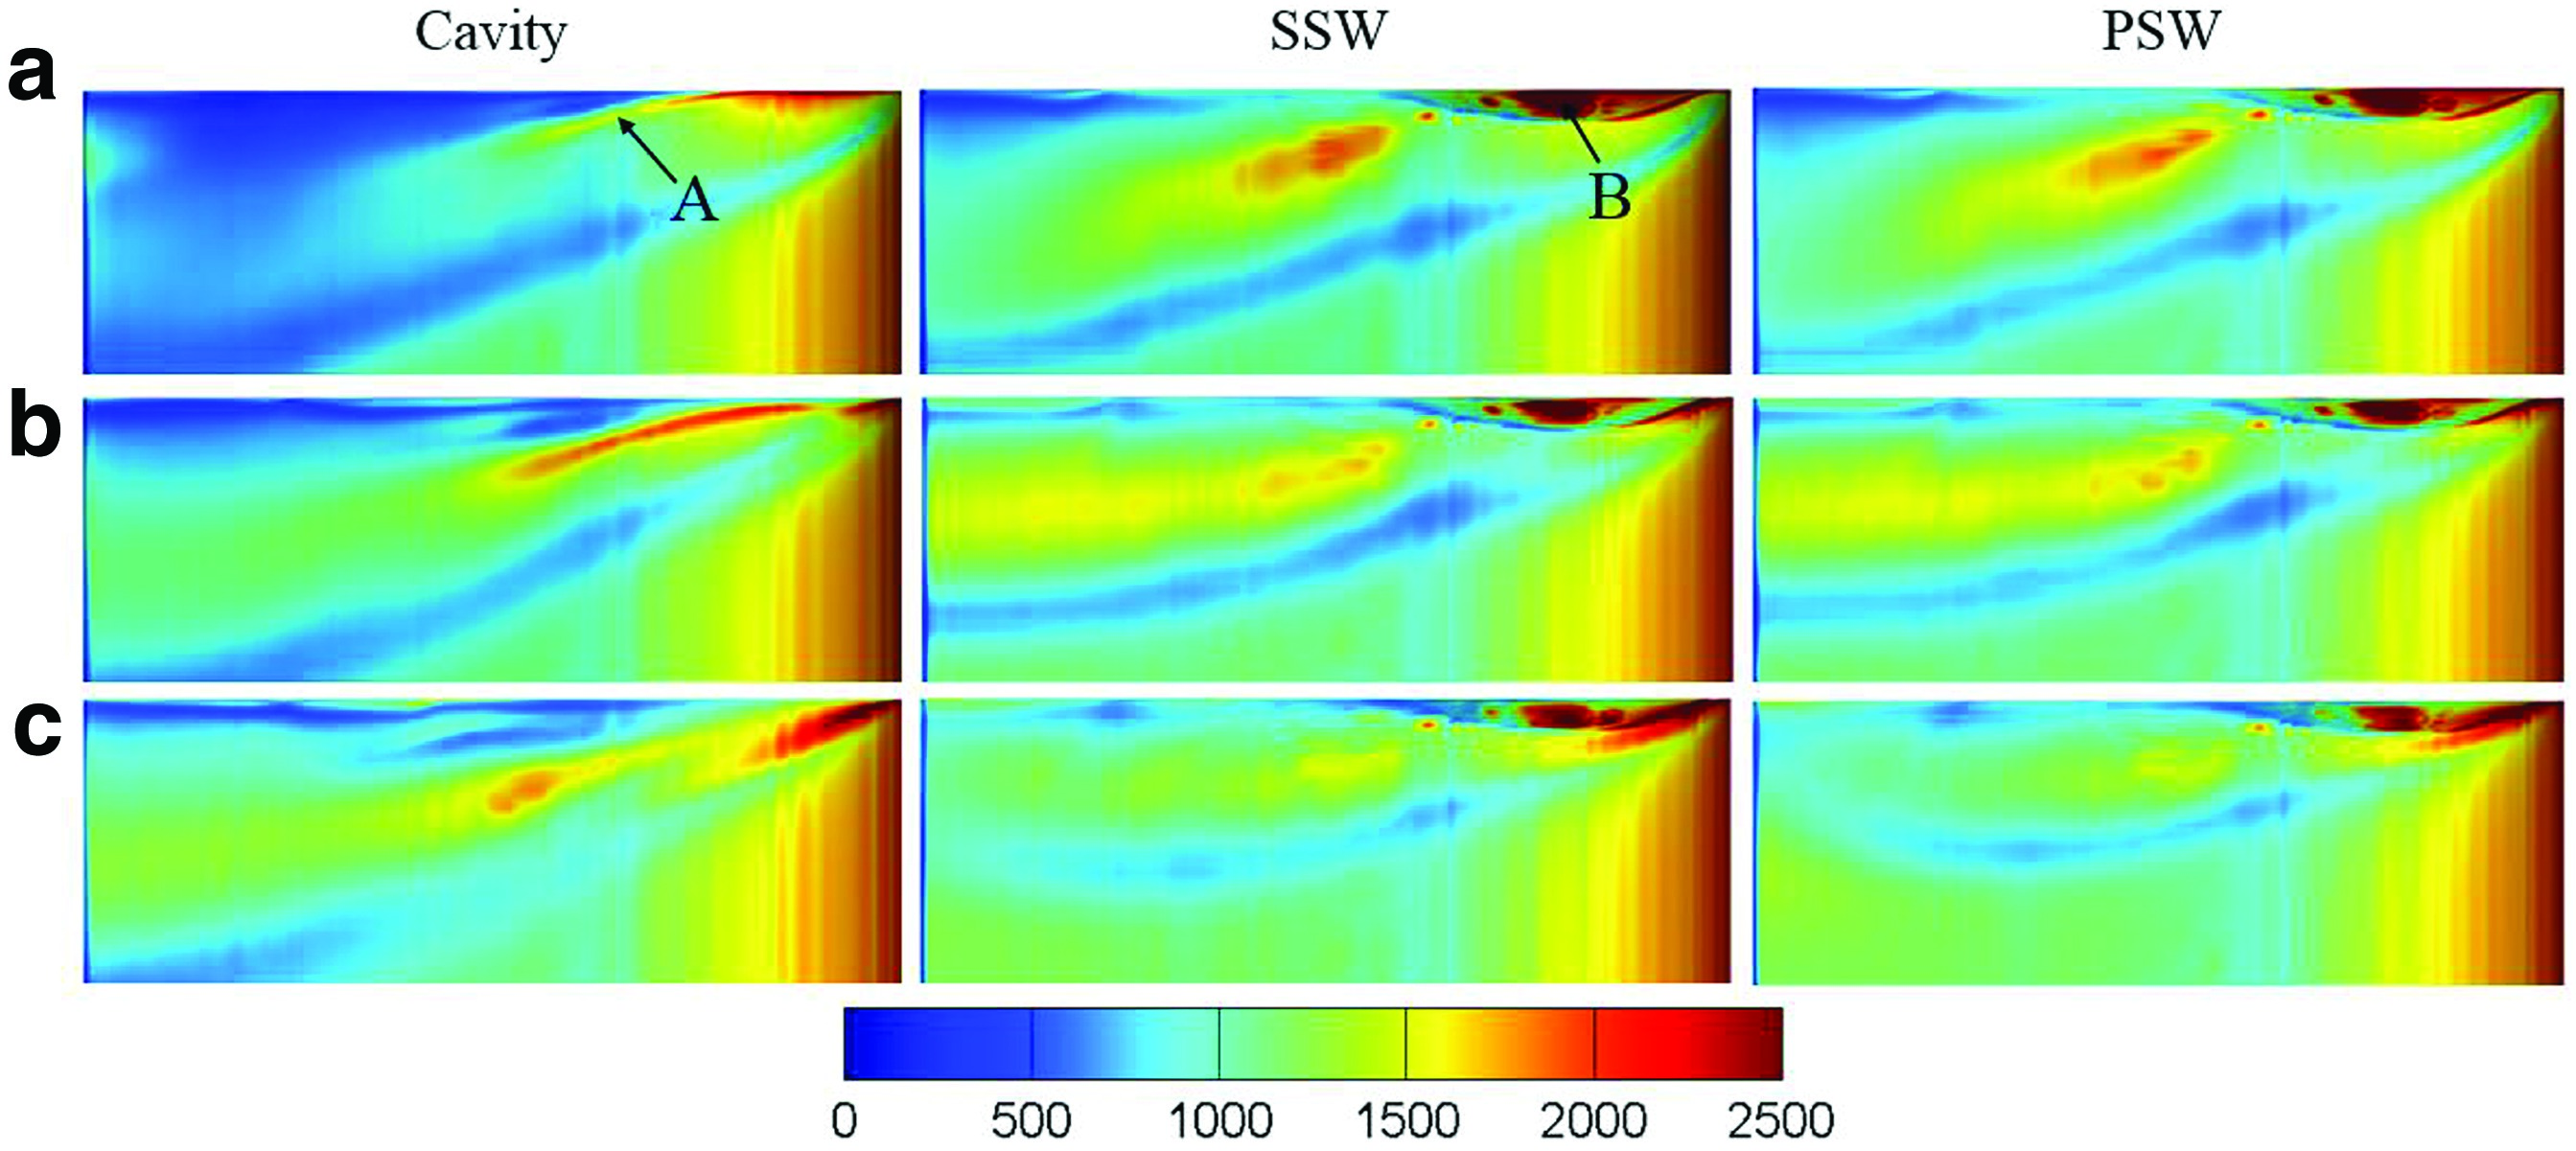
Figure 16 shows the total pressure loss coefficient and velocity vector on the same plane as Figure 10 of cavity tip and winglet tip “SSW.” For both tips, after the tip leakage flow discharges from the tip gap, it interacts with the main flow and rolls up to form the tip leakage vortex. The flow deflects its direction and has an impingement effect on the side surface of the blade, which causes the high HTC in area “B” shown in Figure 15. There is little difference between the HTC distributions of the two winglet tips, as the pressure side winglet has little effect on the tip leakage vortex structure. The interesting thing is that the HTC in region “A” generally increases with the tip clearance for the cavity tip, but it decreases with tip clearance for the two winglet tips. Why is this the case?
Figure 16.
Total pressure loss coefficient and velocity vector on the same plane as shown in Figure 10 of cavity tip and winglet tip “SSW.”

Figure 17 shows the total pressure loss coefficient on a cut plane normal to blade suction side edge of cavity tip and winglet tip “SSW.” For both tips, the size of tip leakage vortex increases as the tip clearance increases. For the cavity tip, the tip leakage vortex attaches on the blade surface and the distance between the vortex core and the blade wall changes little at all tip clearances. So the HTC on the blade wall increases mainly because more fluid impinges on the wall at a larger tip clearance. However, for winglet tip “SSW,” the tip leakage vortex becomes further away from the blade wall as the tip clearance increases, which reduces the impingement effect of the vortex. This is why the HTC on the blade wall decreases with the tip clearance. In addition, it is very interesting to find that the total pressure loss coefficient in the tip leakage vortex region is reduced by such a small suction side winglet, and the passage vortex is also suppressed at all tip clearances.
Figure 17.
Total pressure loss coefficient on a cut plane normal to blade suction side of cavity tip and winglet tip “SSW.”
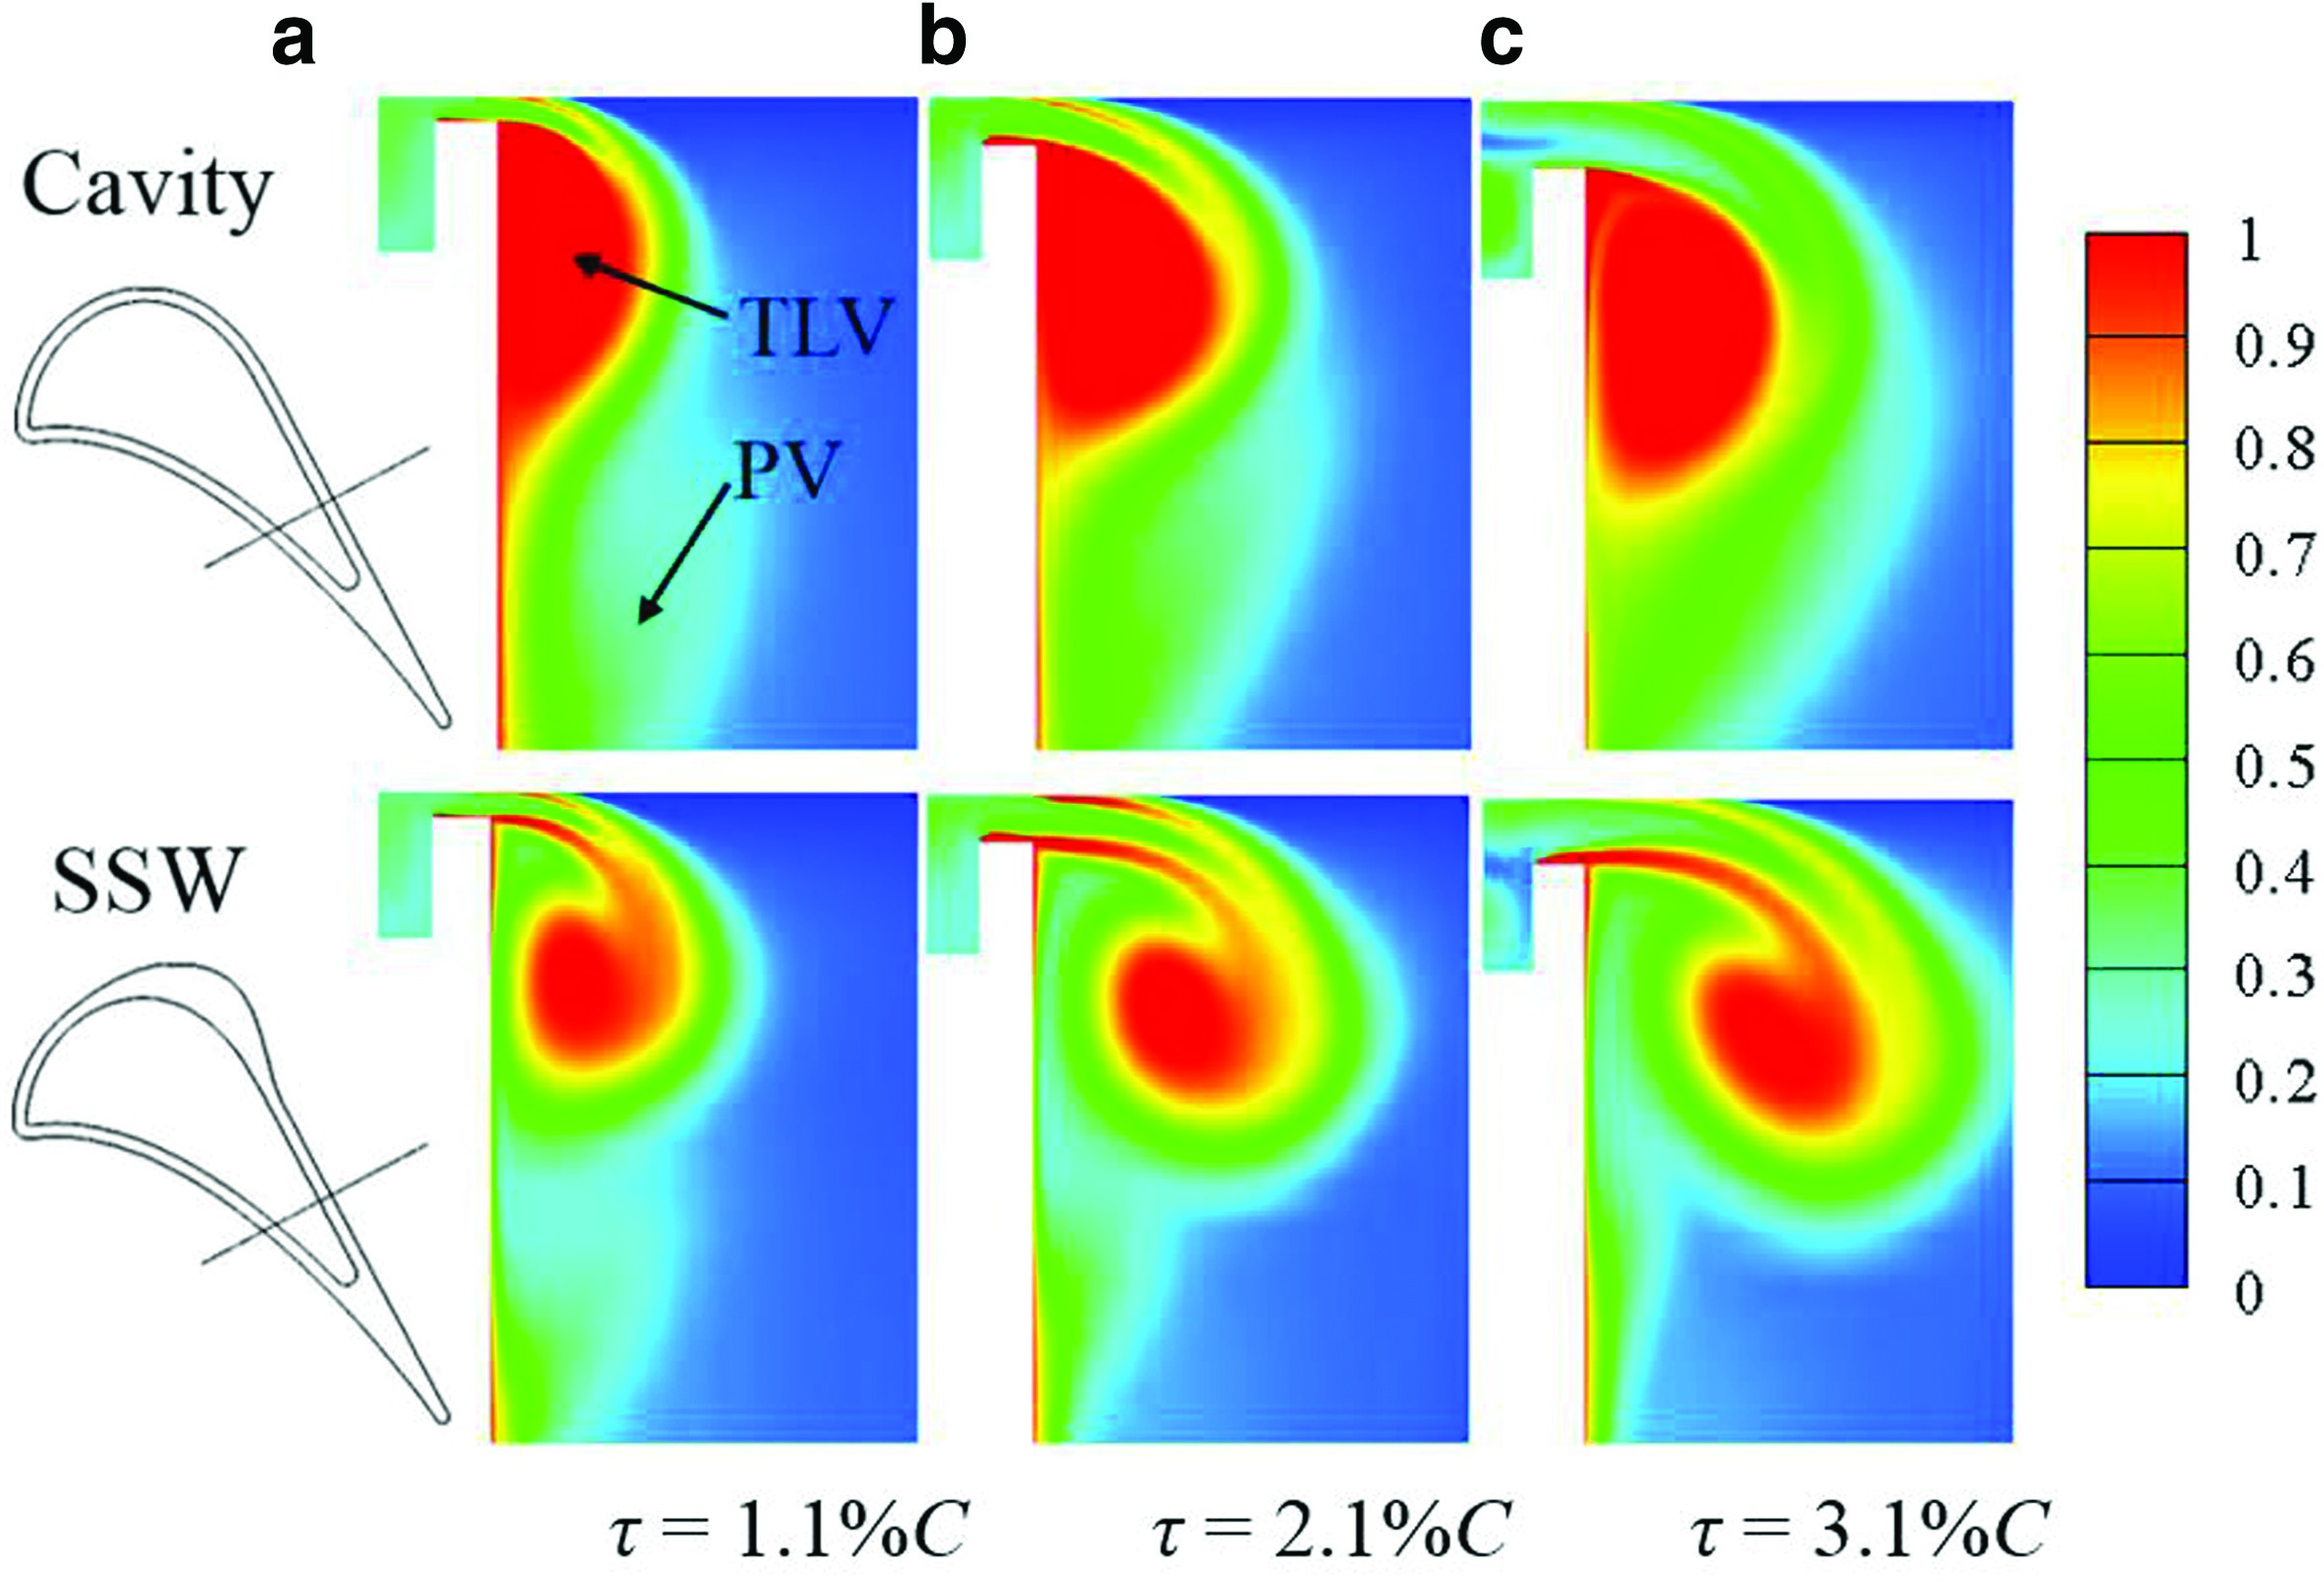
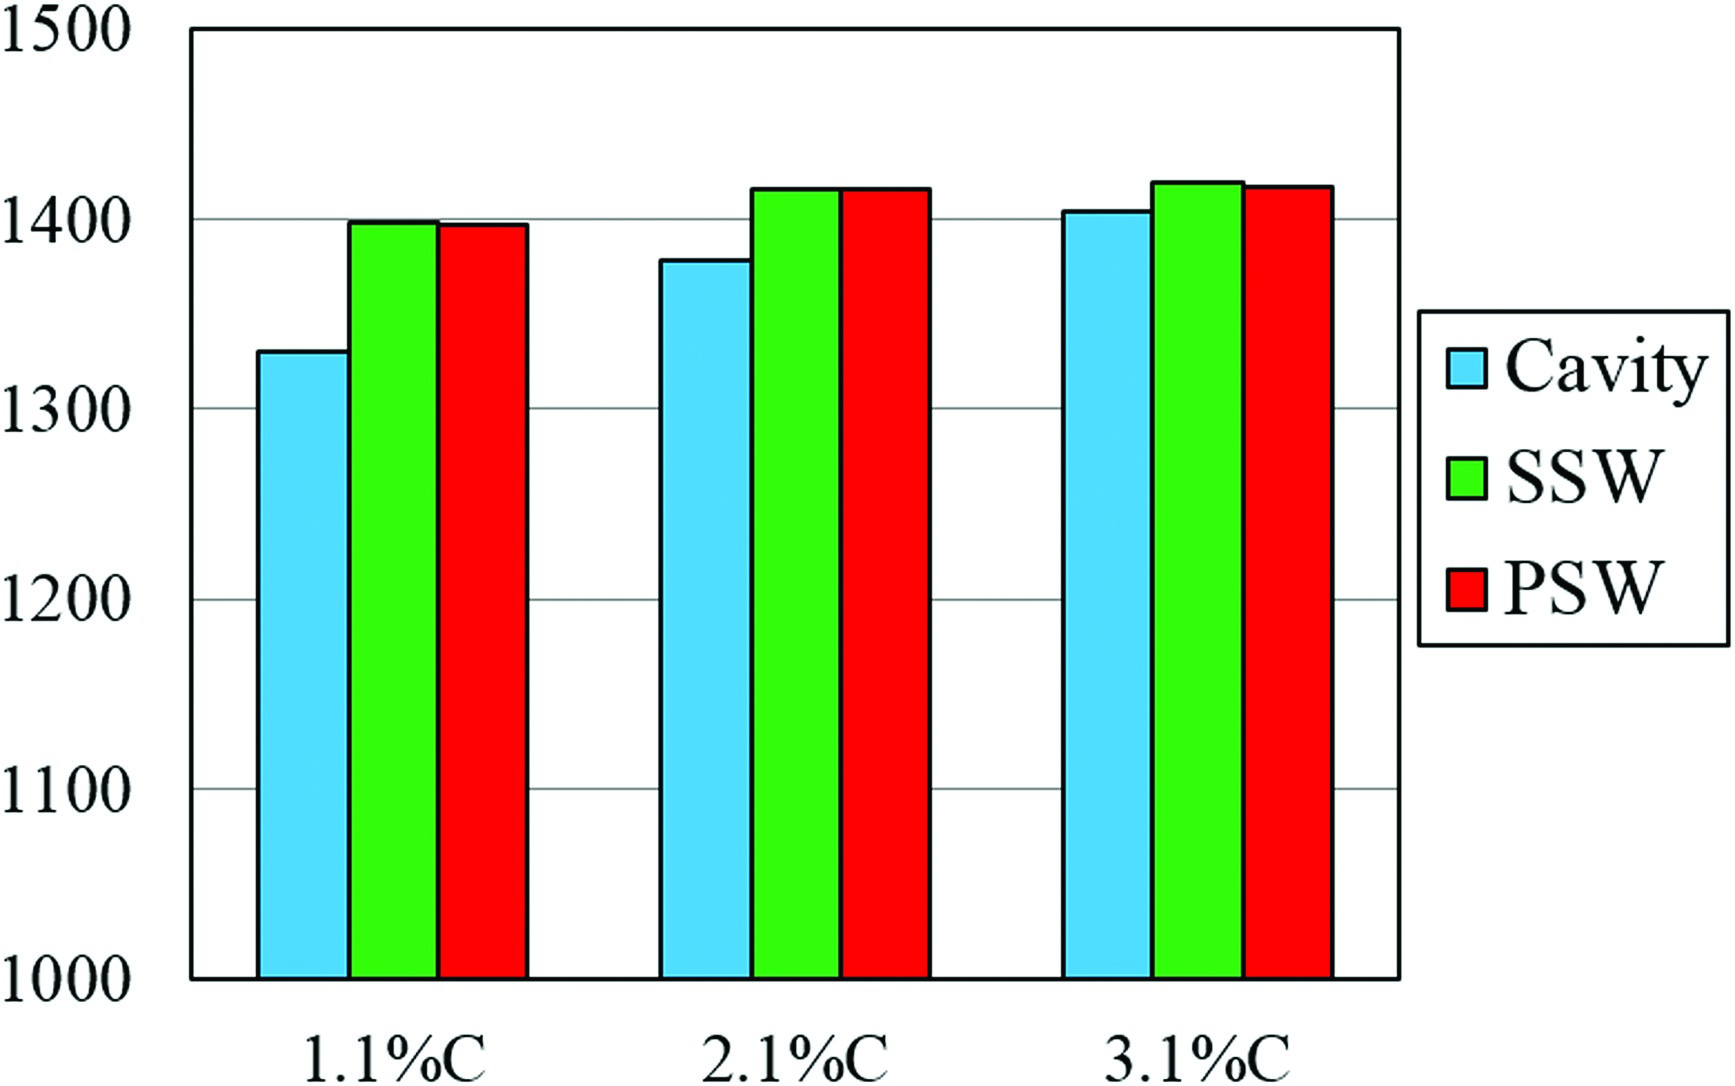
Figure 18 shows the area-weighted average HTC on the blade suction side surface of all tips. The average HTC of the cavity tip increases with the tip clearance and is the lowest at all tip clearances. There is little difference between the two winglet tips, indicating that the pressure side winglet has little effect on the tip leakage vortex structure in this study. Compared with the cavity tip, the two winglets increase the average HTC by 5.0, 2.7 and 0.9% at tip clearance of 1.1%C, 2.1%C and 3.1%C respectively.
Conclusions
This paper investigates the thermal performance of two cavity-winglet tips with endwall motion under transonic conditions at three tip clearances of 1.1, 2.1 and 3.1% chord. The conclusions can be drawn as follows:
1. The effects of tip gap size on the thermal performance of cavity-winglet tips are significant. The average tip HTC and total tip heat load increase as the size of the tip gap increases.
2. The HTC on inner vertical squealer surface generally increases with the tip clearance because the flow velocity inside the cavity near the vertical squealer increases with the tip clearance.
3. With a pressure side winglet, the tip leakage flow reattaches on the top surface of the winglet after the separation from the pressure side edge, which results in high HTC. The size of the separation bubble over the pressure side winglet increases with the tip clearance.
4. Inside the cavity, as the tip clearance increases, the size of the CV increases, resulting in higher heat transfer. The CSV becomes smaller and lifts off from the cavity floor surface, which reduces the area of the low HTC region on the cavity floor. The CSV also increases the HTC on the cavity floor at tip clearance of 1.1%C and 2.1%C because it is very close to the floor surface and its impingement effect is evident.
5. The HTC in the near-tip region on the blade suction side wall of the two winglet tips decreases with the tip clearance, showing opposite trend to that of the cavity tip. This is because the tip leakage vortex of the two winglet tips locates further away from the blade wall as the tip clearance increases, reducing the impingement effect of the tip leakage vortex.
6. The HTC is high on the side surface of the suction side winglet at all tip clearances because of the tip leakage flow impingement.