
Introduction
Gas turbine combined cycle (GTCC) power plant is the most efficient and least-polluting fossil fuel-based electric power generation technology. Largely driven by turbine inlet temperature (TIT) and pressure ratio, the Brayton cycle based “J class” heavy-duty industrial gas turbines with more than 40% net thermal efficiency have been the foundation of combined cycle power plants with field-proven 60+% net thermal efficiency. Nevertheless, published ratings and field performances show that the 30+ years old steady gain in performance is rapidly approaching a plateau (Gülen, 2016, 2017). Present state-of-the-art is 1,600°C TIT with cycle pressure ratio of ~23. The enabling technologies are advanced hot gas path (HGP) materials (superalloys), thermal barrier coatings (TBC), film cooling techniques and 3D-aero design software. The next class of machines (say, “K class” for the purpose of discussion) are targeting 1,700°C TIT, which is putting a big onus on Dry-Low-NOx (DLN) combustor technology, superalloy capabilities and HGP parts manufacturability for commensurate film cooling effectiveness. Additive manufacturing (commonly known as “3D Printing”) and ceramic matrix composite (CMC) materials are two promising technologies to facilitate successful deployment of the K class in the next decade or so.
An alternative to the “brute force” approach of ever-increasing hot gas temperatures is fixing the fundamental deficiency of the Brayton cycle, namely, reduction of the cycle heat addition irreversibility. (The other big Brayton cycle deficiency, cycle heat rejection irreversibility, is taken care of very successfully by the steam Rankine “bottoming cycle.”) There are two textbook methods to achieve this end: (i) multiple heat addition steps in series and (ii) constant volume heat addition. The former is deployed in commercially available units (i.e., GT 24/26 gas turbines with “sequential” or reheat combustion). The latter, which is the subject of this article, has been on the draft-board for more than half century for aircraft propulsion, i.e., pulsed detonation combustion, PDC 12. The generic name for the practical devices approximating constant volume heat addition is “pressure gain combustor.” The closest practical implementation of the process is the explosive combustion inside the cylinder of a reciprocating internal combustion engine (ICE).
The tremendous performance improvement potential of PGC within the context of land-based gas turbines for electric power generation is investigated herein. Fundamental considerations and detailed heat and mass balances show that 65+% net thermal efficiency is readily achievable with TITs well below that of today’s J class units. (The reader is advised to read the Nomenclature section on page 6 before continuing to the main body of the article.)
Thermodynamics
The easiest way to demonstrate the performance difference between constant pressure and constant volume is using an air-standard cycle approach in combination with “mean-effective temperature” analysis. The Brayton cycle (constant pressure heat addition [CPHA]) with standard state-point numbering is shown in Figure 1.
Figure 1.
Brayton cycle (heat addition, dP = 0); cycle heat input is represented by the second T ds equation.
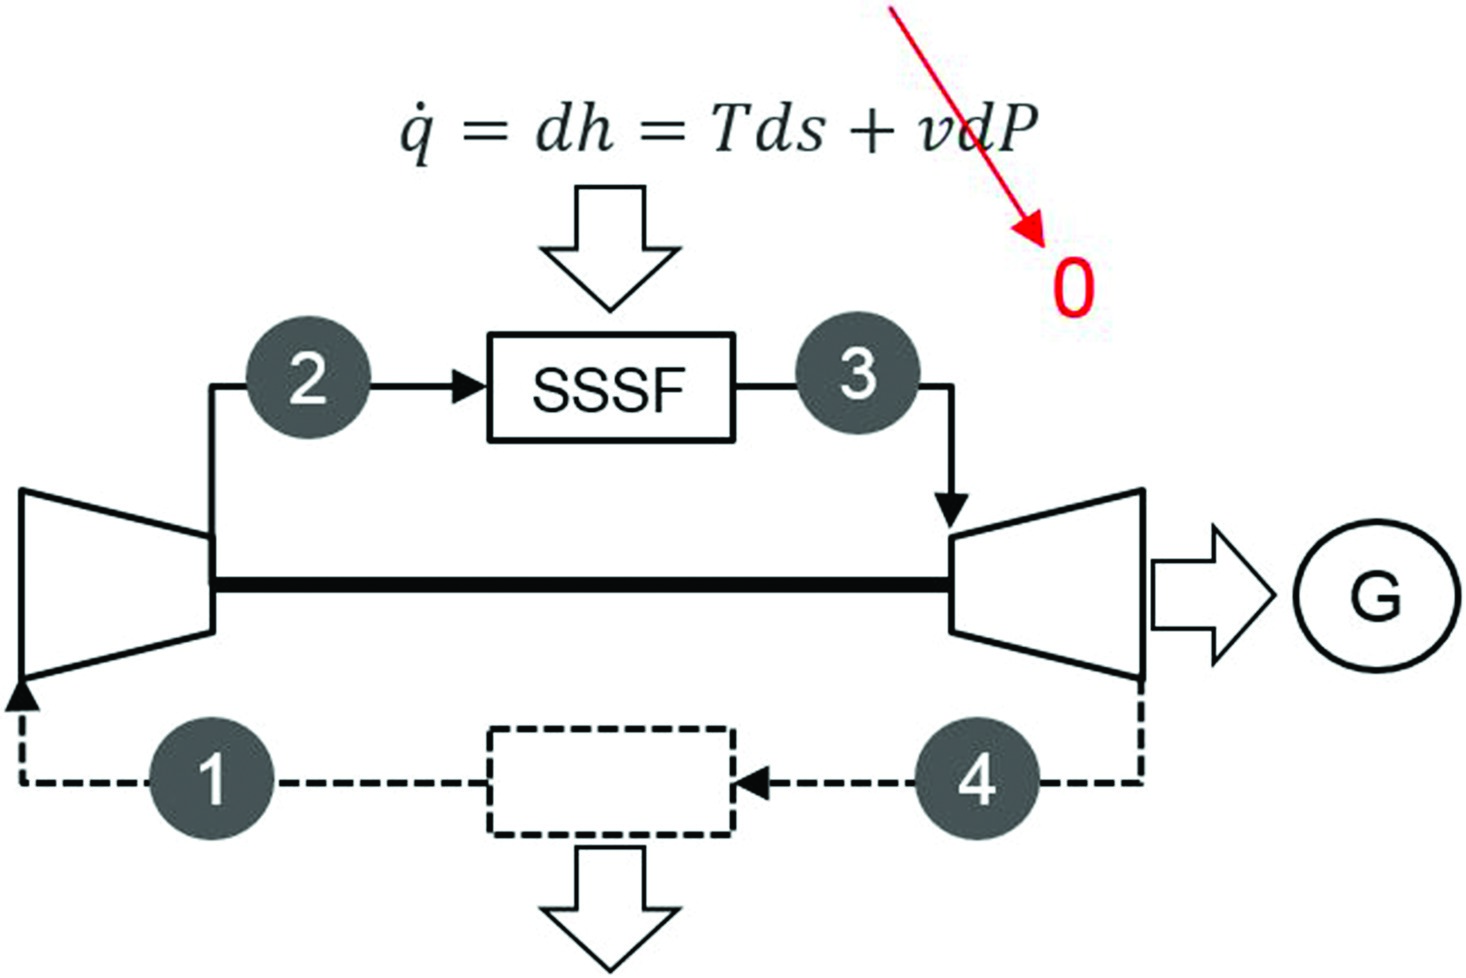
All four processes in this cycle, including heat addition, which is represented by the differential form of the first law, are steady-state, steady-flow (SSSF) — as appropriate for a turbomachine. This is why the Brayton cycle is an ideal “proxy” for a gas turbine.
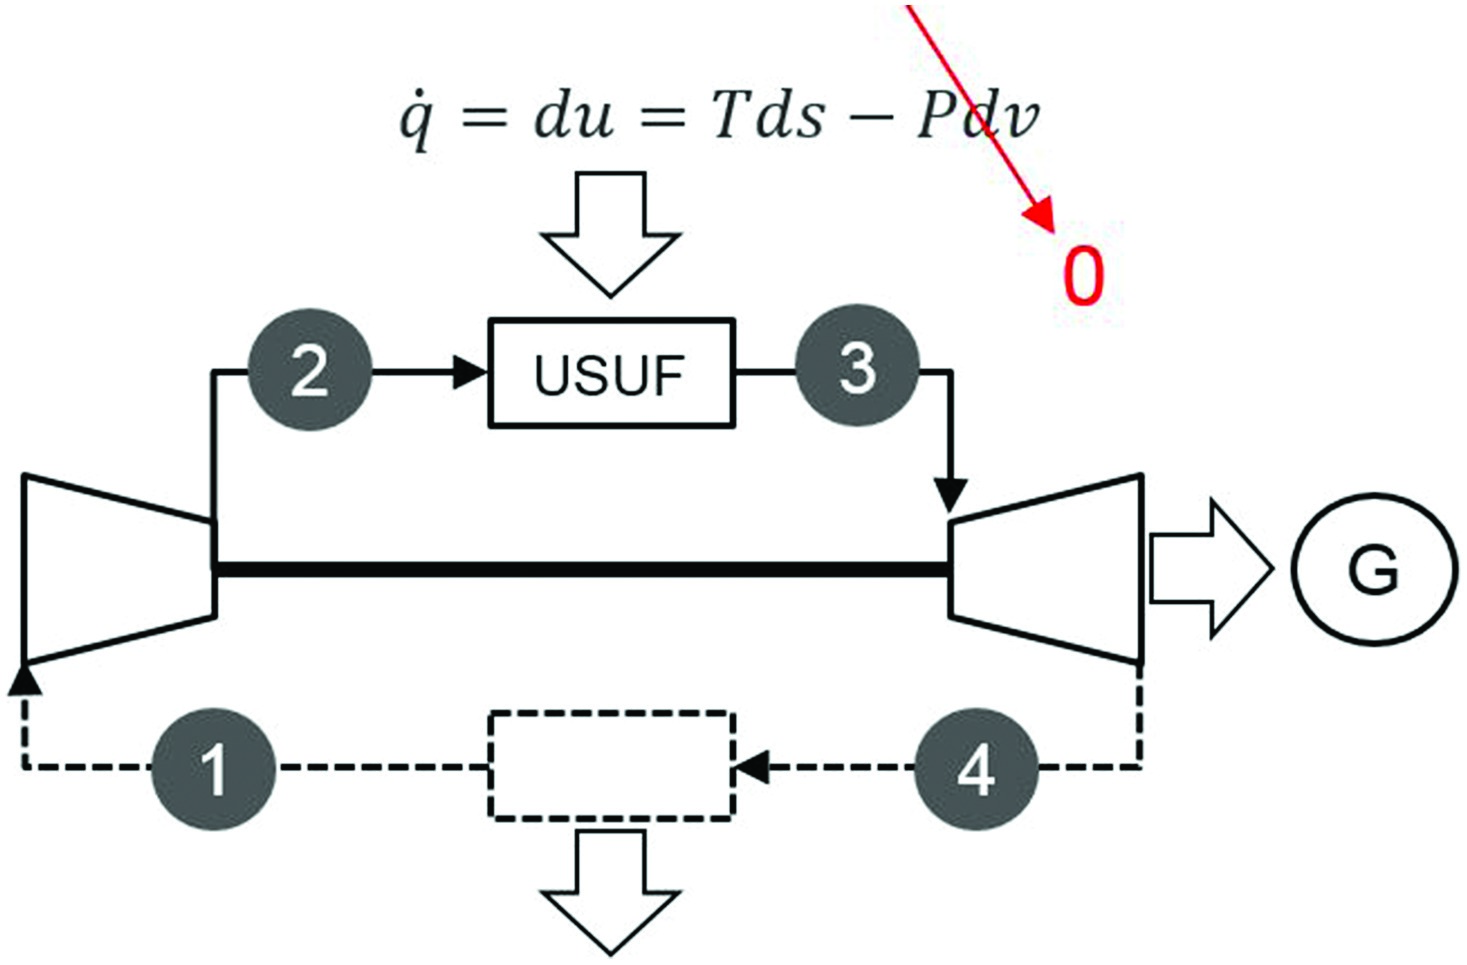
The Atkinson cycle has a constant-volume heat addition step, which is a special case of the more general uniform-state, uniform-flow (USUF) process as shown in Figure 2. The Atkinson cycle can be considered as a proxy for Holzwarth’s “explosion turbine” 20. This cycle, under the name “Humphrey,” has been used as an ideal proxy for PDC-based pulsed detonation engines (PDE) 11.
Figure 2.
Atkinson (Humphrey) cycle (heat addition, dv = 0); cycle heat input is represented by the first T ds equation.
It was shown in an earlier article 04 that the “correct” ideal proxy for a perfect turbomachine like a gas turbine should have a SSSF constant volume heat addition (CVHA) process (see Figure 3). The cycle was referred to by the author as Reynst-Gülen (R-G) cycle since so far no published reference has been found with its definition.
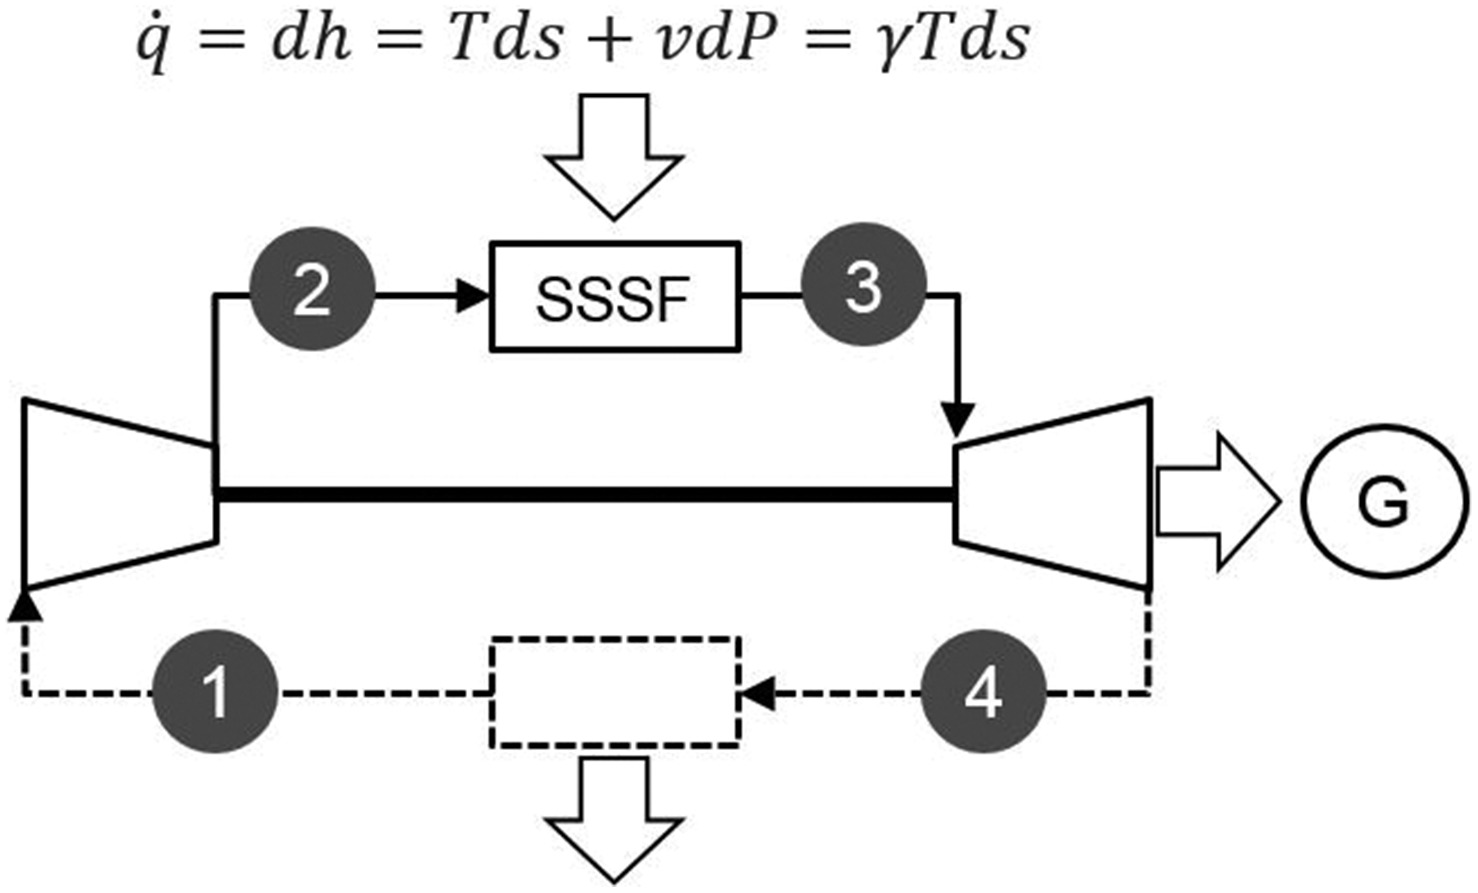
It can be shown via rigorous thermodynamic analysis that for the same precompression pressure ratio (PR), P2/P1, and TIT, T3, the R-G cycle is more efficient than the Atkinson cycle because it has a higher mean-effective heat addition temperature (METH). (See 19 for definition and calculation of mean-effective temperatures.) In comparison, the METH for the Atkinson cycle is the same as the Brayton cycle with the same cycle PR as Atkinson precompression PR and the same TIT. The cycle efficiency benefit for the Atkinson cycle is due to its much lower mean-effective heat rejection temperature (METL) vis-à-vis the Brayton cycle due to increased overall cycle PR. Thus, for a combined cycle where the ideal METL is the same as the ambient temperature, Atkinson (Humphrey) cycle has no benefit over the comparable Brayton cycle.
For numerical comparison, a Brayton cycle with TIT of 2,372°F (1,300°C) and PR of 13 is selected. This is representative of an E class gas turbine, whose average simple and combine cycle ratings, 35.5% and 53.2%, respectively, are obtained from a trade publication 01. The Atkinson cycle is calculated for two different cases: (i) same TIT and (i) same cycle heat addition (at precompression PR of 13). The R-G cycle is also calculated for two cases: (i) same TIT as the E class and (ii) TIT of 2,700°F (1,482°C, about the same as advanced F class) and precompression PR of 10. The results are shown in Table 1.
Table 1.
Ideal, air-standard cycle calculations (R = 0.068 Btu/lb-R, cp = 0.24 Btu/lb-R, γ = 1.4).
The translation from the ideal proxy performance (subscript “id”) to the rating performance (subscript “rat”) is done via the “Carnot Factor” (CF). Note that the air-standard cycle efficiency calculated as
is the efficiency of the “Carnot-equivalent” cycle with isentropic compression/expansion and isothermal heat transfer at METL and at METH. The proximity of the actual (rating) efficiency to the ideal, expressed as a fraction, i.e., CF, is a very good measure of the technology state-of-the-art. For state-of-the-art F, G, H and J class gas turbines, using an ideal cycle basis (but not air-standard), 0.75 and 0.81 are very reliable average CF values for simple and combined cycle, respectively (Gülen, 2013). On an air-standard cycle basis, 0.68 is a good CF value for simple cycle whereas 0.75–0.82 is a good range for TIT of 1,300–1,600°C on ideal (but not air-standard) basis.
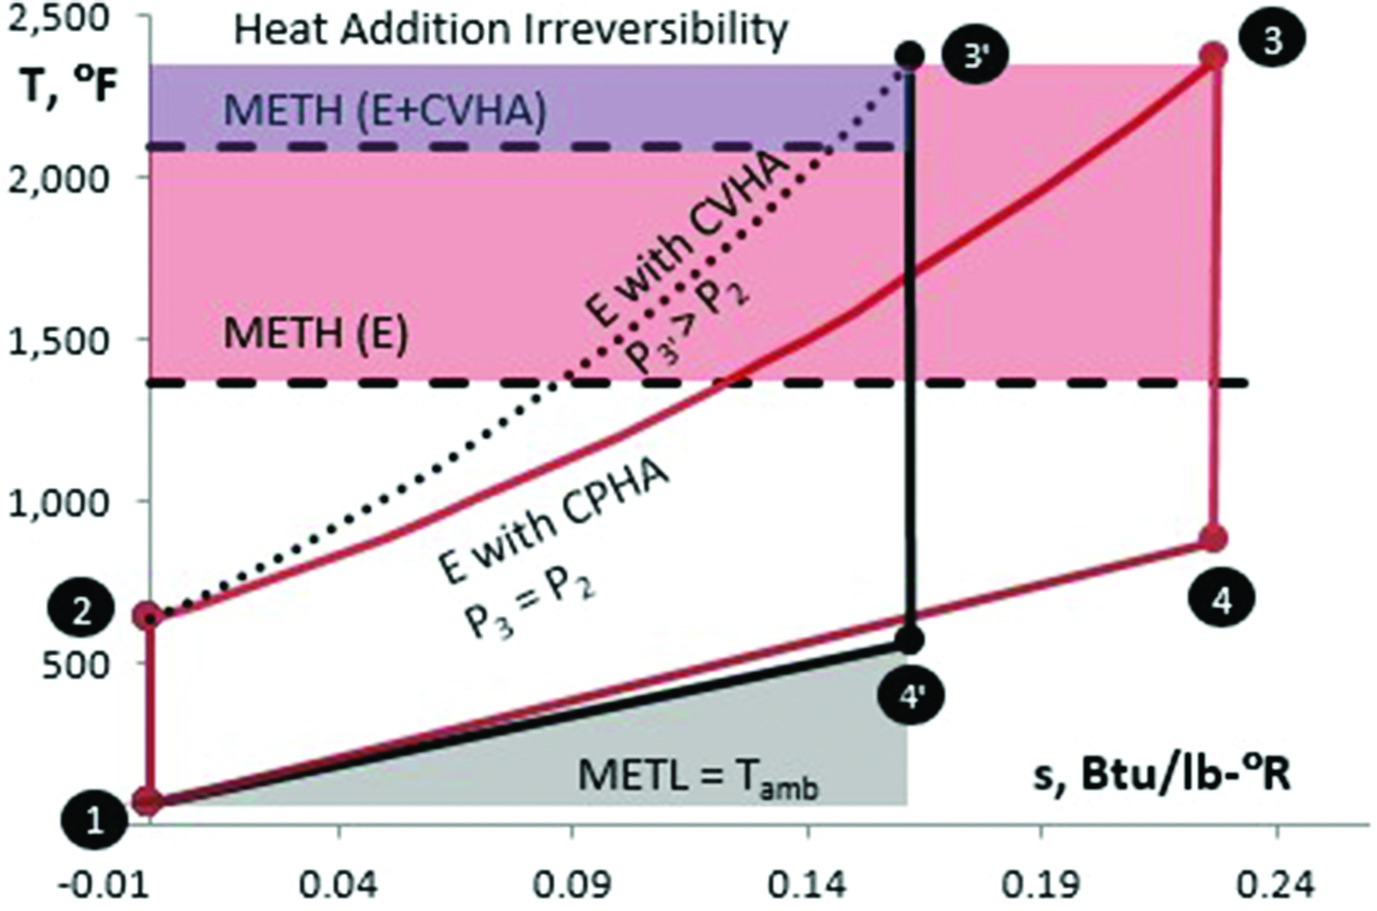
The advantage of CVHA over CPHA, six percentage points in terms of CC efficiency from Table 1, is best illustrated by a comparison of the respective cycles on the temperature-entropy (T-s) plane (see Figure 4). For the same TIT as the base Brayton (CPHA) cycle, the R-G cycle has about 730°F (~400°C) higher METH with 2.6 times the cycle PR. About 20% of the cycle heat input is converted into mechanical energy by increasing the pressure of the cycle working fluid. The resultant reduction in cycle heat addition reversibility is quantified by the comparison of the two shaded rectangles on the T-s diagram.
Reynst envisioned a hybrid or turbo-compound cycle where the combustor of the gas turbine is replaced by a two-stroke reciprocating engine, based on the three-process Lenoir cycle (missing the isentropic compression process), whose shaft drove a compressor. Reynst calculated the efficiency of that ideal constant volume combustion (CVC) cycle as a function of its precompression pressure ratio, PR′, and T1 as follows (Equation 12 on page 151 of 17):
where k = 1−1/γ and γ is the specific heat ratio, cp/cv. In fact, Atkinson and Reynst’s ideal CVC cycle are identical for the same non-dimensional heat input parameter, θ. Furthermore, Atkinson and R-G cycle efficiencies as a function of PR′ and cycle heat addition are also given by the same equation with cp in the denominator of Equation (3) for the R-G cycle 17.
Note that the R-G cycle is a theoretical construction with no information regarding its practical implementation. Conceptually, the SSSF, CVHA process between state points 2 and 3 in Figure 3 can be envisioned as an (imaginary) “topping” Brayton cycle gas turbine with CPHA, in which the imaginary turbine drives the imaginary compressor with no net output.
Similarly, the Atkinson/Humphrey cycle is also a theoretical construction, where the USUF, CVHA process between state points 2 and 3 in Figure 2 can be envisioned as an (imaginary) “topping” reciprocating (piston-cylinder) ICE. This imaginary ICE works against the back pressure P3 and thus the expansion stroke produces no output whereas the compression stroke work, v2·(P3−P2) must be debited against the net output of the main engine. This is why, for the same precompression PR and TIT (or θ), the Atkinson cycle severely under-predicts the performance potential of CVHA and also why the R-G is theoretically correct proxy for a gas turbine with PGC.
As shown in Table 1, with E class TIT and precompression PR, the ideal proxy for a PGC cycle predicts a realistic CC efficiency of 62%. Presently, the next goal post for GTCC performance is set at 65% net thermal efficiency. Earlier studies indicate that this requires nearly 45% GT efficiency with a TIT of 1,700°C (3,092°F, commensurate cycle PR is around 25) (Gülen, 2013). However, as the last column in Table 1 shows, this efficiency can be reached with a PGC gas turbine fired at only 2,700°F (less than 1,500°C). Next, the possibility of this performance prediction is going to be investigated using a “real cycle” analysis.
PGC in practice
Theoretical benefit of constant-volume combustion with simultaneous temperature and pressure rise from an ideal cycle perspective is impressive and unassailable. There are several methods to implement a less-than-ideal but still attractive combustion process with pressure gain. The most obvious and already available method is to use a reciprocating ICE as the combustor (e.g., a “turbocompound” engine á la Napier’s Nomad aircraft engine or Scania truck engines Gülen, 2013). A recently proposed turbocompound reheat gas turbine cycle for small CC applications (about 100 MWe) utilizes this concept (Gülen, 2016). Unfortunately, for utility-scale large gas turbines, limited mass flow capacity of even the largest ICEs makes this an infeasible prospect.
The only possibility for an adiabatic and steady flow process with pressure rise is a supersonic flow with a standing shock wave (idealized as a discontinuity in the flow field.) Similarly, the only possibility for a steady flow process with pressure rise and heat addition is a supersonic flow with a standing detonation wave. It is not possible to design a combustor with steady supersonic flow (Mach number of about 3 to 4) and a standing detonation wave in a land-based power generation turbine. The only possibility is to create detonation waves at a high frequency (say tens of times per second) inside a semi-closed channel (tube) utilizing a suitable ignition system. The inherent unsteadiness of the practical detonation combustion led to the concept of intermittent or PDC, which has been seriously investigated for aircraft propulsion systems for more than half a century 12.
Mechanical problems associated with the PDC (structural integrity of turbine blades, vibration, acoustics, high stress and fatigue) has been a big impediment in development of aircraft engines utilizing the technology. Rotating or continuous detonation combustion (RDC) concept is a variant, which has the potential of overcoming most of those problems 15. Either PDC or RDC is readily applicable to land-based gas turbines for power generation.
Dynamic pressure exchangers or “wave rotors” have also been investigated for pressure gain in combustion. A wave rotor (WR) is a rotating, cellular drum between inlet outlet manifolds 16. The flows inside the manifolds are steady, which is a significant advantage over the PDC with strongly unsteady, pulsating flow. Pressure gain is generated inside the rotor cells via shock waves generated by stoppage of the outlet flow and compression of the inlet (charge) flow via rotation between the manifolds. While the concept sounds too esoteric at first glance, it should be noted that the Comprex supercharger developed by Brown Boveri Co. to be used in diesel engines was essentially a WR.
Valveless (also called aero-valved) pulse combustor is another method, which generates only a modest pressure gain. It is a variant of the valved pulse combustor used in German V-1 “Buzz Bomb” in WWII (Gülen, 2013). The mechanical “flapper” valve is replaced by an inlet pipe, which acts as an acoustically modulated aerodynamic valve (i.e., no moving parts).
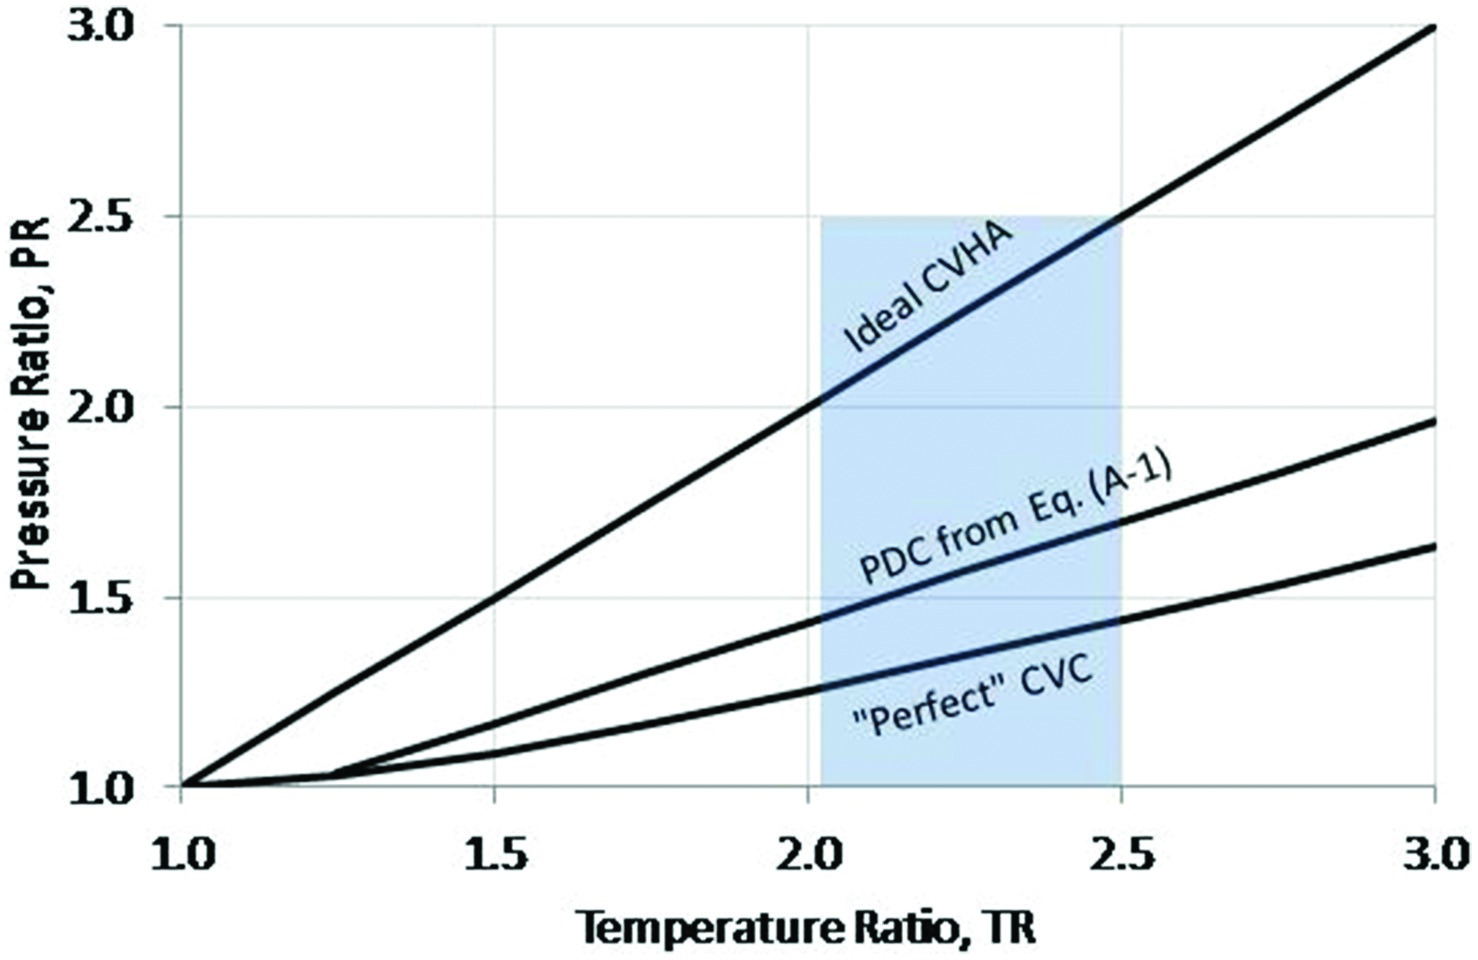
From a land-based, electric generation perspective the key engineering design criterion is the relationship between pressure and temperature ratios, PR and TR, respectively, in the PGC and the requisite fuel-air ratio (FAR). From that perspective, PDC offers the largest efficiency gain potential but is beset by many design challenges, primarily the problem of integration between the unsteady outlet gas flow and the steady turbine flow. For large heavy-duty industrial GTs (HDGT), relevant TR range is 2.0–2.5. Pressure rise potential of PDC and WR (using the “perfect” CVC relationship 16) are shown in Figure 5. (Pulse combustion PR is too low to be of much significance, i.e., less than 1.10.) The PDC PR-TR relationship is derived from detailed detonation calculations as described in the Appendix. The result is in good agreement with formulas developed by different researchers 22
“Real cycle” analysis
Present state-of-the-art in land-based, heavy-duty industrial gas turbine technology is the “J class” with 1,600°C TIT and PR of 23. Largest J class HDGTs are 50 Hz machines rated at nearly 500 MWe generator output and more than 42% thermal efficiency 01. Smaller 60 Hz machines are rated at about 350 MWe with similar efficiency. On a combined cycle basis, J class HDGTs have more than 61% thermal efficiency rating. As the basis of the real cycle analysis, a 60 Hz J class HDGT with 700 kg/s (nominal) airflow, PR of 23 and TIT of ~1,600°C is assumed. Thermoflow’s Inc.’s 23 software is used to model the gas turbine with appropriate chargeable and nonchargeable cooling flows (see Figure 6.
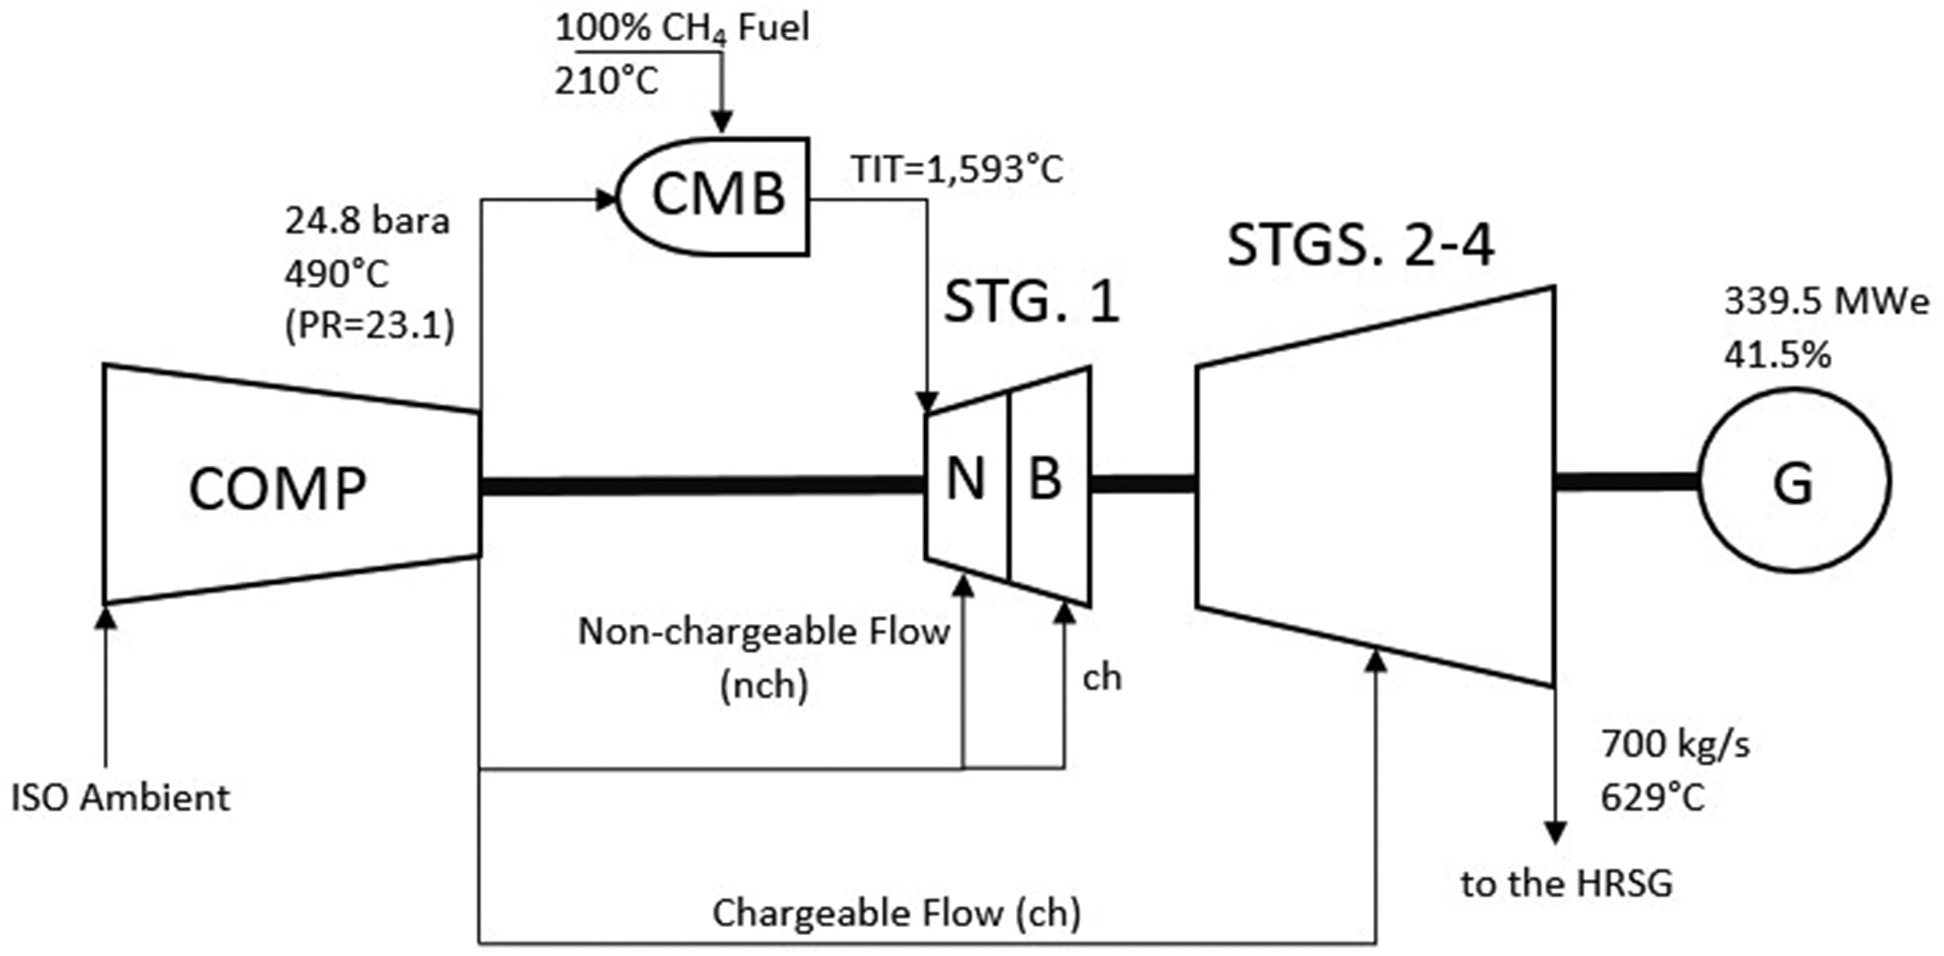
The bottoming cycle, comprising the heat recovery steam generator (HRSG), the steam turbine generator (STG) and the heat rejection system (once-through, open-loop water-cooled condenser with 40 mbar steam pressure), is modelled in Thermoflow’s Inc.’s 03 software. A 2,400 psig (165 barg), 1,112°F (600°C) steam cycle is chosen with state-of-the-art STG technology and suitable exhaust annulus area. The combined cycle net performance is 505.3 MWe and 61.7% thermal efficiency with 174 MWe STG and 8.2 MWe plant auxiliary load (1.6% of the gross output). Gas turbine performance fuel heating to 410°F (210°C) with IP economizer feed water is used.
The base HDGT in Figure 6 is modified by replacing the combustor with a PGC and adding a booster compressor (BC) as shown in Figure 6. The BC ensures that chargeable and nonchargeable cooling flows for the turbine stage 1 are delivered from the compressor discharge, which is now at a lower pressure. This is so because part of the compression duty is taken over by the quasi CVC in the PGC. (Note that the specific volume ratio across a PGC is less than unity; e.g., about 0.6 for a pulse detonation combustor.) Thus, hot gas pressure at turbine stage 1 is in fact higher than that at the compressor exit.
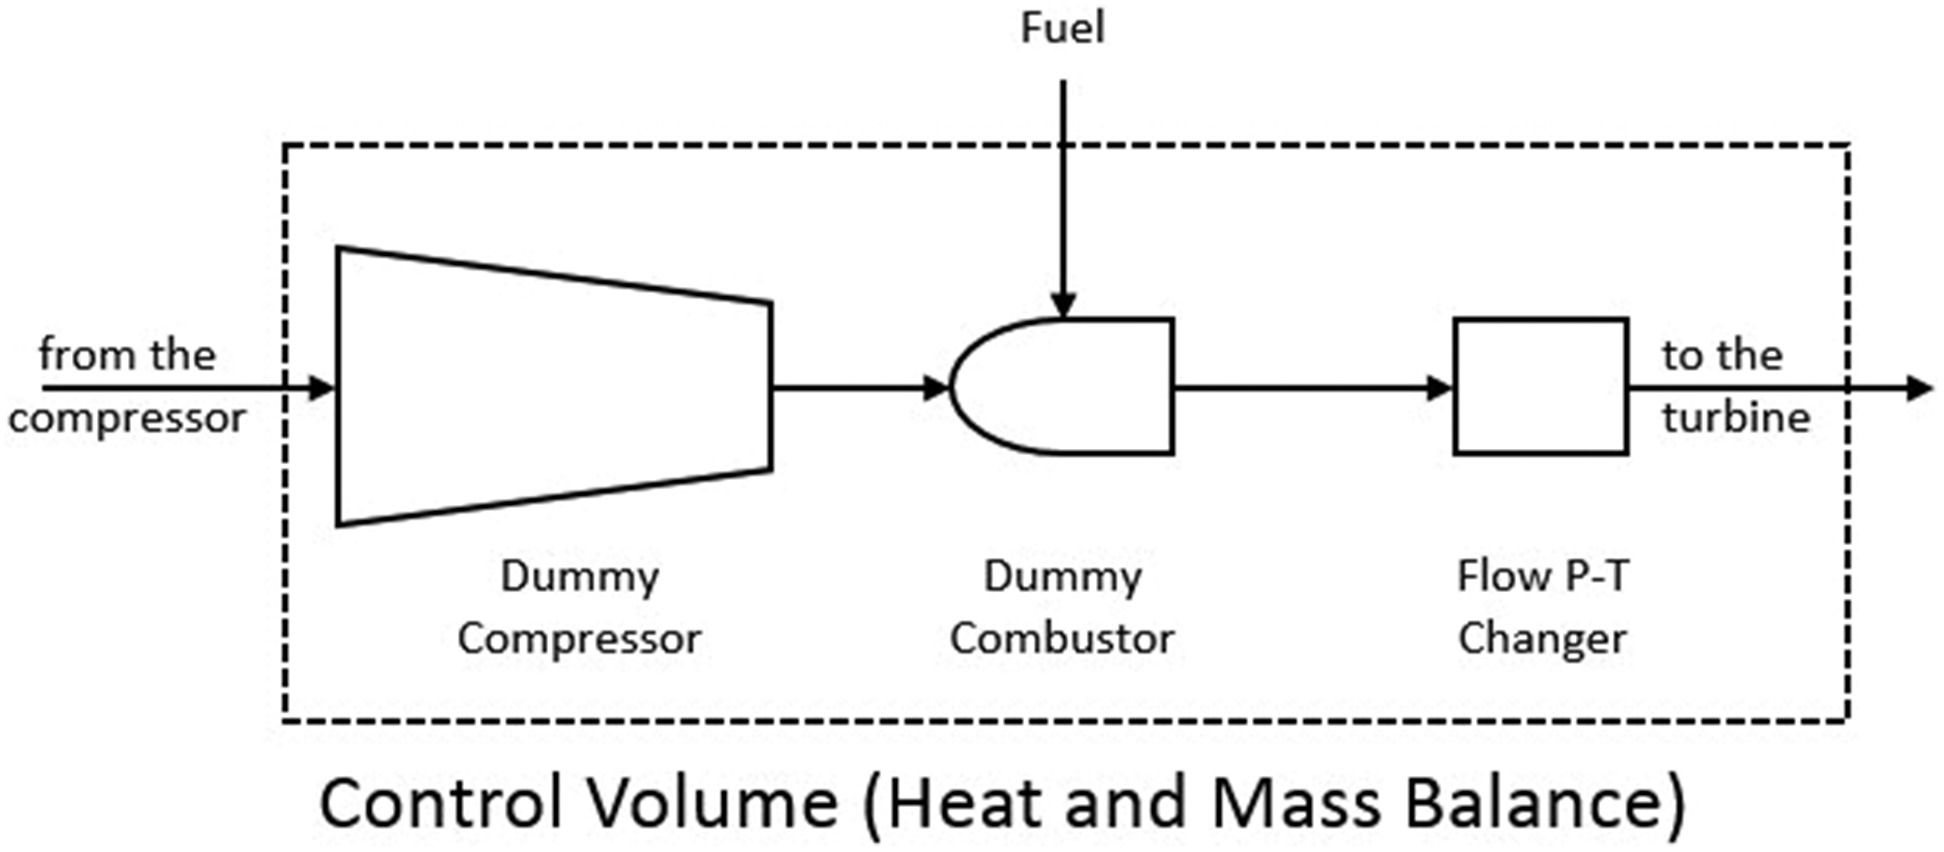
PDC is assumed to be the particular PGC process. The PDC is modelled in Thermoflex as a dummy compressor-combustor combination controlled by a script (to implement temperature and pressure rise via Equation (A-1) in the Appendix along with the fuel consumption via a heat balance). A pressure-temperature changer accounts for pressure and purge-air-dilution loss (5% and ~100°C, respectively) between the PDC and the turbine inlet (see Figure 8). The unfavourable impact of the pulsating gas flow, somewhat “smoothed out” in the transition piece between the PDC and stage 1 nozzle, is quantified by a two percentage point debit to the stage 1 isentropic efficiency.
The PDC cycle performance is calculated for different TIT and precompression PR combinations. Fuel compression is not included (i.e., pipeline pressure is assumed to be high enough). However, 0.5% transformer loss is accounted for. Booster compressor load is debited to the plant auxiliary load. Selected results are listed in Table 2.
Table 2.
Gas turbine with PDC — Rigorous heat and mass balance model results (TIP: Turbine Inlet Pressure).
Rigorous heat and mass balance calculations summarized by the performance numbers in Table 2 fully confirm the ideal R-G cycle predictions in Table 1. The results also unequivocally demonstrate that, as predicted by fundamental thermodynamic considerations, the Atkinson/Humphrey cycle is not the correct ideal proxy for gas turbines with PGC. It significantly underestimates the performance improvement potential of PGC in a combined cycle configuration.
With TIT and cycle PR comparable to those representative of today’s F class technology (~1,500°C), detonation combustion gas turbine is capable of almost 64% net CC efficiency. The 65% goal post is feasible with state-of-the-art J class TIT. Furthermore, as represented by the ratio of STG and GTG outputs, the performance increase is largely due to “topping” cycle (i.e., the gas turbine) improvement. Considering that each kilowatt from the bottoming cycle is nearly six to seven times as expensive as a kilowatt from the topping cycle, PGC is a truly cost-effective method of achieving significant CC efficiency improvement.
Using the budgetary price numbers from 01, i.e., $225/kW for GTG and $1,500/kW for the bottoming cycle (using STG output), the base J class GTCC of Table 2 costs about $340 million or ~$670/kW. However, with the same $/kW prices, the PGC variants cost around $600/kW. Consequently, in order to be on an equal footing with the base GTCC on a $/kW basis, the price of the gas turbine with PGC can be raised to ~300/kW.
PDC has been investigated for more than a half century with an eye on aircraft propulsion applications. So far, significant engineering design challenges such as noise, vibration, fatigue, durability, etc. prevented its successful commercialization 15, 18. The absence of weight and volume limitations (up to a point) in a land-based power generation application, renders a satisfactory resolution of some of the most pressing problems possible (e.g., sturdy design of combustor components, space for deflagration-to-detonation [DDT] transition). Whether the theoretical performance potential calculated herein via Chapman-Jouget theory will survive a realistic design with myriad imperfections (e.g., imperfect mixing of fuel and air, unsteady initial conditions, pressure-temperature and composition variation downstream of the detonation wave, etc.) remains an open question.
Nevertheless, even with a more modest approach using a dynamic pressure exchange (wave rotor) PGC with the “perfect” CVC model for TR-PR prediction, significant CC performance potential is present (see Figure 9). In this case, 64+% CC efficiency is achievable with a TIT of 2,900°F (~1,600°C), same as today’s state-of-the-art J class gas turbine.

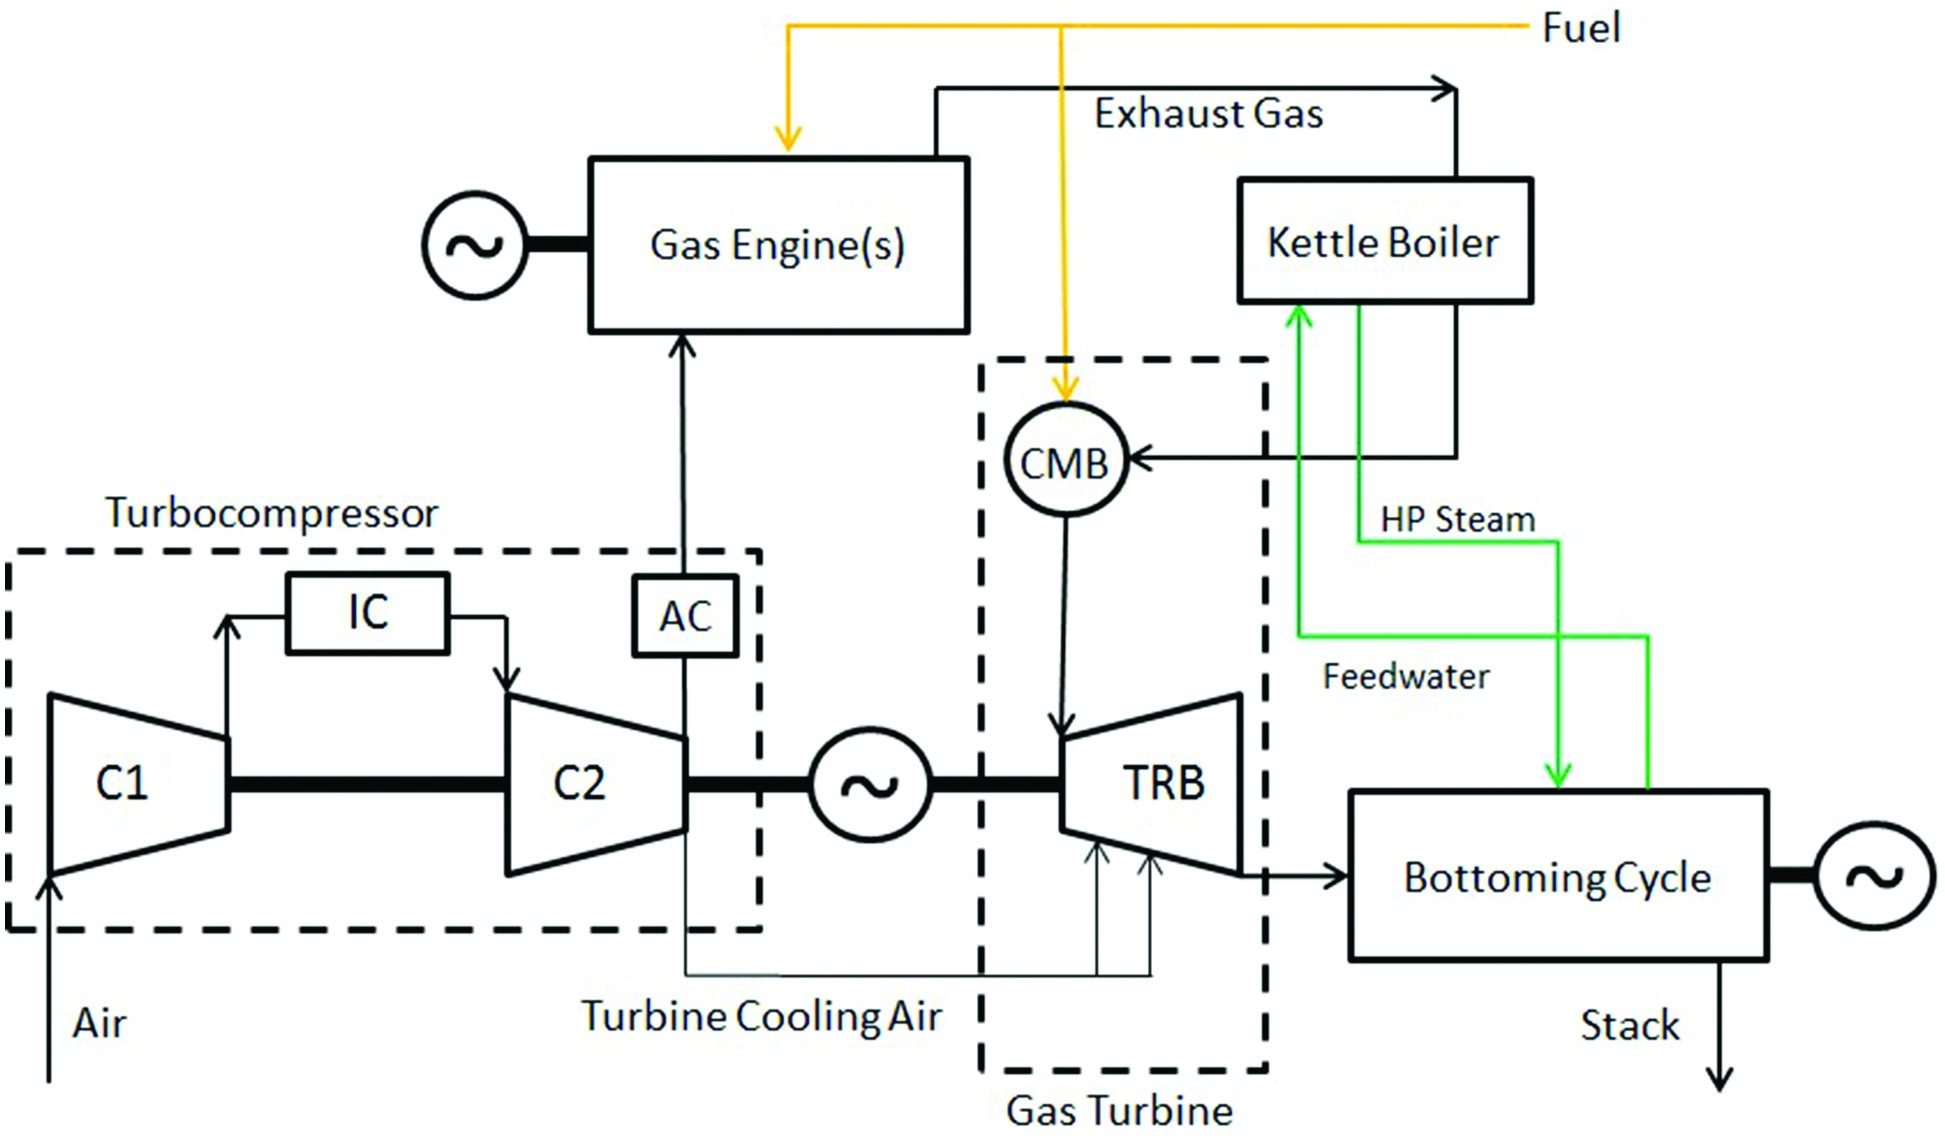
As an indirect substantiation of the performance prediction in Figure 9, consider a small power station concept disclosed in a recent patent (Gülen, 2016), which approaches the implementation of CVHA in an actual power generation system more modestly. The turbocompound reheat GT combined cycle is a hybrid power station comprising two different types of prime movers: a recip-engine genset and a gas turbine. The system is shown schematically in Figure 10. In a “proof of concept” 5 × 1 configuration (i.e., five gas engines and one gas turbine) with modified off-the-shelf equipment and two-pressure, non-reheat bottoming cycle it is rated nominally as a 115 MW and 57.5% net (ISO base load) small power station with E class TIT 10. The piston-cylinder of the recip-engine genset serves as a constant-volume combustor (with a high exhaust pressure and reduced shaft output). The efficiency is enhanced by a second combustion (reheat) with a net gain of nearly 4.5 percentage points in combined cycle efficiency with a modest two-pressure bottoming cycle.
Conclusions
Application of PGC to a land-based gas turbine for electric power generation holds promise towards 65% net combined cycle efficiency at J class TITs. Numerical evaluation of combined cycle efficiency improvement via two different methods, i.e., ideal air-standard cycle analysis and rigorous, fully physics-based heat-and-mass balance models, lead to consistent results. Even at F class level of firing (about 100°C lower TIT) 63.5% net CC efficiency is possible (which is 1.5 percentage points better than the J class GTCC efficiency). Heavy-duty industrial gas turbines provide the design engineers with a sturdier and larger framework to work in to overcome the usual challenges associated with the deployment of PGC in aircraft engines. Reduced bottoming cycle contribution should shift the plant cost towards the topping cycle, which is much cheaper on a per kilowatt basis. Since new technologies under development such as additive manufacturing and CMC materials are equally applicable to gas turbines with PGC, efficiencies well beyond 65% are conceivable in a not-too-distant future.
Nomenclature
The primary unit system used by the author in calculations described herein is the US customary system. Data in tables and figures are converted to SI; however, temperatures in the text are usually expressed in both systems.
Acronyms are defined where they first appear in the text (some of them also appear in the equations, e.g., PR).
Standard notation is used for fluid properties, i.e., P, T, v, h, u, s, cp, and cv, for pressure, temperature, specific volume, enthalpy, internal energy, entropy and specific heat at constant pressure/volume, respectively.
Cycle state-points are numbered per Figure 1–Figure 3 (1 through 4).
Subscripts in, out, air, fuel and mix are self-explanatory. Subscripts exh, id, rat, comp and turb denote exhaust, ideal, rating, compressor and turbine, respectively.
k = Isentropic exponent (i.e., 1−1/γ)
γ = Specific heat ratio
η = Efficiency
θ = Nondimensional heat transfer
τ = Nondimensional temperature, T/T0, where T0 is 59°F (15°C)
Appendices
Appendix
The detonation problem requires the solution of the jump equations describing the two adiabats, i.e. the leading “frozen” shock with no chemical reaction and the detonation adiabat representing all possible end states for the combustion process. It can be shown that the only possible solution to detonations in a semi-closed pipe or tube of length L where the detonation is initiated at the closed end (x = 0) and propagates towards the open end (x = L), is a Chapman-Jouget (C-J) detonation 13. The detonation combustion calculations are based on the five-stage PDC cycle described in 02. Specifically, compressed air from the GT compressor is mixed with fuel. The combustible mixture (i.e. reactants) fills the detonation chamber, which is a semi-closed tube. The detonation starts (the method is not specified) instantaneously at the closed end of the tube, which is filled with a (premixed) fuel-air mixture. The detonation wave is a C-J wave, which is the only possible solution (e.g. see 13). The C-J shock wave, idealized as a pressure and temperature discontinuity, propagates towards the open end of the tube. Downstream of the C-J wave, the fluid comprises the complete combustion products. A rarefaction wave follows the C-J wave and satisfies the boundary condition of zero velocity at the closed end of the tube, x = 0. The pressure of the combustion products drops across the rarefaction wave and the C-J wave exits from the open end of the tube, at x = L, where L is the length of the tube. An expansion (rarefaction) wave starts at the open end and moves to the closed end of the tube. A further drop in the pressure takes place across the expansion wave. The burned combustion products evacuate the tube, which is now ready for the next cycle to start with purging and then filling with fresh fuel-air mixture. The entire cycle is repeated and results in a “periodic high-pressure zone near the closed end of the tube 12.” In a GT, the fresh air for the detonation process and the purge air are supplied from the discharge of the compressor and the combustion products exiting the tube expand through the turbine section to generate useful shaft work.
The following data is known (or assumed):
1. Fuel mass flow rate, temperature and composition (i.e. natural gas as 100% CH4)
2. Air composition, pressure, temperature and mass flow rate (same as the base GT case) at the exit of the compressor
3. Purge flow rate is assumed to be 20% of the total of air mass flow rate that enters the reaction and the fuel flow
Pertinent assumptions implicit in the calculations are as follows: The flow in the PDC chamber, which is a circular tube with constant cross-sectional area, is one-dimensional (1-D), inviscid and adiabatic. Reactants (i.e. fuel and air) and combustion products are ideal gases with properties per JANAF model 21. In other words, they are not assumed to be calorically perfect. Valve(s) that control the cycle processes open and close instantaneously with no losses. Pressure losses in the PDC are ignored. Static pressure and temperature inside the detonation chamber are assumed to be the same as total values at the compressor exit. The fuel-air mixture at the beginning of the detonation is assumed to be at the static pressure of the compressed air. Total pressure and temperature at the PDC exit are calculated using stagnation formulas for state 4. The state of the working fluid at the turbine stage-1 nozzle inlet is determined by mixing with purge air. Mixing with purge air is assumed not to change the total pressure.
The calculation sequence is as follows:
1. Calculate composition, total enthalpy and temperature of the unreacted air (from the compressor discharge) and fuel gas mixture (state 1).
2. Calculate the state of the combustion products downstream of the C-J wave following the theory outlined in 24, state 2. The hydrodynamic solution of the shock problem involves three jump conditions (written for a reference frame that is moving with the shock front) and the ideal gas equation of state. The solution is iteratively obtained in Excel using the SOLVER add-in to determine the four unknowns from the four equations.
3. Use the PR relationship for the centred (isentropic) rarefaction fan (from Equation 3-24b in 14) to calculate the properties of the combustion products downstream of the rarefaction wave part of the C-J detonation, state 3.
4. Use the isentropic formula and the overall heat and mass balance to calculate the total properties of the state downstream of the expansion wave, state 4. The centred expansion wave starting from the open end of the tube and propagating towards the closed end carries with it the “information” that the detonation wave has exited the tube with the ensuing drop in pressure. In laboratory experiments, this final expansion (or blow-down) empties the detonation tube and the exiting combustion products end up with the reservoir pressure. Herein, the final pressure at the exit of the PDC, labelled as state 4, is determined from the isentropic p-T relationship and the overall PDC heat balance. This method is different from the time-averaged PR for the detonation combustion, which is the ratio of the time-averaged total pressure at the PDC exit to the time-averaged total pressure at the PDC inlet
5. Calculate the final state, i.e. state 5, after mixing with the purge air (pressure losses are neglected.) Calculate the final temperature before the entry to the turbine section by mixing the combustion products with the purge air and calculating the enthalpy via simple energy balance.
A conceptual representation of the states 1 to 4 is shown in Figure 11, which qualitatively depicts two pressure transducer signals recorded at two different PDC tube locations in experiments. The numbers are representative for a C-J detonation propagating into a fuel (100% CH4)-air mixture (fuel-air-ratio of ~ 0.04) at Ma = 3.72.

Calculations are done for a range of precompression PRs, ranging from 2 to 8, and FARs, ranging from 0.009 to 0.035. The results are cast into transfer functions to be used in GT performance calculations. For typical gas turbine cycle calculations, the temperature ratio across the combustor (TR) is a given (i.e., via TIT or T3) and the PDC pressure ratio is given by:
In the equation above, TR is the nondimensional PDC tube exit temperature T/Tmix, which, in the cycle notation of the states, is T3/T2 or, in the detonation wave notation in Figure 11, T5/T1. For the calculation of the reactants temperature, the following relationship is used:
where FAR is the fuel-air-ratio. Fuel mass flow rate is calculated from the heat and mass balance of the PDC control volume in Figure 8. The results can be cast into a transfer function for FAR, i.e.
with a proportionality factor of 1.9.