
Introduction
The ocean occupying over 70% area of the earth contains huge amount of renewable energy, such as tidal energy, tidal current energy, wave energy etc. The development of Tidal Current Turbines (TCTs) is recently valued by people. However, most of the TCTs operate at high flow rates higher than 2 m/s. For example, the SR2000, deployed in Orkney, UK, the most powerful turbine in the world, is capable of generating 2 MW power at a rated speed 3 m/s (The revolutionary Orbital Marine SR2000 Tidal Turbine, 2023). The Sabella D10 (Sabella D10-France, 2023) is a 10-meter diameter 6-blade turbine which can produce 1 MW power at speed 4 m/s. Indeed, numerous low flow velocity regions exist in the ocean and many of them have flow rate below 2 m/s. The flow rate near Malaysia is only around 1.2 m/s (Lim and Koh, 2010). The maximum flow rate near Brazil is between 2 and 2.5 m/s but the average flow rate is only 1.1 m/s (González-Gorbeña et al., 2015). Flow rates are low in most parts of China, such as the South and East China Sea, and the annual flow rate in some areas is even below 1 m/s on average. If the energy of these low flow rate regions can be fully utilized, it will make significance advance for the development of ocean current energy. An important problem facing the TCTs at low flow rate is how to improve the efficiency and start performance at low flow rate.
There are many ways to improve the blade efficiency, and one of the most effective methods is to optimize the hydrofoil. Wei Xuesong optimized E387 hydrofoil at low Reynolds numbers, and the distribution of the lift-drag coefficient under different attack angle changes significantly, and the stall performance of the conditions under small attack angles is significantly improved (Wei et al., 2020). Liang Yu proposed a multi-objective optimization method with robustness to reduce the hydrofoil’s sensitivity of design conditions, and the performance of the optimized hydrofoil is robust under different non-design conditions (Liang et al., 2010). The method to improve the starting performance mainly includes two aspects, One is to optimize the blade’s shape, one is to reduce blade’s weight. There are many studies on structural weight reduction but few studies on startup performance. G. S. Bir optimized the blade’s structure by constraining blade’s weight, Material strength, stiffness and yield limit (Bir et al., 2011). Monte used a multi-objective genetic algorithm during the blade optimization process, which significantly reduced the blade’s quality and increased the blade’s stiffness without changing the original composite material (Dal Monte et al., 2013).
This study is aimed to propose an optimization method to design TCT blade for low current speed regions with high hydrodynamic performance, good startup performance and durable structure. The optimization process of a blade mainly includes the optimization of hydrofoil, design of blade’s hydrodynamic shape, design of mechanical structure and optimization of mechanical structure.
Design optimization method
For the design of hydrofoil, this paper have two goals, one is to improve the hydrodynamic performance and starting performance of the hydrofoil, the other is to improve the strength of the hydrofoil. For the lightweight optimization of blade, The high strength hydrofoil is selected for the design of blade’s shape, and then the mechanical structure is optimized to remove the redundant structure.
The optimization in this paper used multi-objective Genetic algorithm (geatpy). The optimize process was as follows (Figure 1).
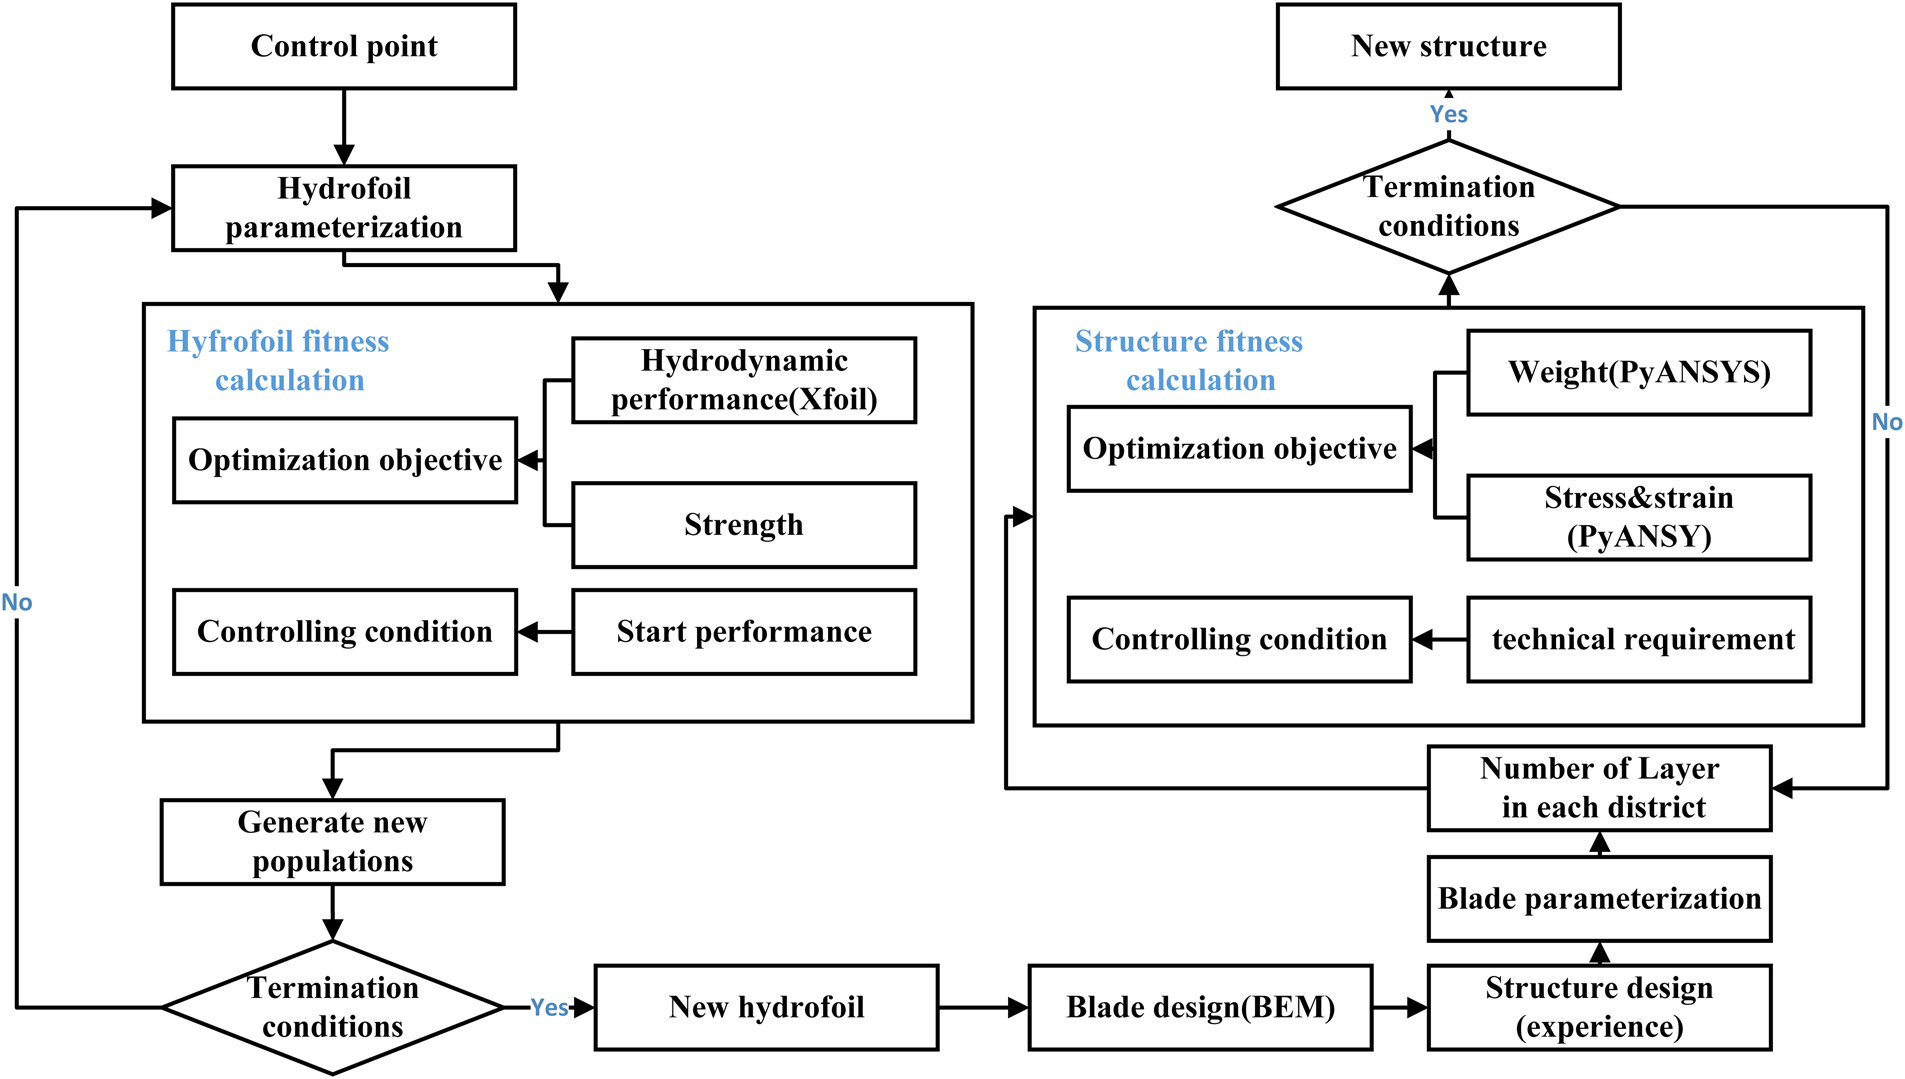
Hydrofoil optimization method
The goal of this optimization is to improve hydrofoil’s hydrodynamic performance and start-up performance, and the new hydrofoil needs to be strong enough. Xfoil was used to calculate the lift coefficient and drag coefficient of hydrofoil. In order to ensure the performance of the hydrofoil at the low flow rate, we used a low Reynolds number 1,500,000. The design objectives of hydrofoil optimization were:
where Iy0 was the dominant moment of inertia and hydrofoil receives the greatest bending moment in this direction. Iy0 was chosen to represent the strength of the hydrofoil and lift-drag coefficient (Cl/CD) was chosen to represent Hydrodynamic performance of hydrofoil.
In order to obtain a hydrofoil with good starting performance, it was necessary to improve lift coefficient under a relatively big attack angle.
The design constraints of hydrofoil optimization were:
where ldβ was hydrofoil’s lift coefficient and drag coefficient under the optimize attack angle β. ldβ−1, ldβ+1, ldβ−2, ldβ+2 was hydrofoil’s lift-drag coefficient under attack angle β−1, β+1, β−2 and β+2.Structure optimization method
The blade mechanical structure will mainly bear the flapwise/edgewise bending moments, shear forces, torsional torque, etc. At present, the Euler-Bernoulli beam model is commonly used to design the blade mechanical structure. The stress σd at each point on the section can be calculated through the following simplified formulas (Boresi et al., 2002):
Here Mx is the bending moments at the section of blade, and
where, Obj_w was the mass target of the blade, Obj_equ was the maximum stress target of the blade, and Obj_u was the maximum deflection target of the blade.
In order to prevent the stress concentration at the sudden change of pavement thickness, the pavement thickness of different sections should be transitioned as smoothly as possible. The design constraints of hydrofoil optimization were:
where, n represented the serial number of the section of blade starting from the blade root. Layer_(n) represented the number of layer in the section n.
Results and discussion
In this paper, a 500 W TCT, 500 W_ORI, was designed as the basis of optimization and contrast. The design parameters of the blade are as follows (Table 1):
Table 1.
Design parameters of 500 W_ORI TCT.
| Designed parameter | Value |
|---|---|
| Flow rate | 1.5 m/s |
| Speed | 50 rpm |
| Blade number | 3 |
| Radius | 0.72 m |
| Hub radius | 0.4 m |
| Hydrofoil | NACA63421 |
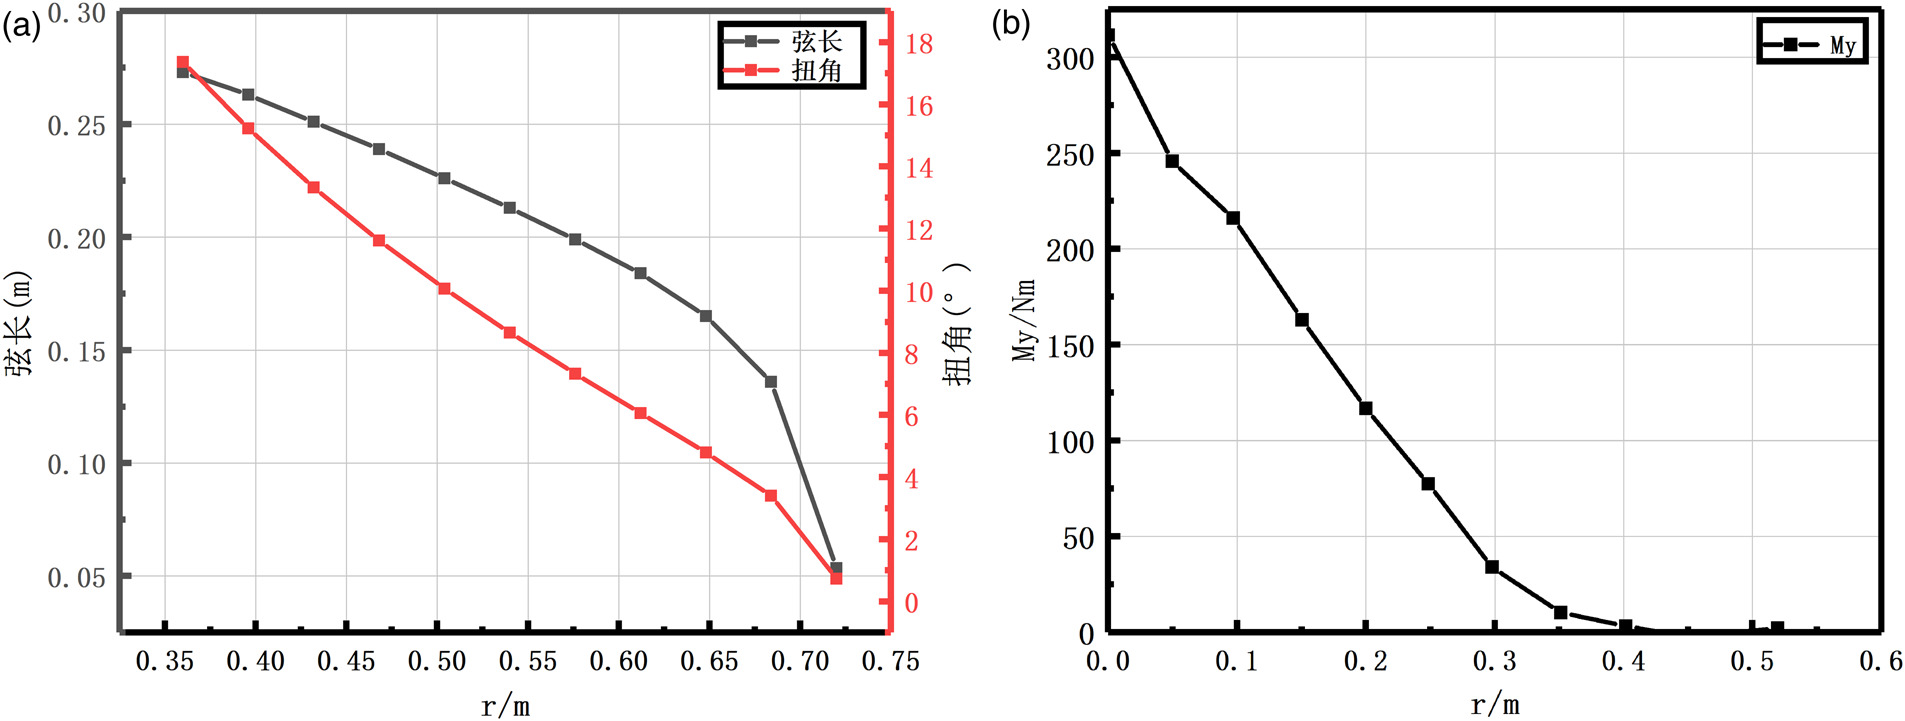
The hydrodynamic shape (Figure 2(a)) and bending moment (Figure 2(b)) of the blade are As shown in the figure below:
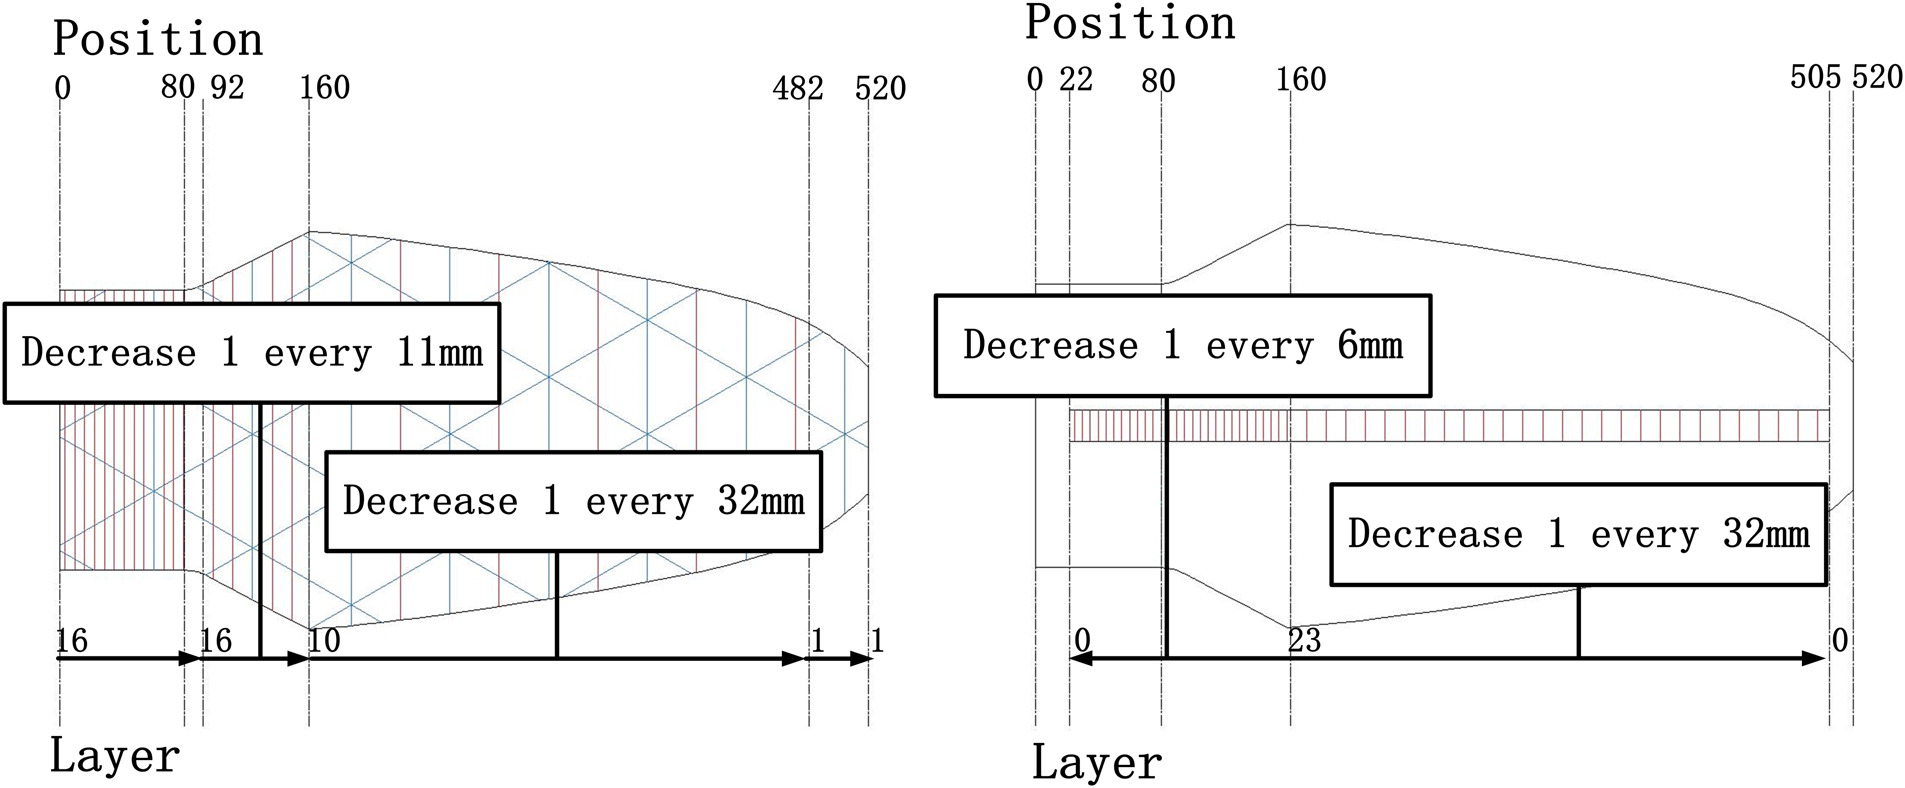
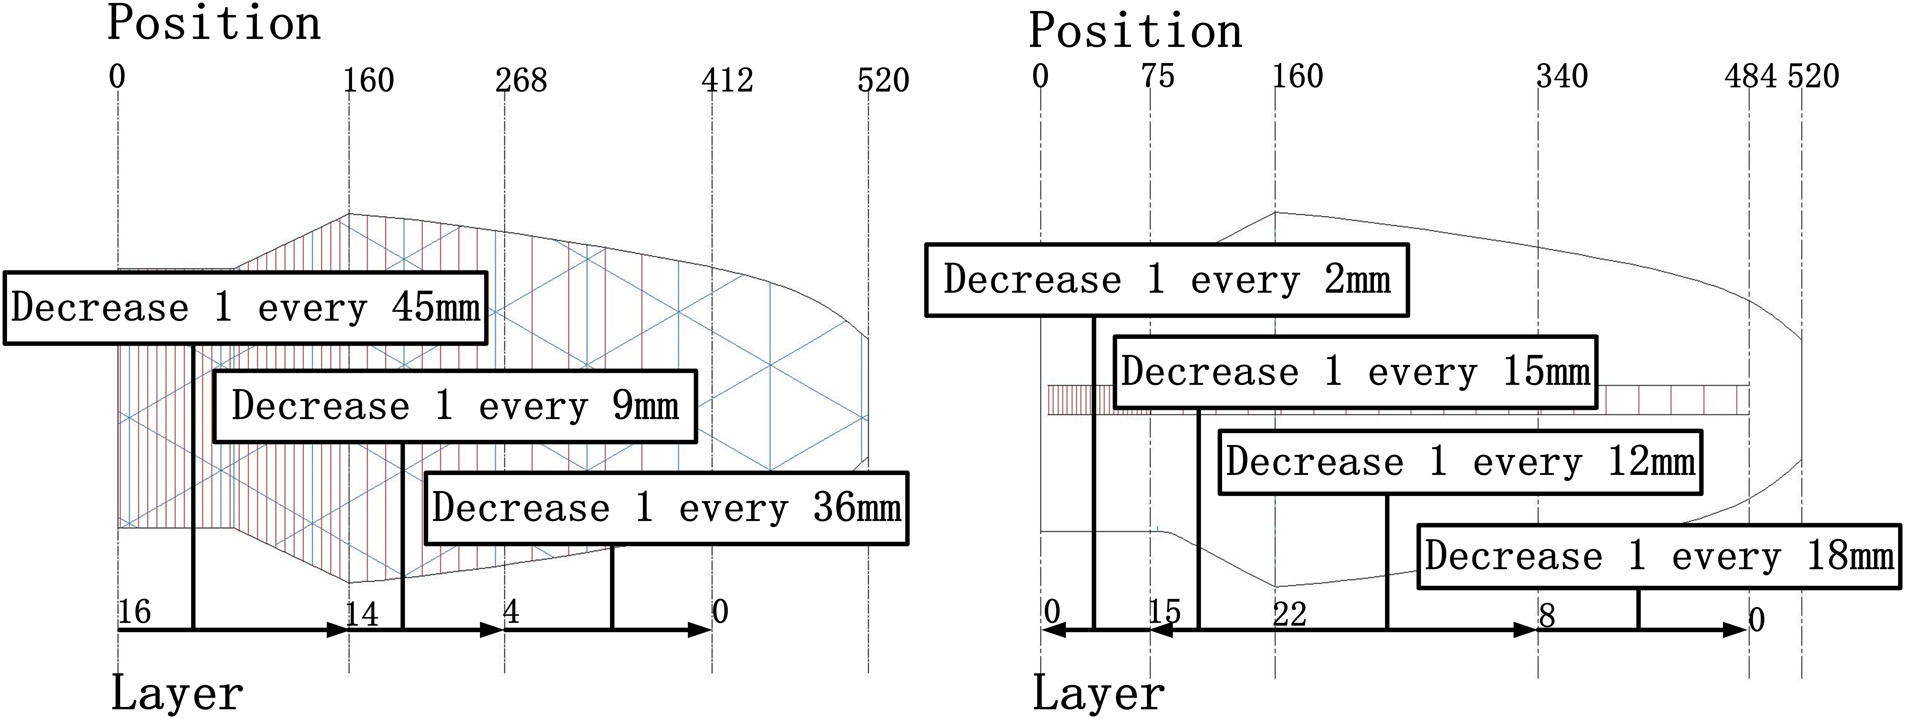
According to the calculated load, the design of mechanical structure can be completed (Figure 3).
Figure 3.
500 W_ORI blade structure under empirical design (Left is skin layer, Right is spar layer).
Optimization algorithms and the new hydrofoils
The hydrofoil was divided into four Bezier curves which were in the order of leading edge-trailing edge-leading edge. Because the hydrofoil curve is smooth and continuous, some parameters can be combined, thus the hydrofoil can be fully described with 16 coordinate parameters (Figure 4(a)). According to the size of parameters, the population size and the maximum genetic algebra of the multi-objective optimization algorithm was set as 200, 30 generations, which was broad enough for genetic variation. Then the Pareto solution set is obtained without local optimal solution. Selected the result of the star symbol as the optimization result (Figure 4(b)).

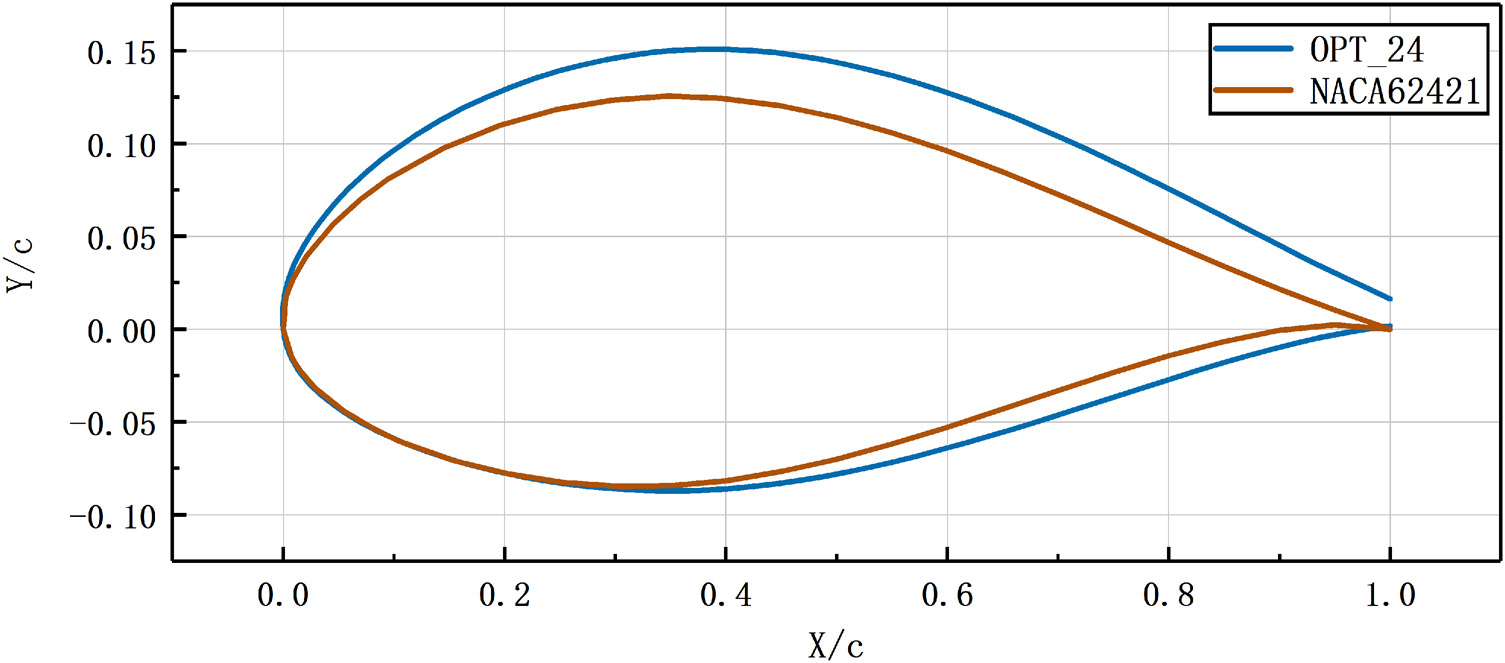
After optimization, the thickness of the hydrofoil was 23.5%, so we named the new hydrofoil as OPT_24. The shape of OPT hydrofoil and NACA63421 are shown in the figure below (Figure 5):
The lift-drag coefficient curve of the hydrofoil is shown in Figure 6(a). The maximum lift-drag coefficients of NACA63421 and OPT_24 are 131.54 and 132.01 at the angles of attack of 6° and 8°. The lift-drag coefficient of the hydrofoil is increased by 0.4%. In addition, the lift coefficient of the hydrofoil also increases significantly after 7° and the old and new hydrofoils have almost the same stalling attack angle, so it can be predicted that the new hydrofoil will have a larger lift coefficient under larger Angle of attack. The lift coefficient of the hydrofoil is shown in Figure 6(b).

The optimized hydrofoil OPT_24 was used to redesign the blade’s shape of the 500 W TCT (Figure 7(a)). The redesigned blade was named as 500 W_OPT blade. The hydrodynamic characteristics of 500 W-OPT TCT was verified by numerical simulation in STAR CCM+. The SST-ω model is selected, and the near-wall control y+ is near 5. SIMPLE algorithm is selected for Pressure-velocity coupling, and the flow flux and diffusion terms are processed by second-order upwind discrete scheme.
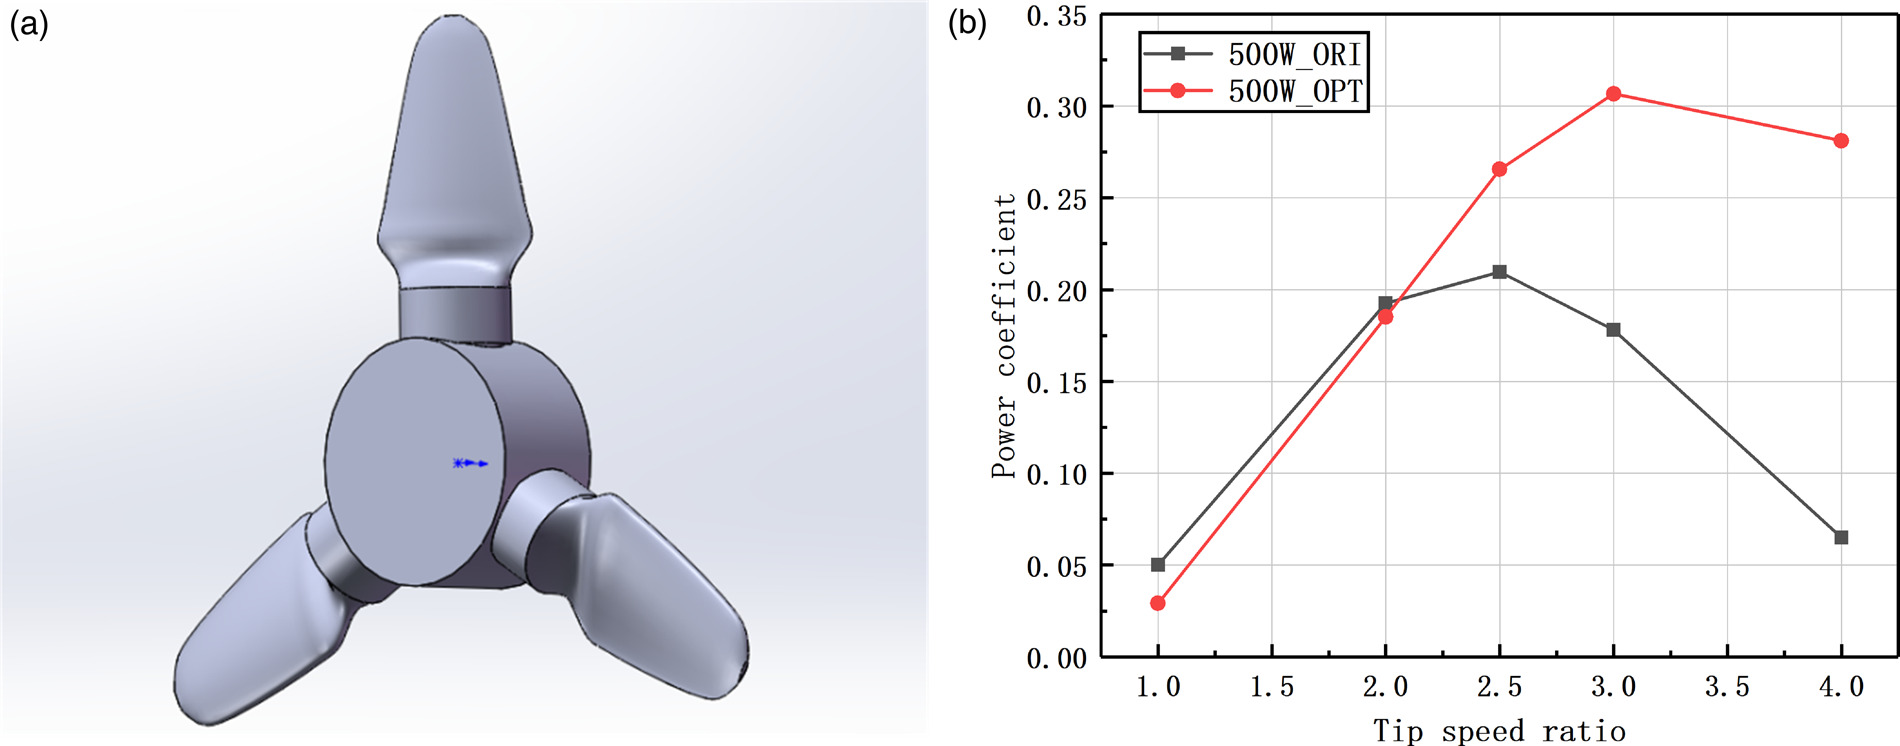
At 2.5 tip speed ratio, the 500 W_ORI TCT’s capturing power is 596.6 W and power coefficient is 0.209, while the 500 W_OPT capturing power is 758.8 W and power coefficient is 0.26. The capturing power increases by 27.2%. The capturing power of 500 W_OPT is 874.8 W under the optimal tip speed ratio 3, which increases 500 W_ORI’s best capturing power by 46.6% (Figure 7(b)). At 2.0 tip speed ratio the power efficiency is slightly decreased, this is caused by the optimization goal of controlling only the maximum lift-drag coefficient. Because the TCT always operates under the optimal tip speed ratio, so the blade design process only needs to consider the optimal lift-drag coefficient, and the decrease of capture efficiency under non-optimal conditions has little effect on TCT’s operation.
Mechanical structure design of 500 W_OPT blade was carried out. As the strength of the hydrofoil increased, the number of spar decreased comparing with the 500 W_ORI blade (Figure 8).
Figure 8.
500 W_OPT blade structure under empirical design (Left is skin layer, Right is spar layer).
The mass of 500 W_OPT blades under empirical design is 6.054 kg, which is 4.13% less than that of 500 W_ORI blades. OPT_24 hydrofoil reduces the weight of the blade so it is more conducive to starting at low flow rate.
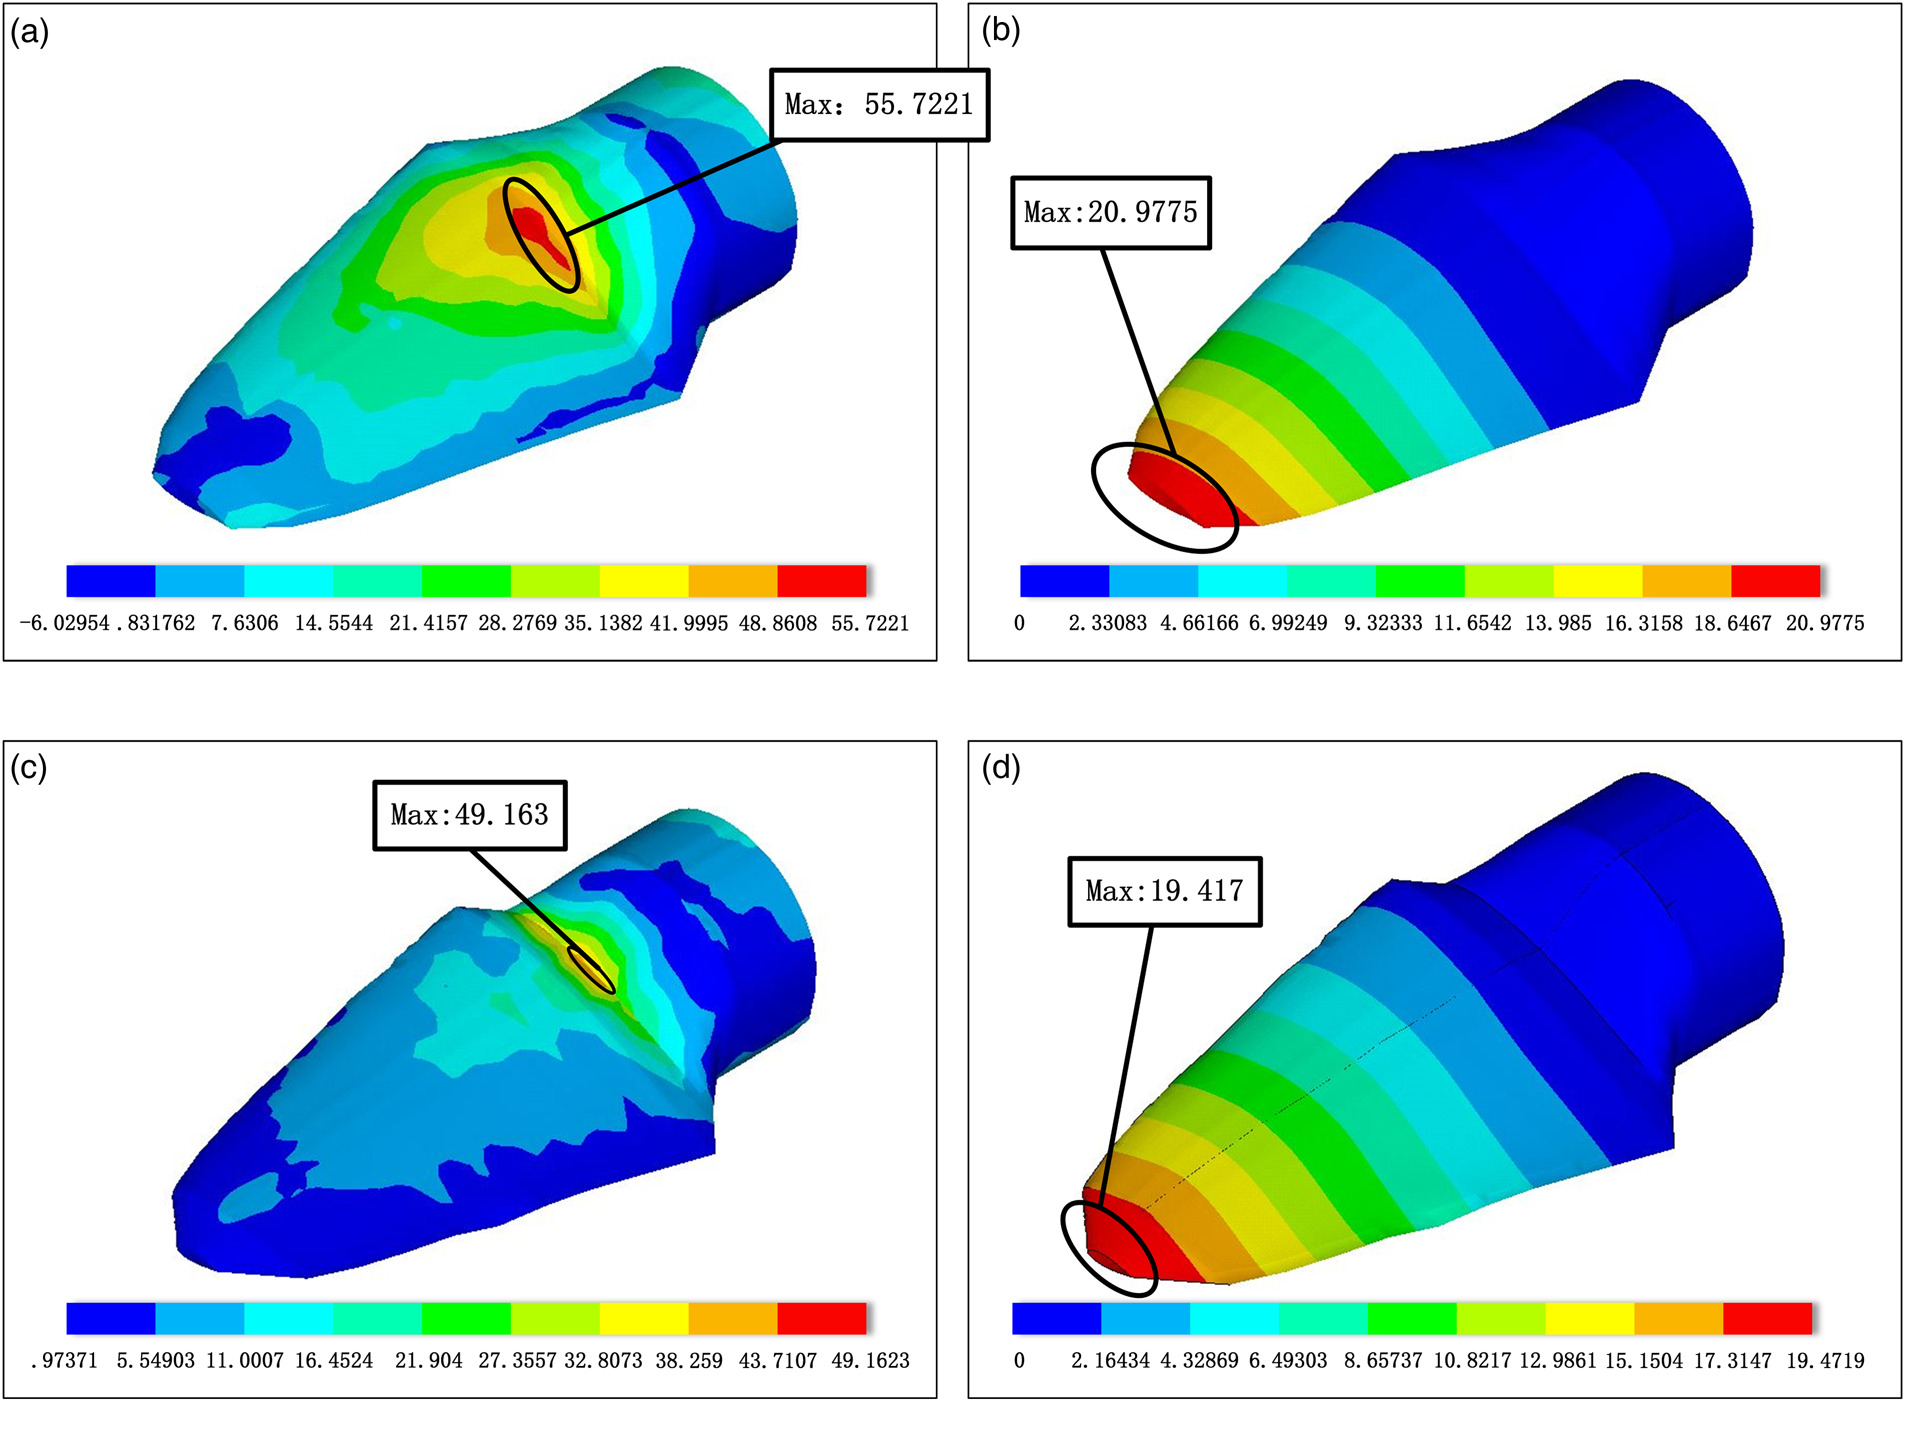
The strength of the NACA63421 hydrofoil and the OPT_24 hydrofoil were verified in ANSYS APDL. At 340 and 448 mm away from the blade root, 38.02 and 85.03 kN were applied respectively to simulate the ultimate load condition.
The maximum stress and tip deflection of 500 W_OPT Blade Under Empirical Design Structure reduce by 11% and 7%. After the hydrofoil optimization, the thickness of the spar layer in the middle of the blade increases, which plays a positive role in reducing the stress concentration in the middle. The stress distribution of 500 W_OPT Blade is obviously improved (Figure 9).
Optimization algorithms and the new structure
For mechanical structure optimization, the blade was divided into 14 parts (Figure 10(a)), and the thickness of each part was used as a optimization parameter. Then we obtained Pareto solution (Figure 10(b)).
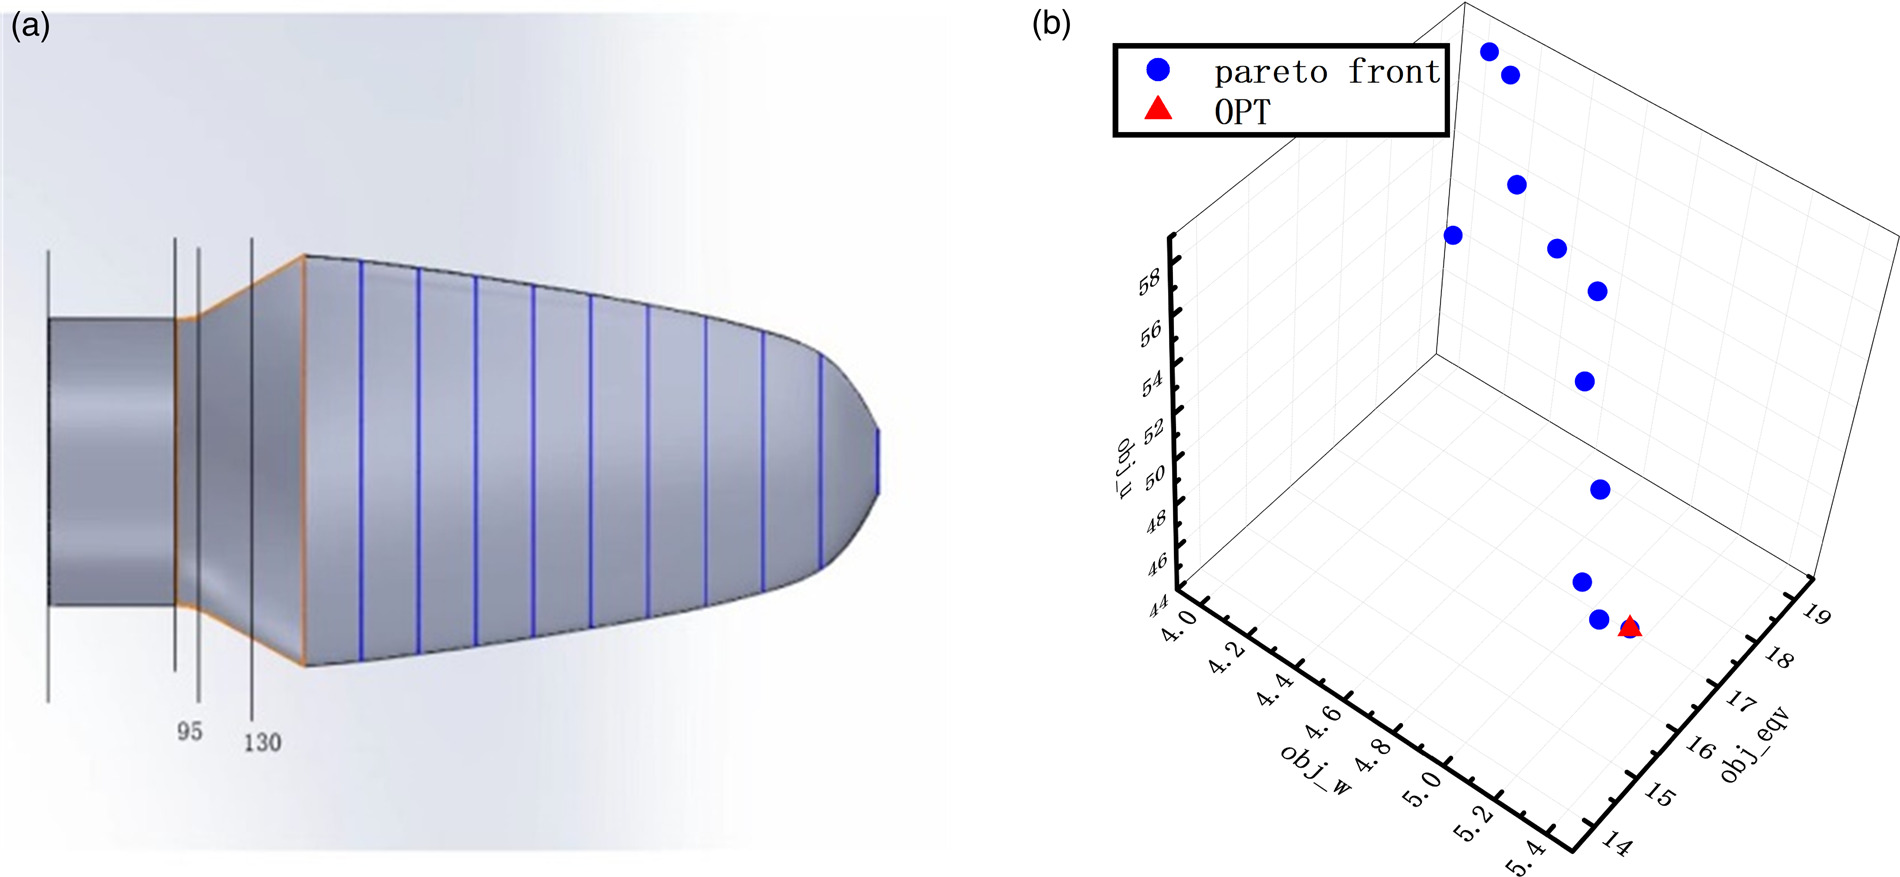
According to the results, optimize structure is obtained (Figure 11).
Figure 11.
500 W_OPT blade structure after structure optimization (Left is skin layer, Right is spar layer).

Then we can get the stress and deformation of the 500 W_OPT blade after structure optimization. The load was applied in a manner consistent with that under the experience layup (Figure 12).
Figure 12.
Stress and deformation of 500 W_OPT blade after structure optimization (lift is the Stess, right is the deformation).
The weight of the 500 W_OPT Blade Under Empirical Design Structure is 6.054 kg, while the weight of the 500 W_OPT blade After Structure Optimization is reduced to 5.36 kg which is about 11.46% lighter than 500 W_OPT Blade Under Empirical Design Structure and is 13.76% lighter than 500 W_ORI blades. The lightweight effect is remarkable. The tip deflection of the 500 W_OPT blade After Structure Optimization is reduced by 22.02% than 500 W_OPT Blade Under Empirical Design Structure and 27.52% than 500 W_ORI blades. The maximum stress of the 500 W_OPT blade After Structure Optimization is 49.67 MPa which is reduced by 10.85% compared with the 500 W_ORI blades. Moreover, the low stress area on the blade surface increases significantly compared with the structure without optimization.
Test verification
Workshop strength test
According to the design, the 500 W_ORI blade and 500 W_OPT blade were produced by the factory. The total mass of the 500 W_ORI blade is 6.460 kg and the total mass of the 500 W_OPT blade is 5.730 kg. Both of blades were tested in the workshop. The strain gauges used in the strength test were the BF120-5AA (11)-P150-D strain gauges made in China. The resistance value of the strain gauge was 120 Ω, the strain grid size was 5 mm, and the sensitivity coefficient was 2 ± 0.01. Six strain gauges were installed along spar at the blade’s pressure surface at distances of 0.040, 0.080, 0.130, 0.160, 0.230 and 0.350 m from the root and the loading point were 0.340 and 0.448 m. The pressure surface set facing downward (Figure 13). The quarter-bridge method was used, and the obtained experimental results were basically consistent with the simulation results. The maximum deviation of the experiment and simulation of the optimized blade and the original blade appeared at the sixth test point, which was 22.3% and 20.7% respectively. The main reason for the deviation was that the influence of the embedded bolt was not considered in the simulation stage, and the solidification temperature and solidification speed of the composite material during the blade processing had a certain influence on the performance of the blade after forming.
The strain curves of blades under different loading proportions can be obtained after analyzing the results of the loading test of 500 W_ORI blade (Figure 14(a)) and 500 W_OPT (Figure 14(b)). Both blades show the maximum strain at almost the same position, but after reaching the maximum strain, the strain of optimized blade quickly recover to very small values with increasing distance and the maximum strain under different proportions of loading is lower. The test shows that the optimized blade can improve mechanical properties and achieve light weight.
Sea water test
The 500 W_ORI blades and 500 W_OPT blades were respectively tested on the ocean energy platform of Zhejiang University in Zhoushan Sea area. The test time was chosen to be carried out in the neap tide when the ebb and rise time was 6 h, and the TCT was put into the sea for test during the flat tide. The flow velocity data of 500 W_ORI TCT and 500 W_OPT TCT during the test are shown in Figure 15. The velocity range met the rated velocity of 1.5 m/s and the ultimate velocity of 2.5 m/s in blade design.
During the test, it can be observed that the 500 W_OPT blade started to rotate when the flow rate was within the range of 0.5–0.6. After optimization design, 500 W_OPT blade has good start-up performance at low flow rate. The blades were installed on the 500 W turbine (Figure 16(a)) and we get the the power of the 500 W_OPT TCT and 500 W_ORI TCT in different velocity (Figure 16(b)) and the baldes’ power corfficient (Figure 16(c)).
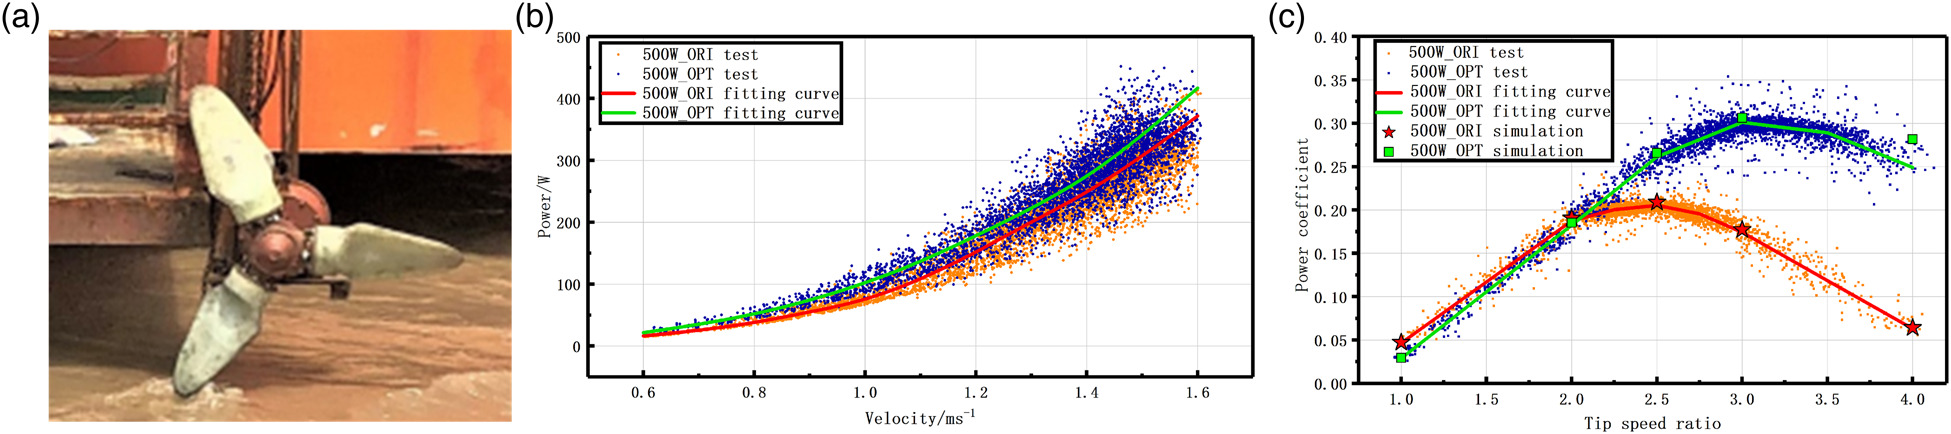
According to the Figure 16(c), for 500 W_ORI, its simulation data is near the fitting curve and its deviation is about 4% through calculation, so the accuracy of the simulation is verified through experiments. For 500 W_OPT, except the point at tip speed ratio 4, the other simulation data points are all near the fitted curve, and the deviation is about 5%.
When the rated flow rate is 1.5 m/s, the DC load power of 500 W_ORI TCT is 300 W, and 500 W_OPT TCT is 330 W. The calculated efficiency of the available generator to the DC load is about 63%, that is, the TCT capture efficiency of 500 W_ORI TCT is 476.19 W, and 500 W_OPT TCT is 523.81 W, increasing by 8.96%. At the same time, the measured max power coefficient of the 500 W_OPT TCT is increased 46.1% compared with the 500 W TCT.
Conclusions
The hydrodynamic performance of the OPT_24 hydrofoil is enhanced, the maximum lift-drag coefficient increases by 0.4%, and the lift coefficient increased when the angle of attack is large. The power efficiency at the optimal tip-speed ratio of 500 W_OPT increased by 46.6% compared to 500 W_ORI. The weight of 500 W_OPT under empirical structure design reduced 4.13% compared to 500 W_ORI under empirical structure design, and the maximum strain and maximum tip deflection decreased by 11% and 7%.
The weight of 500 W_OPT after structure optimization is 13.76% less than the 500 W_ORI, and the maximum strain and maximum tip deflection decrease by 10.85% and 27.52%
The results of the test are basically consistent with the results of the simulation, and the mass of the actual 500 W_OPT blade is reduced by 11.3%, and the stress distribution is significantly better than that of 500 W_ORI. In the sea water test, 500 W_OPT was able to start at the flow rate of 0.5–0.6 m/s and the maximum energy capture efficiency increased by 46.1% which is consistent with the simulation results. The design goal has been basically achieved.