
Introduction
Future turbomachinery applications in aero engines and industrial gas turbines require a comprehensive physical understanding and innovative solutions. Even though computational capabilities are rising fast, the necessary confidence level is still restrained. To foster the understanding and validation of theoretical and numerical models, extensive experiments, applying realistic operating conditions are crucial. Hence, comprehensive data of high speed test cases with appropriate technology readiness levels (TRL) are necessary.
To tackle the aforementioned topics, the Transonic Compressor Darmstadt (TCD) at Technical University of Darmstadt (TUDa) contributes to various research areas with respect to modern transonic compressors for more than 25 years. Since commissioning in 1994, many experimental and numerical investigations have been conducted, leading to a better understanding of the underlying physics, both in aerodynamics and aeroelasticity, as well as design enhancements and validations. It includes different rotor designs, for example considering 3D optimization features (e.g. Schulze, 1996), varying blade counts (e.g. Franke et al., 2020a,b), aspect ratios (e.g. Hormel et al., 2019) or materials, novel stator designs, for example in tandem arrangement (e.g. Foret et al., 2021), as well as 1.5-stage setups with variable inlet guide vanes (e.g. Holzinger et al., 2013). Besides performance and validation measurements (e.g. Reising and Schiffer, 2009), transient phenomena during stall inception have been a major research focus (e.g. Biela et al., 2008), focusing on unsteady aerodynamics and aeroelasticity (e.g. Möller and Schiffer, 2020). Here, the effects of varying rotor casing features, including tip clearance (e.g. Holzinger, 2017), eccentricity (e.g. Jüngst, 2019) and casing treatments (e.g. Brandstetter et al., 2016), as well as inlet distortions (e.g. Wartzek et al., 2016) have been investigated in recent years. Furthermore, sophisticated measurement technologies have been introduced (e.g. Brandstetter et al., 2018) and novel countermeasures have been derived, resulting in investigations with respect to mistuning (e.g. Franke et al., 2020a,b). Based on years of experience, also a second state-of-the-art transonic compressor test facility (Kunkel et al., 2019) has been developed and commissioned.
Despite the technological advancements, including contributions of aforementioned research, and rapid developments in computational resources and capabilities, the necessary confidence is still restrained to cope with the challenging demands of next generation aero engines or industrial gas turbines. Validation benchmark test cases, such as the commonly used NASA Rotor37/67 or recently introduced ECL5/CATANA open-test-case fan (Brandstetter et al., 2021), are crucial for scientific research and industry collaborations.
The introduced TUDa-GLR-OpenStage data set, including geometry information and measurement data, provides a comprehensive test case for the turbomachinery community. Hence, it enables high quality measurements to foster improvements in numerical modeling and validations, in order to tackle current and future challenges in turbomachinery applications.
This paper provides an introduction into the experimental setup, measurement and analysis methodologies as well as exemplary data and results. Therefore, it aims to be a guideline and reference for users of the test case.
Methodology
In order to enable the comprehensive measurements, focusing on several research topics, a state-of-the-art test facility in conjunction with extensive measurement systems and instrumentation as well as sophisticated test and analysis procedures are necessary.
Test facility
The TCD test rig, as shown in Figure 1, enables investigations of single and 1.5-stage transonic compressor configurations with technology readiness levels of TRL 4–5. It is an open-loop test facility, using ambient air which is guided through an inlet throttle and settling chamber into the compressor core. Downstream the compressor, the air is released to ambient via an exhaust duct. The rig is electrically driven by an 800 kW DC drive, in conjunction with a gearbox, enabling shaft speeds of up to 21,000 rpm. To set different operating conditions along defined compressor characteristics, an outlet throttle, including a safety bleed, is used to vary the back-pressure of the compressor stage.
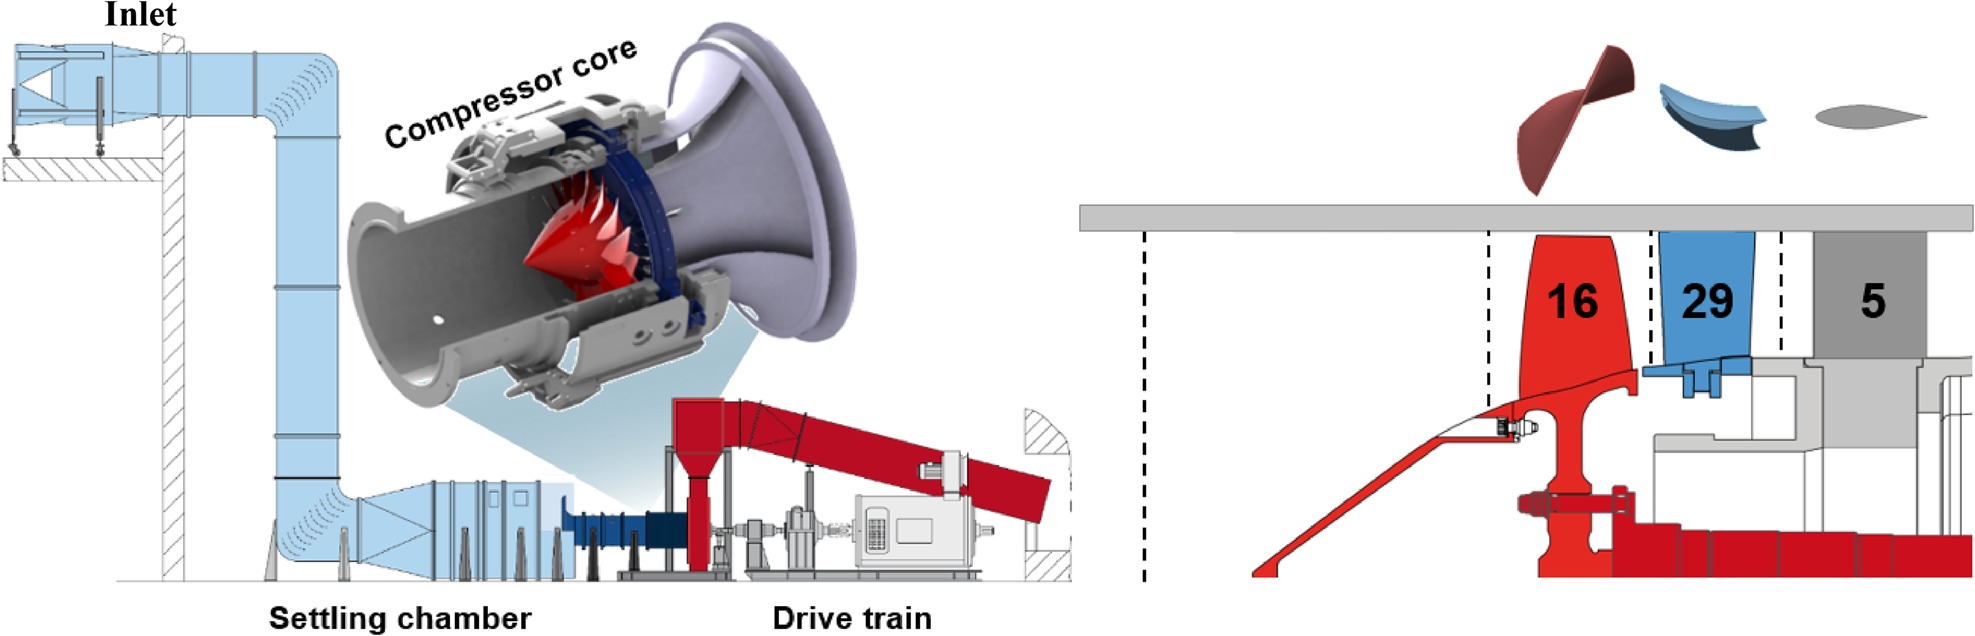
The compressor core is designed modularly, to enable quick and easy turnarounds between different configurations, for example varying the rotor, casing inserts or instrumentation. The TUDa-GLR-OpenStage, as shown in Figure 1 represents a high pressure compressor front stage, comprising a BLISK rotor (16 blades) with rotating nose cone, designed by MTU Aero Engines AG, and an 3D-optimized stator (29 Vanes), designed by the Institute of Gas Turbines and Aerospace Propulsion at TUDa (Bakhtiari et al. (2015)) and the German Aerospace Center (DLR). Additionally, it includes outlet struts (5) and a casing module to provide the defined rotor tip clearance and instrumentation access. Table 1 summaries specific information with respect to the TUDa-GLR-OpenStage.
Measurement systems & instrumentation
The test rig and especially the compressor core are extensively equipped with instrumentation, applied to several measurement sections (ME), as shown in Figure 2.
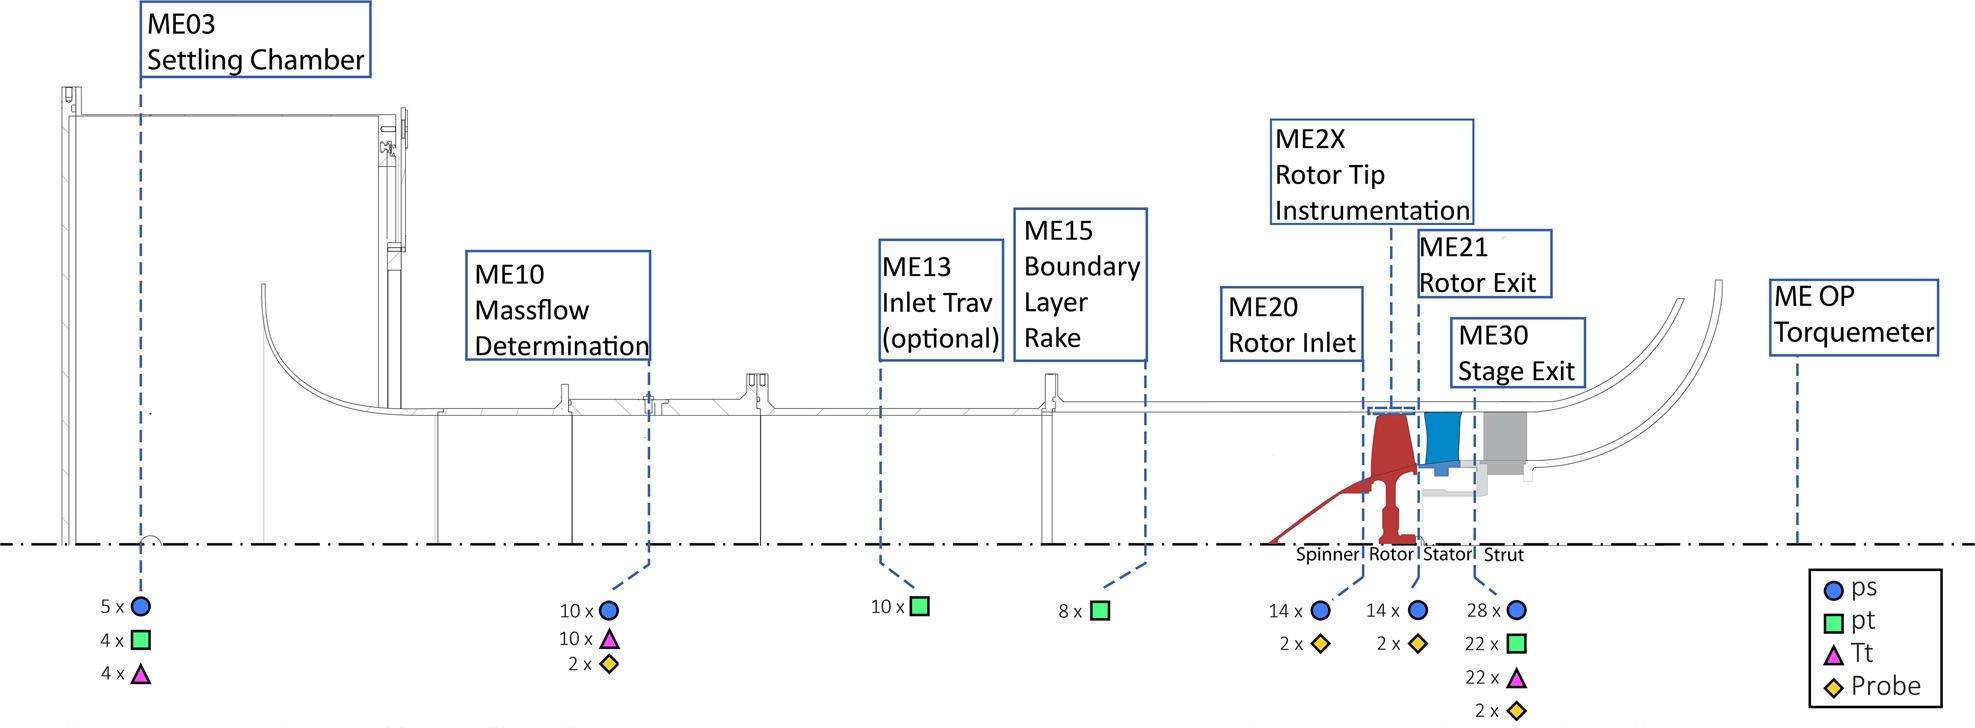
Inlet conditions, including ambient pressure, inlet temperature and humidity, are determined upstream of the test section. Inlet total and static pressure are derived in the settling chamber (ME03). The inlet boundary layer is obtained upstream of the compressor core (ME15) and is used to take the total pressure loss due to the inlet duct into account. The mass flow is determined, using a calibrated bellmouth, between the settling chamber and compressor inlet (ME03 → ME10). Total pressure and total temperature are measured with combined Kielhead probes, radially distributed at rakes in the stage exit (ME30). Torque and rotational speed are determined by a torque meter system (ME OP), connecting the compressor core and gear box. For time-resolved measurements, an additional once-per-revolution trigger is applied to the rotor shaft.
For blade vibration safety monitoring and tip clearance measurements, a capacitive blade tip timing system (see Zielinski and Ziller, 2005) is mounted in the rotor casing (ME2X). The unsteady flow phenomena at the rotor blade tip region are resolved by a variety of unsteady wall pressure transducers (WPT) in the stationary frame of reference. Up to 70 miniaturized sensors are flush-mounted in axial arrays as well as several circumferential positions and sampled with 500 kHz. The axial arrays cover the whole axial blade chord length and an extension upstream, in order to resolve flow features, such as the tip leakage vortex, and interactions with the shock. The circumferentially distributed sensors are mainly located at the blade leading edge, enabling spectral analysis of aerodynamics and aeroelasticity effects.
For detailed aerodynamic investigations, five-hole probe (5HP) and unsteady pressure probe measurements can be conducted in several measurement sections (ME20, ME21, ME30). The probe is equipped with a Kulite sensor, enabling sampling rates of up to 500 kHz. To predict the unsteady flow parameters, the probe is operated as a virtual three-hole probe (v3HP), measuring at three different probe angles (+45°/0°/−45°) for each grid point. Thus, total pressure, Mach number and flow angles can be determined within the rotating frame of reference (see Hormel et al., 2019; Jüngst, 2019).
The rakes and traversable probes are aerodynamically calibrated at an in-house calibration wind channel, enabling Mach numbers within the range of expected operating conditions. Additionally, the unsteady pressure probe and wall pressure transducers are dynamically calibrated in a shock pipe.
Test & analysis procedures
Typically, the experimental studies include both steady-state and transient measurements at varying operating conditions, as schematically illustrated in Figure 3 left. This includes transient acceleration sweeps (1) to determine synchronous blade vibrations as well as multiple unsteady throttling manoeuvres (2) at different speeds to map the compressor operating range and determine the stability limiting phenomena during stall inception. As the initial open test case data set does not include data from transient manoeuvers this work focuses on steady state data acquisition only.
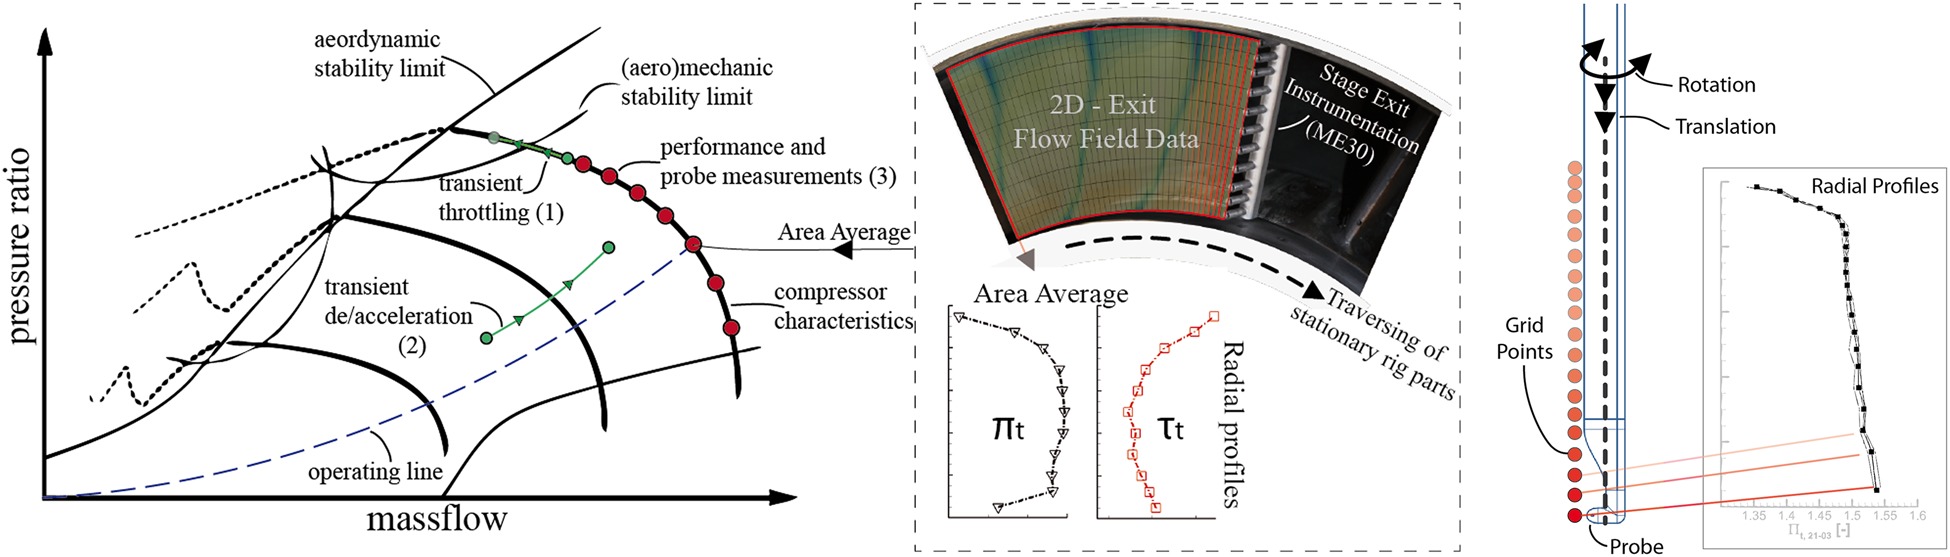
For performance determination and probe measurements (3), steady-state measurements are carried out along defined compressor characteristics. The operating points are defined by the corresponding reduced mass flow and reduced speed flow (Equation 1 and 2), determined with the stagnation temperature and the total pressure obtained in the settling chamber (ME03).
For each operating point (e.g. near choke (NC), peak efficiency (PE) and near stall (NS)), all non-rotating vane rows are clocked synchronously to provide several relative positions with respect to the fixed mounted instrumentation. Hence, two-dimensional (2D) exit flow fields can be measured, as shown in Figure 3. By averaging the data for each channel height in circumferential direction, radial profiles (1D) are derived. Area averaging (index aa) the entire two-dimensional flow field results in representative mean values, calculated for the corresponding single operating points in the compressor map (0D). With this measurement procedure the compressor total pressure ratio, total temperature ratio and isentropic efficiency can be determined (Equations 3–5). The used isentropic coefficient γ takes the influence of varying ambient temperature and humidity into account.
At certain operating points probes are traversed in radial direction in the rotor inlet and exit planes, thus radial profiles of flow quantities, such as total pressure, flow angle and Mach number are determined. Depending on the investigation target, radial traverses are performed at multiple clocking positions of the non-rotating vane rows to derive two-dimensional flow field information equivalently to the procedure described above. The probe traversing system enables translation and rotation of the probe shaft, enabling the probe to follow the main flow direction.
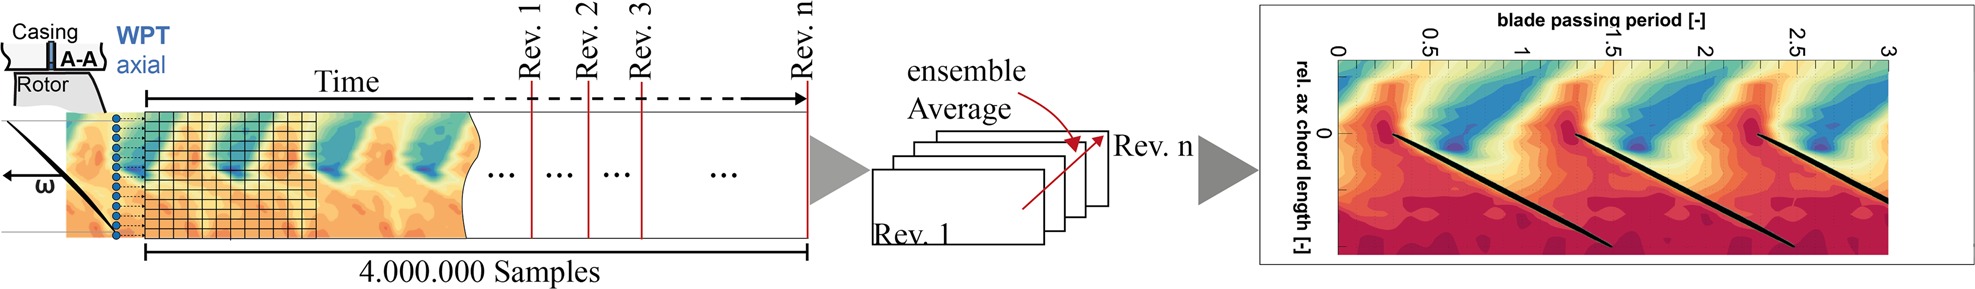
For steady and transient measurements, the unsteady measurement systems monitor the unsteady rotor tip flow as well as blade vibrations and rotor tip gap. To obtain the average rotor tip pressure field in the rotating frame of reference for a given operating point, the data is split into single revolutions and ensemble averaged. Thus, enabling the investigation of distinct rotor passages as shown in Figure 4. Additionally, single revolutions and spectrograms can be used to investigate transient manoeuvers, such as stall inception (not shown for brevity).
Results and discussion
Based on the described facility, instrumentation and methodologies, an open test data set has been provided by TUDa and will be expanded within the upcoming years. The initial data set contains aerodynamic data at rotor exit (ME21), stage exit (ME30), rotor tip (ME2X) and the corresponding inlet and operating point conditions (including the rotor tip gap) for several operating points along a subsonic speedline (N65) and design speedline (N100). The following section gives an overview on the available data.
Inlet & operating point conditions
Knowledge of the inflow conditions is crucial for comparison of different compressor configurations and especially for validation of and comparison with simulations. Additionally, it is important to retain constant and homogeneous inlet conditions. Therefore, a variety of measurements are performed upstream the compressor stage. For defined operating conditions, 360° traverses have been performed in the traversable inlet section (ME13). Figure 5a shows the total pressure loss at N100, peak efficiency (PE). An almost homogenous profile for the whole inlet area is evident. Close to the wall the influence of the fully developed turbulent boundary layer is clearly identifiable and also shown in Figure 5b for several operating conditions from near choke (NC) to near stall (NS). Except for the boundary layer, the flow variations in radial and circumferential direction are marginal within the inlet, which is also shown by Hormel et al. (2019).
Figure 5.
Inlet conditions and tip clearance. (a) Inlet traverse (b) Boundary layer (c) Tip clearance.

Besides the inflow, it is necessary to determine the operating conditions as detailed as possible. Here, not only aerodynamics and rotor speeds are relevant, but especially the rotor tip clearance plays an important role. Using the aforementioned capacitive blade tip timing system, the actual tip gap is determined for online monitoring and can also be calculated for all operating conditions during post-processing. Figure 5c (left) shows the average tip clearance for the nominal speedline. The increasing blade loading and warmer rotor casing results in an increased tip gap from choke to stall by more than 10%. Thus, the influence in change of tip gap is not neglectable and should be considered when comparing CFD simulations to the experimental test data. Additonally, the tip clearance is not constant along the axial chord length of the blade but is smaller at the leading edge (LE) than the trailing edge (TE) (Figure 5c right).
Performance & steady aerodynamics
Figure 6 illustrates the compressor map of the TUDa-GLR-OpenStage, including selected characteristics, both at design and part speed, transonic (N100) and subsonic (N65) conditions respectively. Besides the stage total pressure ratio, the isentropic efficiency is plotted. The peak efficiency point as well as the last stable operating point are highlighted correspondingly. For all shown operating points at the N65 and N100 speedline, radial profiles and 2D flow fields of total temperature and pressure at the stage exit are included in the test case, as shown in Figure 7. Rotor exit flow field data is available at the indicated PE and NS conditions.
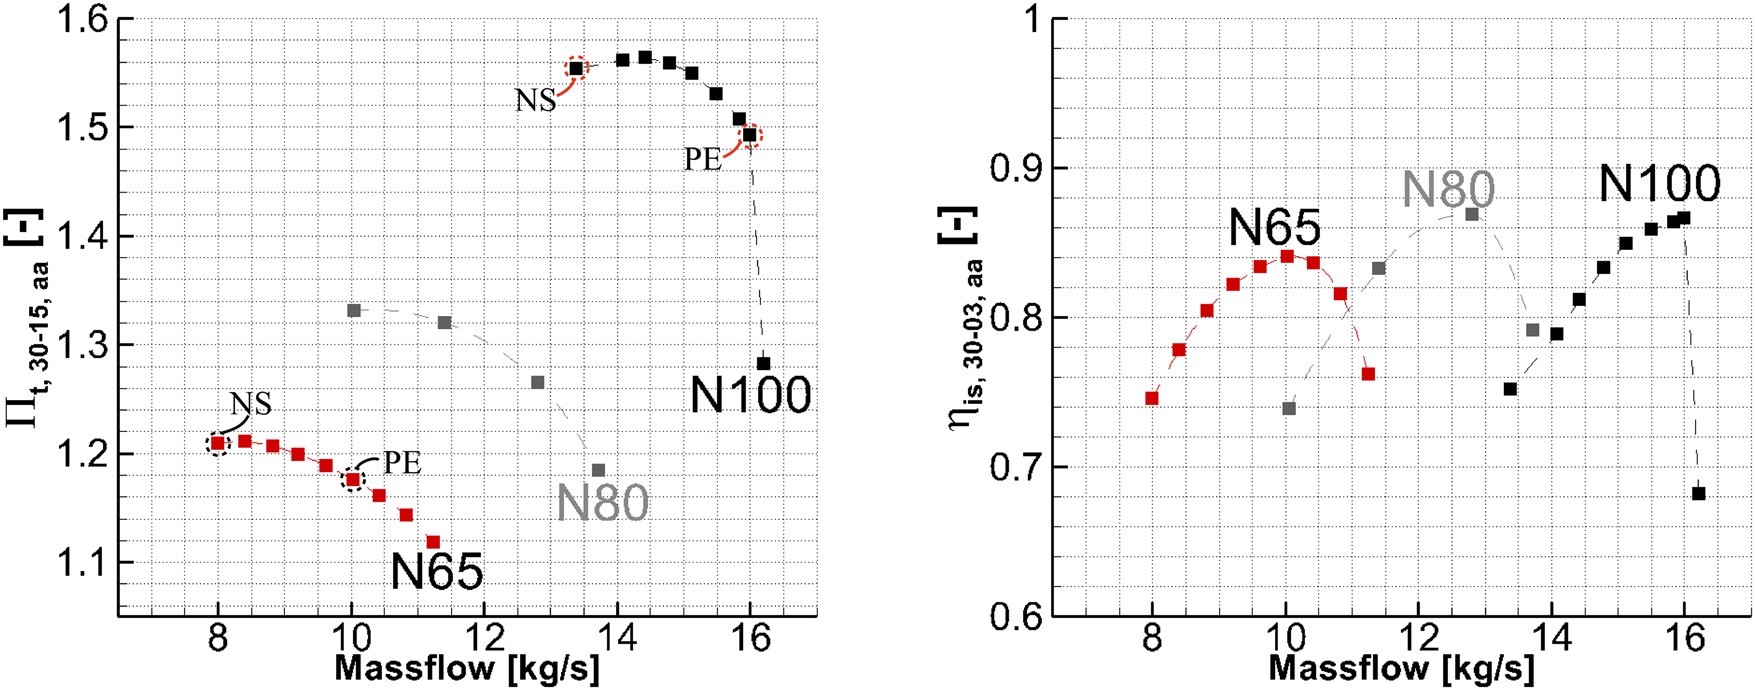
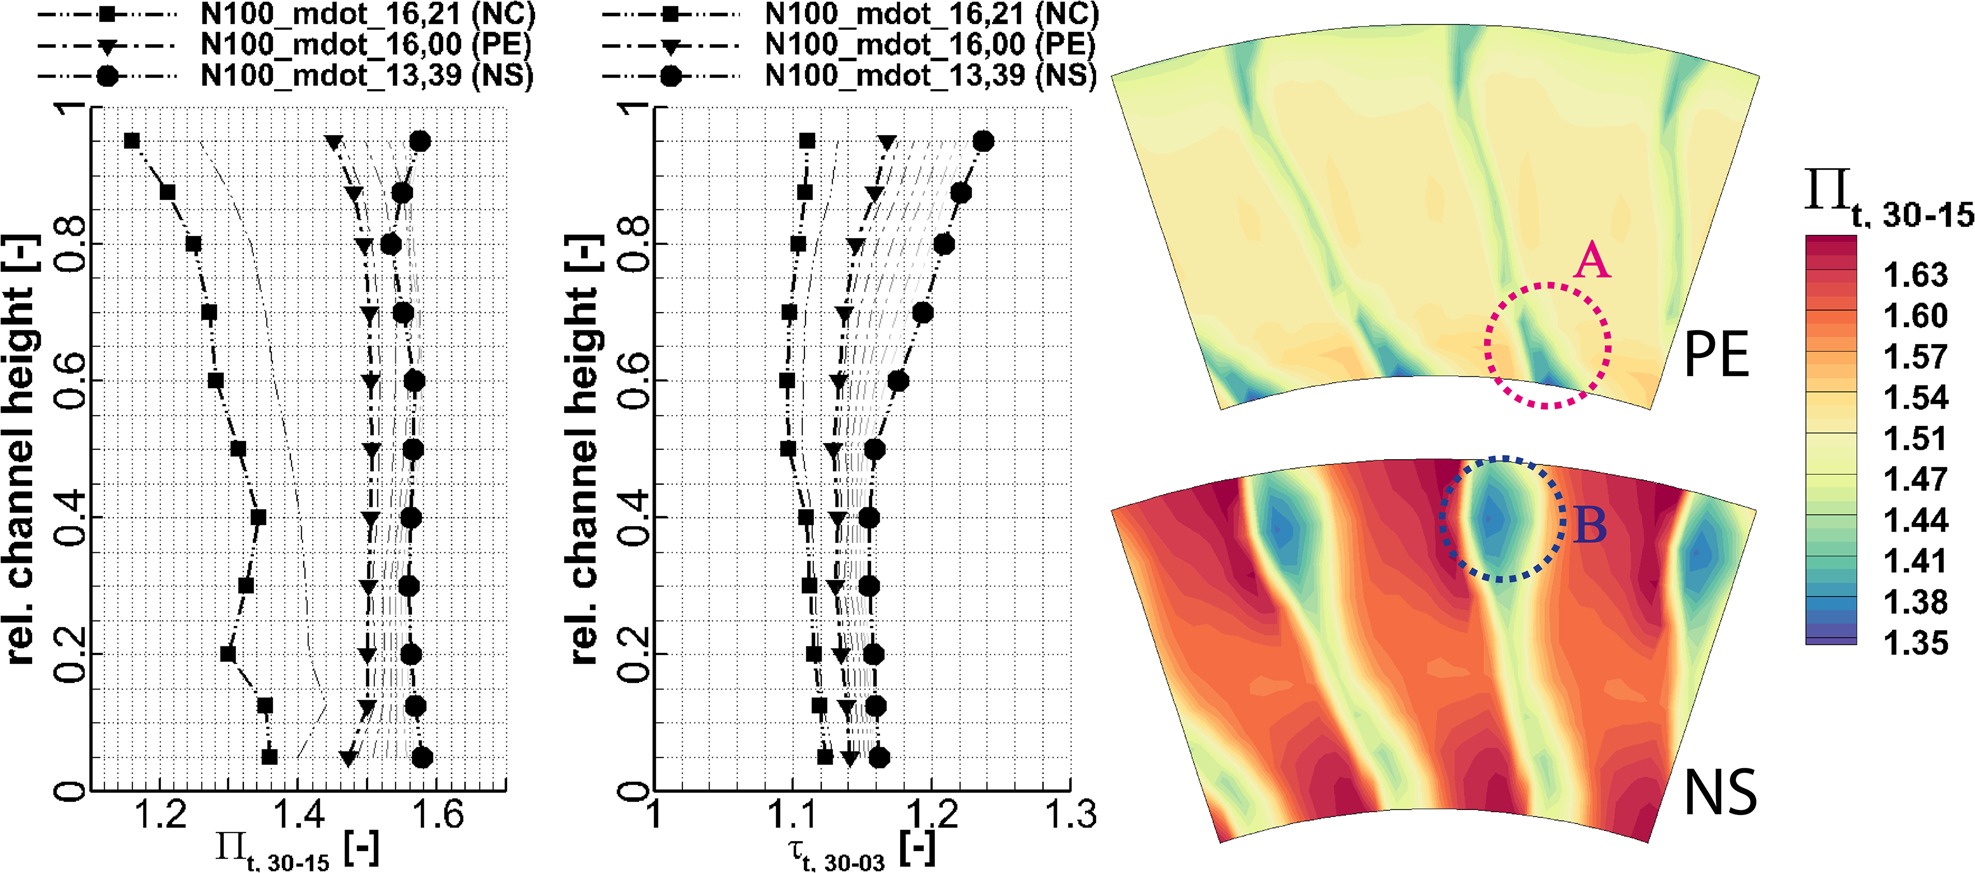
The radial total pressure and total temperature profiles indicate the varying operating conditions along the speedline, from NC to NS. Within the 2D pressure fields, the stator wake is clearly visible (Figure 7, marker A), based on the corresponding pressure loss. Especially at operating conditions with increased throttling, flow separation phenomena at the stator suction side are indicated (see Figure 7, marker B).
Table 1.
TUDa-GLR-OpenStage key characteristics.
| Max. Power | Max.Torque | Design Speed | Design Mass Flow | Shroud Radius | Tip Gap | Rotor Blades | Stator Vanes |
|---|---|---|---|---|---|---|---|
| 800 kW | 350 Nm | 20,000 rpm | 16 kg/s | 189.2 mm | 0.8 mm | 16 | 29 |
Table 2.
Measurement system accuracy.
Table 3.
Uncertainty in reduced speed and mass flow.
| n (rpm) | tt03 (K) | ps03 (Pa) | ps10 (Pa) | tt03 (K) | ||||
|---|---|---|---|---|---|---|---|---|
| Systematic | 11 | 0.25 | ±0.1% | systematic | 17 | 17 | 0.25 | ±0.08% |
| Stochastic | 1 | 0.7 | stochastic | 6 | 40 | 0.7 |
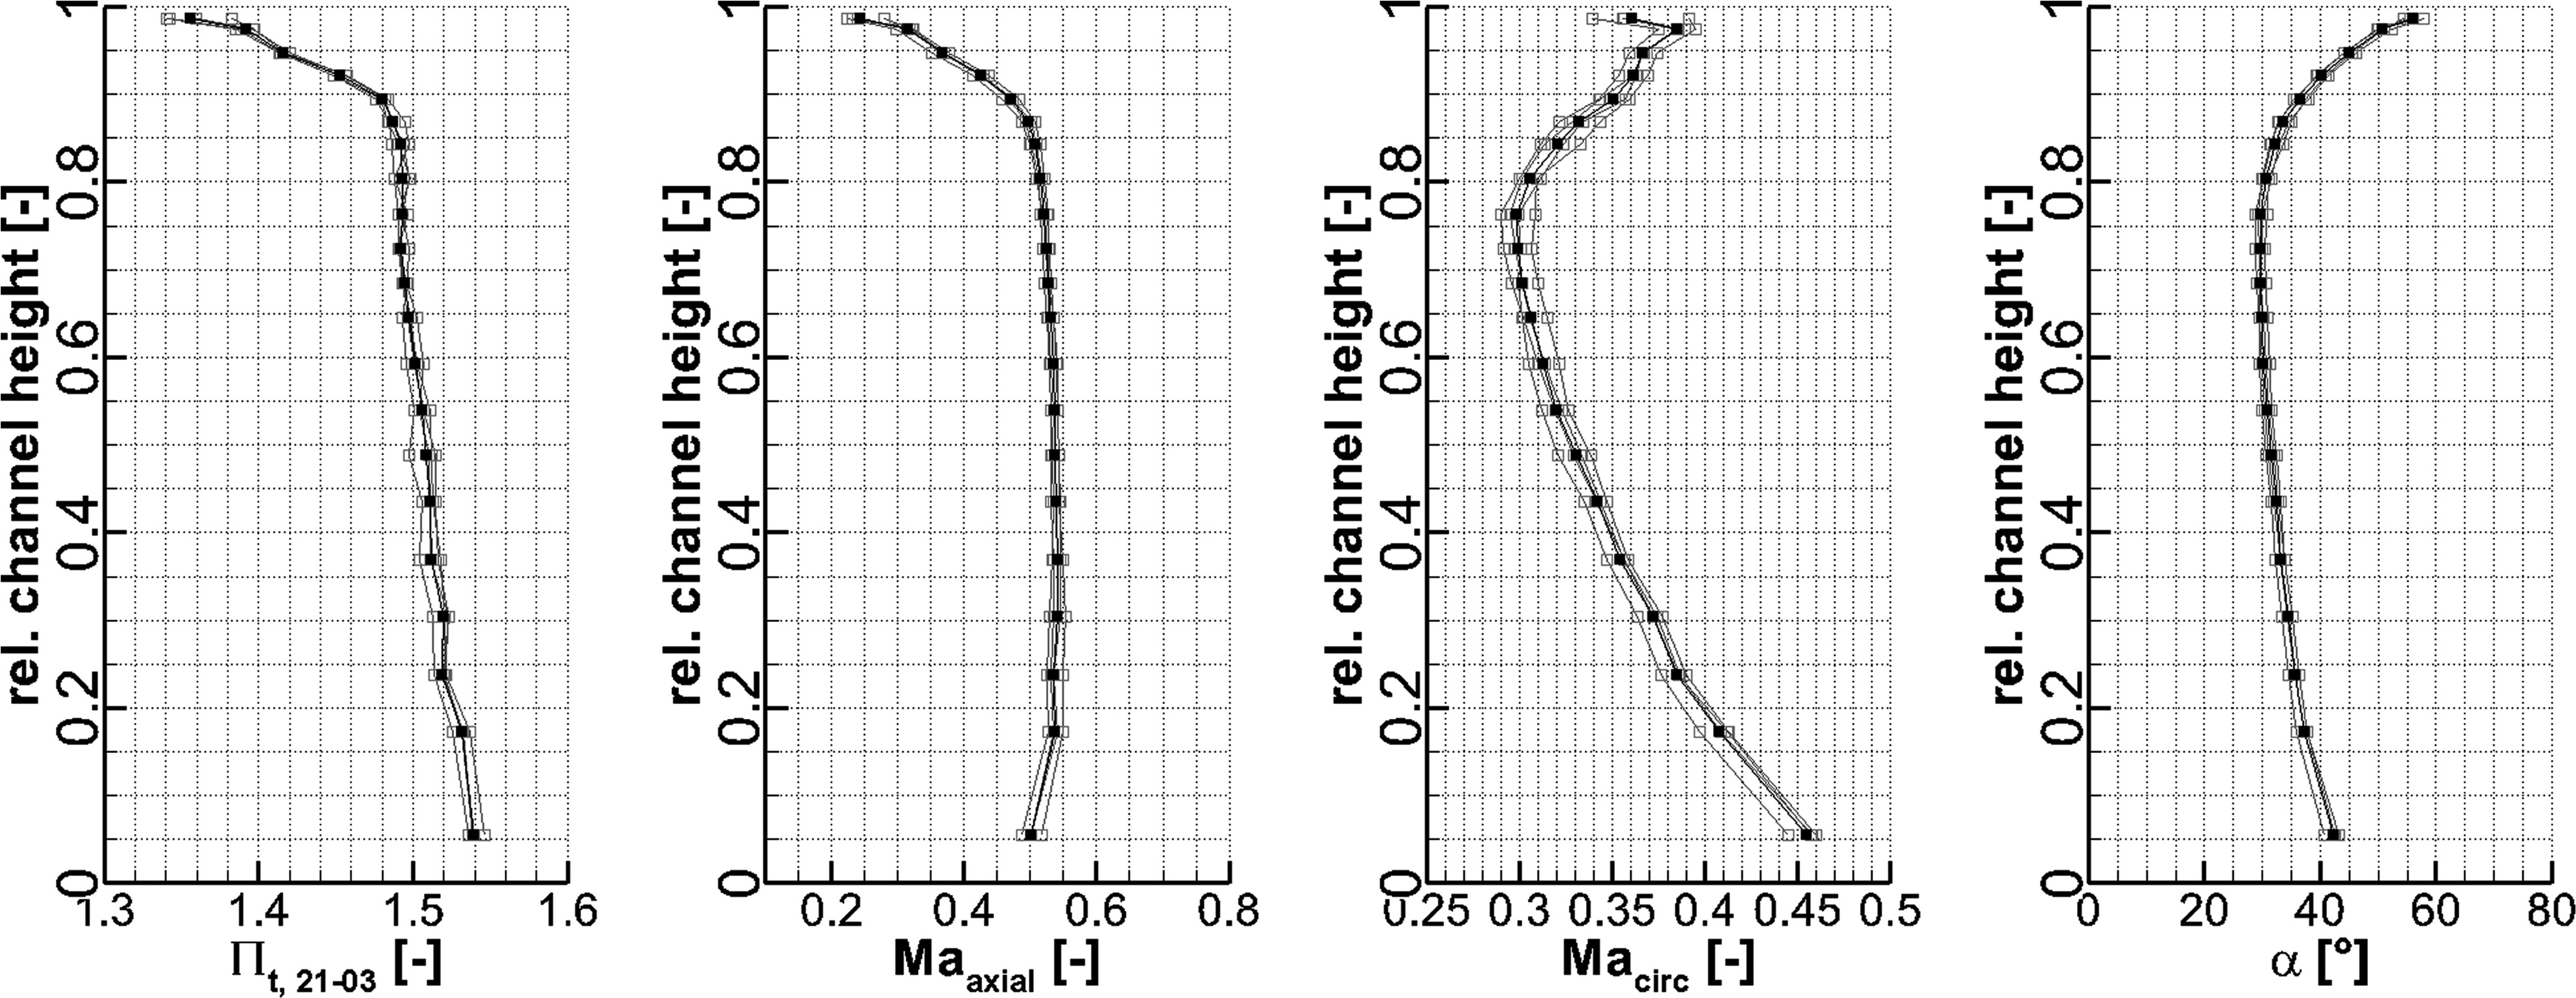
Detailed investigations of the steady aerodynamics within the compressor stage are performed with traversable 5HPs for PE and NS conditions. Figure 8 exemplarily shows the resulting averaged flow quantities such as total pressure ratio as well as axial and circumferential (circ) Mach numbers within the rotor exit for N100 PE. To derive the average radial flow quantities, multiple stator relative clocking positions are measured (grey lines), thus a potential influence of the stator is taken into account. This is done for all probe measurements within the open test case (5HP and v3HP).
Unsteady aerodynamics
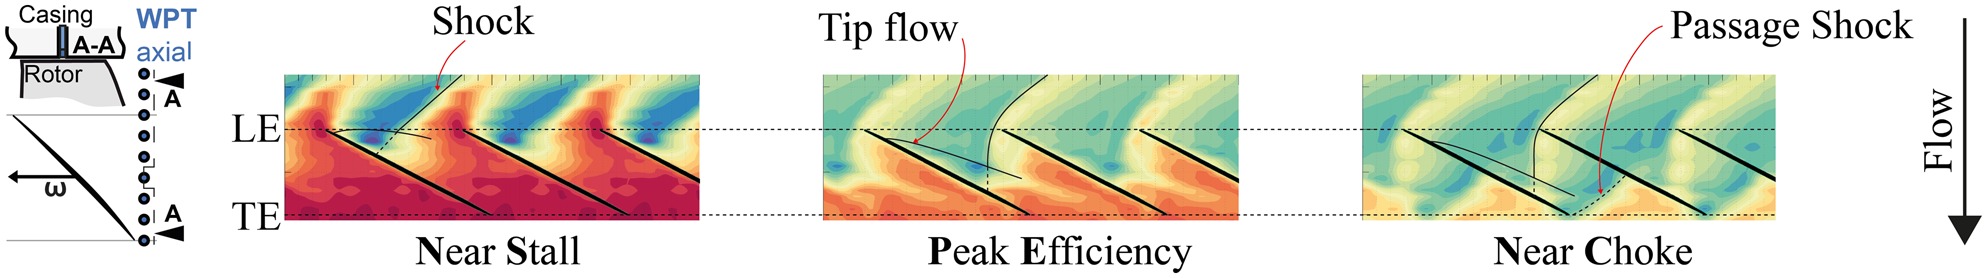
The unsteady wall pressure at the rotor blade tip is used to analyze aerodynamic loading, secondary flow phenomena and shock position. Figure 9 illustrates ensemble averaged flow fields for NC, PE and NS operating conditions at design speed. The blade loading increases with rising backpressure. Due to the supersonic relative flow conditions at nominal speed a shock occurs in front of the rotor leading edge which is indicated by a sudden pressure rise. While the backpressure is increased the shock detaches from the rotor leading edge. Simultaneously, the low pressure area of the tip leakage flow moves upstream towards the leading edge and the induced blockage zone within the passage rises.
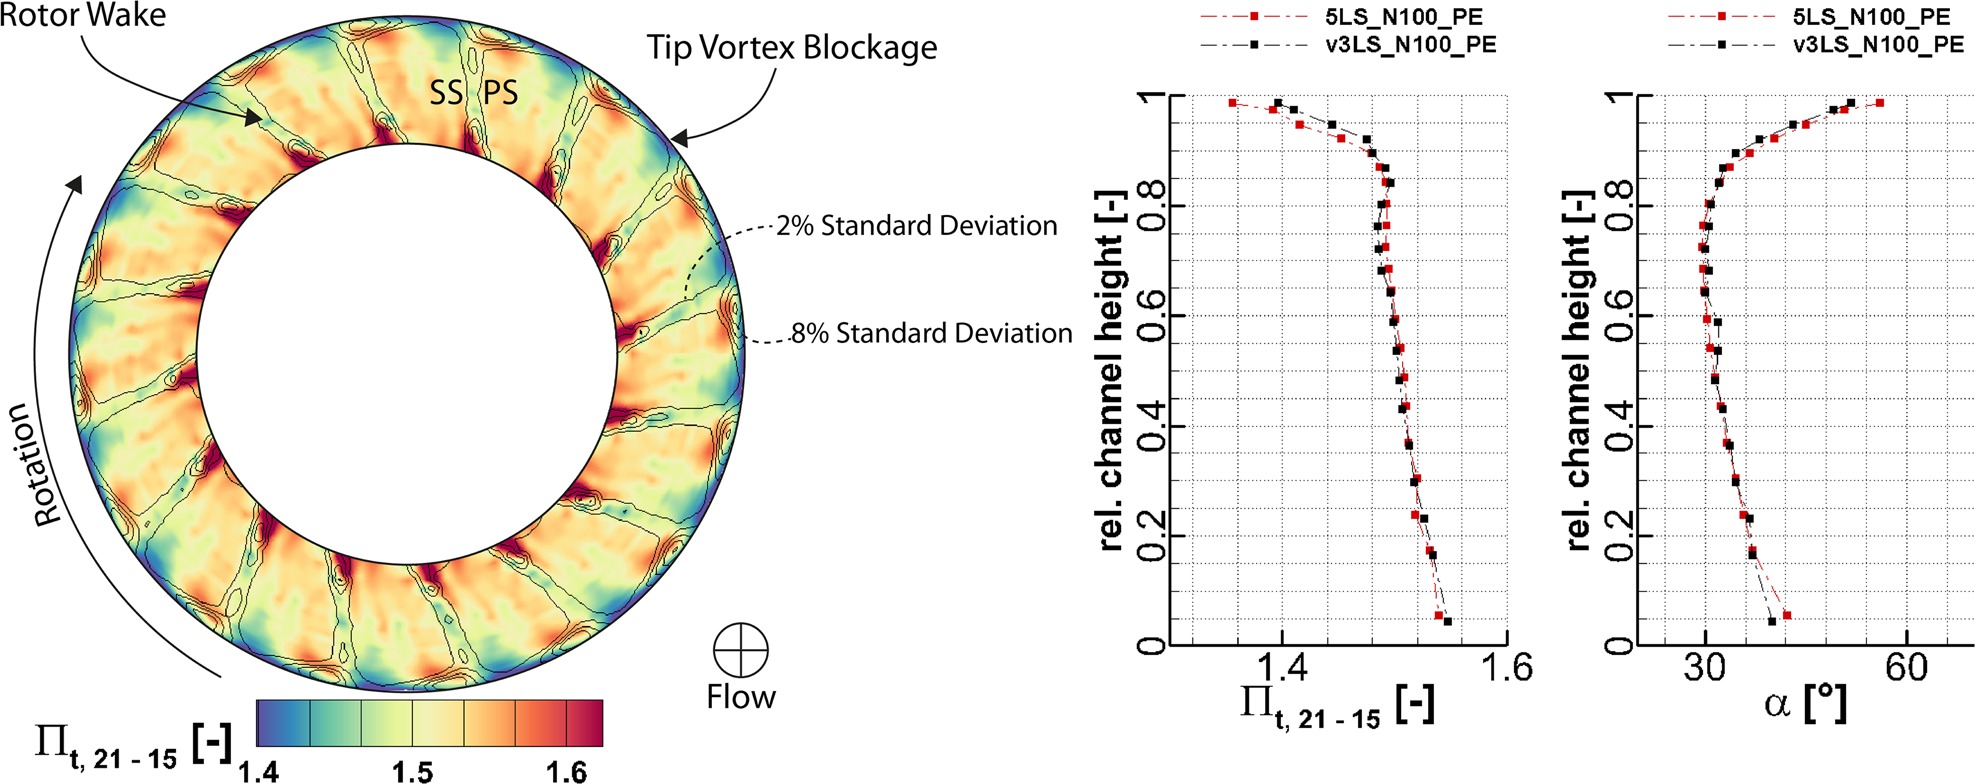
In addition to the steady 5HP and time-resolved WPT data, v3HP measurements provide more detailed insights into the aerodynamics in the rotor relative frame of reference. Figure 10 shows the ensemble-averaged rotor relative total pressure ratio downstream the rotor for N100 PE. Black solid lines indicate different levels of total pressure fluctuation. The rotor wake is clearly indicated by lower total pressure rise and an increased level of total pressure fluctuations. The tip leakage flow vortex leads to a blockage zone within the rotor passage, causing a low pressure area at the rotor suction side within the tip region. The radial profiles show the comparison between the in-house developed v3HP and 5HP for the same operating conditions, showing good agreement for both, the total pressure and flow angle within the rotor exit flow.
Measurement uncertainty
To achieve the goal of establishing a standard test case for compressor CFD, knowledge about the data reliability is crucial, thus a detailed uncertainty analysis has to be conducted for the Open Test Case. To quantify an absolute measurement uncertainty for a compressor rig is challenging (e.g. Eitenmüller et al., 2019). It has to be differentiated between uncertainties due to the measurement systems (e.g. uncertainties of the used data acquisition systems, probe application, probe calibration, measurement procedure) and due to the rig (e.g. operating conditions, manufacturing tolerances). Each measurement system has to be considered individually (e.g. performance mapping, 5HP, WPT) and can not be described in detail within the frame of this work. Hence, the following section only discusses the uncertainty for global compressor characteristics determination.
To obtain the total pressure and temperature ratio the measurement systems in the inlet section (ME03 and ME15) and the exit section (ME30) are used. For the inlet quantities, pressure scanners with a measurement range of 5 PSI are used, for the stage exit scanners with a range of 15 PSI accordingly. The inlet temperature (ME03) is measured with four PT-100 resistance temperature detectors (RTD), the stage exit temperature with Type-K thermocouples. A conservative estimation of the corresponding measurement systems accuracies is listed in Table 2 and represents the systematic error of the measurement system, neglecting possible geometric influences.
The uncertainty for a single probe position can be derived from the measurement system accuracy and the measurement precision. The precision can be understood as the fluctuations of the mean values and is strongly depending on the operating condition and the spatial position of the probes and represents the stochastic error. Within the used measurement procedure the data acquisition time is set equally for all measurements, but the convergence time of mean value and standard deviation differs, due to varying flow conditions. Thus, a varying number of uncorrelated measurements (see Tropea et al., 2007) is performed within each clocking position. For simplification, this study considers the standard deviation of all samples to be the stochastic error.
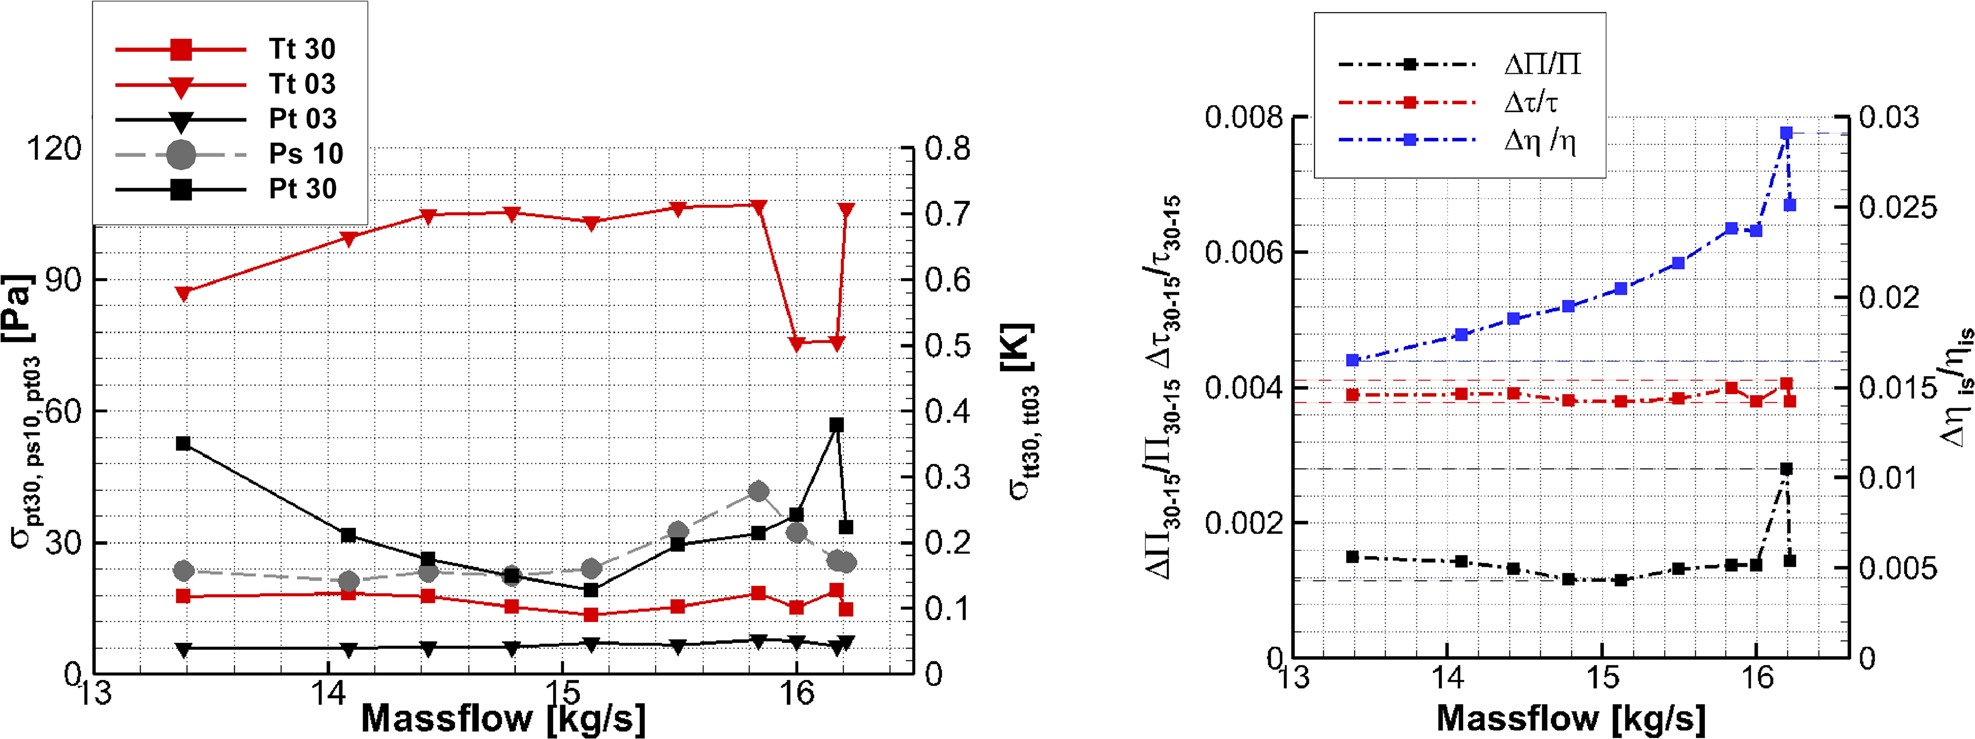
As a conservative approach the exit rake position with the highest standard deviation in total pressure and total temperature is used to determine the uncertainty for the nominal speedline as shown in Figure 11. The highest standard deviation for the most relevant measurement sections is shown on the left. The deviation in total pressure rises towards the choke and stall limits, whereas the deviation in inlet conditions stays constant for the whole speedline. The temperature deviation stays constant for most of the nominal speedline, with significantly high deviations for the inlet temperature, which is most likely due to the used measurement hardware. Propagating both uncertainties, systematic and stochastic, the shown uncertainty for total pressure ratio, total temperature ratio and isentropic efficiency can be derived for the nominal speedline. The statistic error propagation is done via a Monte-Carlo Simulation, while the influence of the systematic error is propagated separately and added to the stochastic uncertainty. The uncertainty in total pressure ratio lies within the range of less than 0.3%. The relative uncertainty in isentropic efficiency rises when lowering the compressor back pressure, due to the lower temperatures and pressures at the stage exit. The relative uncertainty in total temperature stays at a level of 0.4% whereas the uncertainty in isentropic efficiency reaches its peak at 2.9% close to choke. As this approach takes the position with the highest standard deviations into account this is applicable for all radial and circumferential positions at the rotor exit. Investigations at part speed show similar results.
This illuminates uncertainties related to the measurement system as well as the stochastic fluctuations and is determined with similar approaches as already published in earlier investigations, it does not include the influence of uncertainties due to the rig (also see Jüngst, 2019).
To estimate the most relevant rig related uncertainty, an error propagation has to be applied on the determination of reduced mass flow and reduced speed accordingly, thus leading to an uncertainty in rig operating conditions.
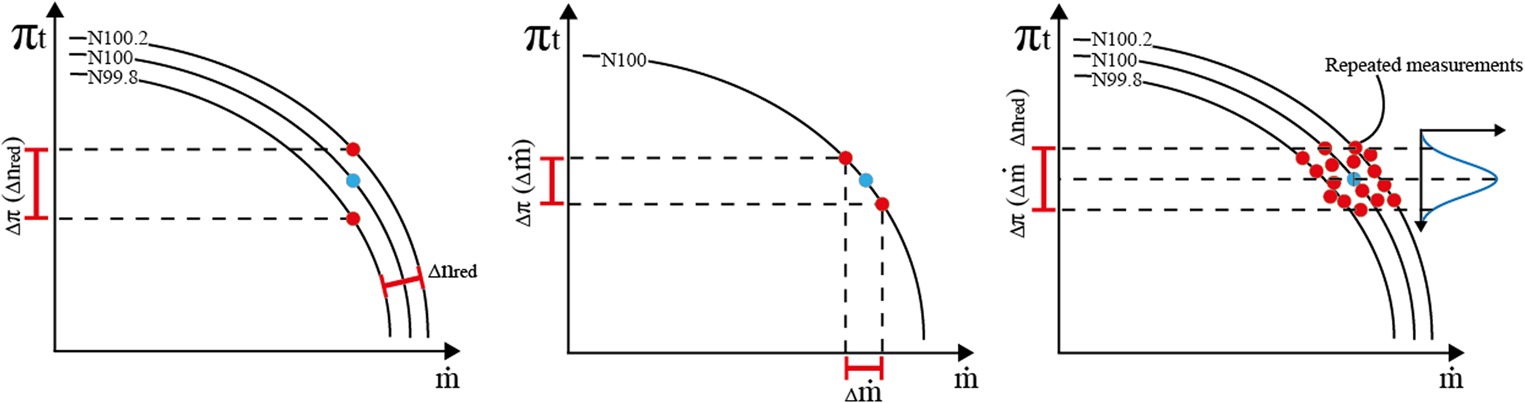
Table 3 lists the relevant stochastic and systematic errors and the resulting uncertainty in reduced mass flow and reduced speed. To estimate the impact on total pressure ratio and efficiency a sensitivity analysis has to be conducted. Figure 12 illustrates the impact of the uncertainty in reduced speed and reduced mass flow on the uncertainty in total pressure ratio. To quantify this, the authors aim to conduct a numerical study that analyses the sensitivity of total pressure and temperature ratio as well as isentropic efficiency to all relevant non dimensional parameters (e.g.
Conclusions
In order to tackle current and future challenges with respect to turbomachinery applications, high TRL test cases play a vital role to enhance numerical models and validation. Therefore, the Transonic Compressor Darmstadt at Technical University of Darmstadt provides the TUDa-GLR-OpenStage data set, including detailed geometry information and extensive up to date experimental results. With steady and unsteady data for steady-state measurements at transonic and subsonic operating conditions, as well as time-resolved probe data, various topics can be addressed.
This paper gives a comprehensive introduction into the data set, corresponding geometries, measurement and analysis procedures and exemplary experimental results.
The test case shall foster international research collaborations and a common validation case for numerical applications as well as advanced methods, for example joint approaches using simulations, experimental data and machine learning.
The data set of the TUDa-GLR-OpenStage is available at glr.tu-darmstadt.de.
Abbreviations
5HP
Five Hole Probe
BLISK
Blade-integrated Disk
GLR
Institute for Gas Turbines
ME
Measurement Section
NC
Near Choke
NS
Near Stall
OP
Operating Point
PE
Peak Efficiency
TCD
Transonic Compressor Darmstadt
TRL
Technology Readiness Level
TUDa
Technical University of Darmstadt
v3HP
Virtual Three Hole Probe
WPT
Wall Pressure Transducer