Introduction
To reduce specific fuel consumption and increase the thermal efficiency of jet engines, higher turbine entry temperatures are targeted. This results in a higher thermal load of turbine blades, which need to be cooled more effectively to prevent failure or reduction of lifespan. In state-of-the-art turbine blades multiple methods, like film cooling and different internal turbulators, are used at the same time. These methods gained complexity over time (Bunker, 2017). This multi-method concept makes predictions of the cooling performance difficult due to variations in operating conditions and manufacturing tolerances. Therefore manageable and more predictable designs are desired. A cooling method, which is supposedly simpler in design and therefore less susceptible to manufacturing tolerances is the cyclone cooling (also called swirl or vortex cooling).
For cyclone cooling, a swirling flow is created in the cooling channel inside the blade, which can lead to high tangential velocities near the wall. Additionally, in highly swirling flows a recirculation zone at the center of the flow is created due to vortex breakdown (Hall, 1972), which results in a high near-wall axial velocity. With higher velocities, turbulence and mixing are intensified and heat transfer is enhanced (Chang and Dhir, 1995), which is, amongst others, attributed to Görtler vortices on the concave channel walls (Hedlund et al., 1999). This way, more heat can be exchanged by the coolant, yielding a lower blade surface temperature. Following the early thermal investigations of cyclone cooling in swirl tubes (Glezer et al., 1996; Hedlund and Ligrani, 2000), more sophisticated experimental studies were done to analyze the internal flow structure in swirl tubes (Biegger et al., 2013) with different channel outlet geometries (Grundmann et al., 2012) and duct bends Wassermann et al. (2013), Bruschewski et al. (2020) and Wang et al. (2021). Numerical studies were carried out to understand the swirling flow in detail Biegger et al. (2015) and Seibold and Weigand (2021), but the investigated geometries are still too simplified compared to the geometry of a real turbine blade. The effect of the swirling flow on the film cooling performance was investigated experimentally with the result that the orientation of the film cooling holes with respect to the swirl influences the discharge through the holes and thereby the film cooling effectiveness (Lerch et al., 2012). The total cooling effectiveness TCE, which is defined as
with the hot gas inlet temperature Th,1, the coolant inlet temperature Tc,1 and the local surface temperature TS(X→) was numerically determined for a semi-realistic vane geometry with a shower head configuration (Du et al., 2019). It was found, that the proposed designs led to an enhancement of TCE at a higher coolant inlet pressure. In the work preceding this study (Elfner et al., 2017), a test rig was designed to assess the cyclone cooling concept for a single realistic turbine rotor blade under scaled engine-like conditions. The total cooling effectiveness was determined by means of infrared thermography. Different swirler geometries for the generation of the inlet swirl were used and compared to a baseline geometry without an internal swirling flow (Elfner et al., 2018). It was shown that the tested designs resulted in a lower cooling effectiveness at the leading edge and equal or higher TCE on the remaining surfaces. This was partly attributed to the inlet conditions of the film cooling holes, which are negatively affected by the high tangential velocity component, resulting in a reduced mass flow through these holes. It was shown again, as by Lerch et al. (2012), that the film cooling needs to be adjusted to the cyclone design to gain an overall increase in cooling performance. In the present study, the low total cooling effectiveness at the leading edge is targeted. For this, the diameter of the holes at the leading edge are enlarged to increase the mass flow and thereby the film cooling performance. The effect of the film cooling hole diameter on the overall cooling performance of a realistic cyclone-cooled blade has to date, to the authors’ knowledge, not been studied. It is expected, that this local change of a single feature will affect the whole blade cooling system.
Test rig
The tests are performed in the same test rig as described by Elfner et al. (2017), which is shown in Figure 1. It is designed to study a single turbine blade with a scaling factor of 3. The rotor blades are investigated in a non-rotating test rig. Swirling flows are, compared to axial flows, less affected by rotation as shown by Winter (2010). The correct inflow conditions are implemented with a flow conditioner upstream of the blade, which adjusts the incoming flow angle and radial mass flow distribution. The blade is made of Ti6Al4V to ensure Biot number similarity for the steady-state conjugate heat transfer tests. Three optical accesses (oa) are implemented for infrared thermography. The correct outflow Mach number and Mach number distribution on the pressure and suction side of the blade is adjusted with movable tailboards on the pressure and suction side. The tailboards are adjusted with a separate test blade, which includes static pressure holes on the blade surface to determine the Mach number distribution.
Figure 1.
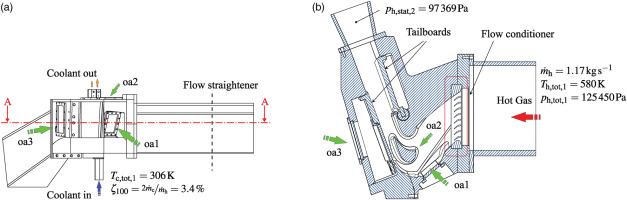
A blade tip gap is not included in this test rig. The coolant is discharged through the film cooling holes and the blade tip at two outlets (see Figure 1a). The mass flow rate at each outlet can be controlled. This allows the adjustment of the total film cooling mass flow rate. The major operating parameters are displayed in Figure 1. Cascade inlet conditions are indexed with “1” and outlet conditions with “2”. The coolant mass flow rate can be varied. It is defined as the ratio of the cooling air to hot gas mass flow rate and described by ζ. The nominal value for ζ is 3.4% (=ζ100). Based on this value the coolant mass flow rate is decreased to 90% (ζ90) and increased to 120% (ζ120) in the tests.
Blades
The present cyclone cooling scheme is designed to be an improvement of a modern, state-of-the-art internal cooling design. The internal cooling schemes are shown in Figure 2. On the left side, the cross-section view of the blade with a conventional cooling design consisting of multipass channels, ribs to enhance internal heat transfer coefficient and film cooling holes is shown. The ribs are present in each channel. The names of the film cooling hole rows are specified and will be used in the following. SS-LE, PS-LE and PS-TE are rows of cylindrical holes. SS-FS and PS-FS are rows of fanshaped holes. The cross-section view of the cyclone blade is displayed on the right side with the additional illustration of the multipass flow. The coolant is fed to the leading edge (LE) channel, which flows via two U-bends to the mid and trailing edge (TE) channel. The first two channels at the front part of the blade in the conventional design are replaced by one greater channel (LE channel) with no turbulators for the cyclone design. The channels downstream (mid and trailing edge channel) and the film cooling configuration is the same for both designs. The shown conventional and cyclone design is analyzed in Elfner et al. (2018). In the present study, a modification is implemented to the cyclone design, which is called the baseline (BSL) design in the following. To improve the cooling effectiveness at the leading edge, the holes in the rows SS-LE and PS-LE are enlarged from a diameter of 1.20mm to 1.55mm. The cyclone blade with the enlarged holes at the leading edge is the modified (MOD) design.
Figure 2.
Cooling scheme for the conventional (left) and cyclone design with multipass flow (right) (adapted from Elfner, 2019).
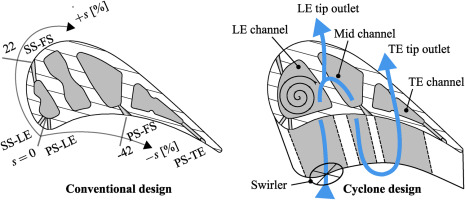
The swirling flow is generated by an axial swirler (OSGi) in the blade root upstream of the leading edge channel. Four variations of this swirler are used: OSG0, OSG3, OSG7, OSG8. A higher number indicates a higher swirl number.
Test cases
The effect of the enlargement of the film cooling holes at SS-LE and PS-LE is experimentally studied for three coolant mass flow rates: ζ90, ζ100 and ζ120 and three swirlers: OSG0, OSG3 and OSG8 to analyze the effect of different swirl numbers. Therefore, nine tests are performed for each blade and thus each diameter. The test results for the baseline case are taken from Elfner et al. (2018). The coolant mass flow rate ζi is set as a boundary condition in this study, leaving the feed pressure as the control parameter, which is modified to achieve the specified mass flow rate for the respective geometry. The coolant mass flow rates are the same for both designs.
Experimental method
The total cooling effectiveness TCE is determined by capturing the blade surface temperature with an infrared camera. For this, a FLIR SC6000 infrared camera with a cooled InSb detector consisting of (512×640) pixels is used. It is sensitive in the wavelength (λ) range of 3μm to 5μm. The images are taken with a focal length of 50mm and extension tubes. The optical accesses are made of sapphire glass. The transmissivity of sapphire glass is temperature dependent for λ≥4μm, which is why a shortwave-pass filter cutting at 4.1μm is used. The blades are coated with a black paint (Nextel Velvet Coating) for a high emissivity. The recorded images are linearized and non-uniformity-corrected (Ochs et al., 2010) to generate High Dynamic Range images. Afterwards, the images are transformed and projected on a CAD model of the turbine blade for further post-processing and more accurate analysis of the test results. Due to the complex, curved blade surface and partially high viewing angles a temperature calibration is done with an angular emissivity correction (Elfner et al., 2018). Finally, single images are stitched on the blade model. The result of this post-processing are spatially highly resolved and accurate surface temperature maps on a 3D model of the real turbine blade enabling improved assessment of the measurement data. The uncertainty of TCE for back-to-back measurements is given with 2.4% for the expected surface temperature range (Elfner et al., 2018).
Numerical setup
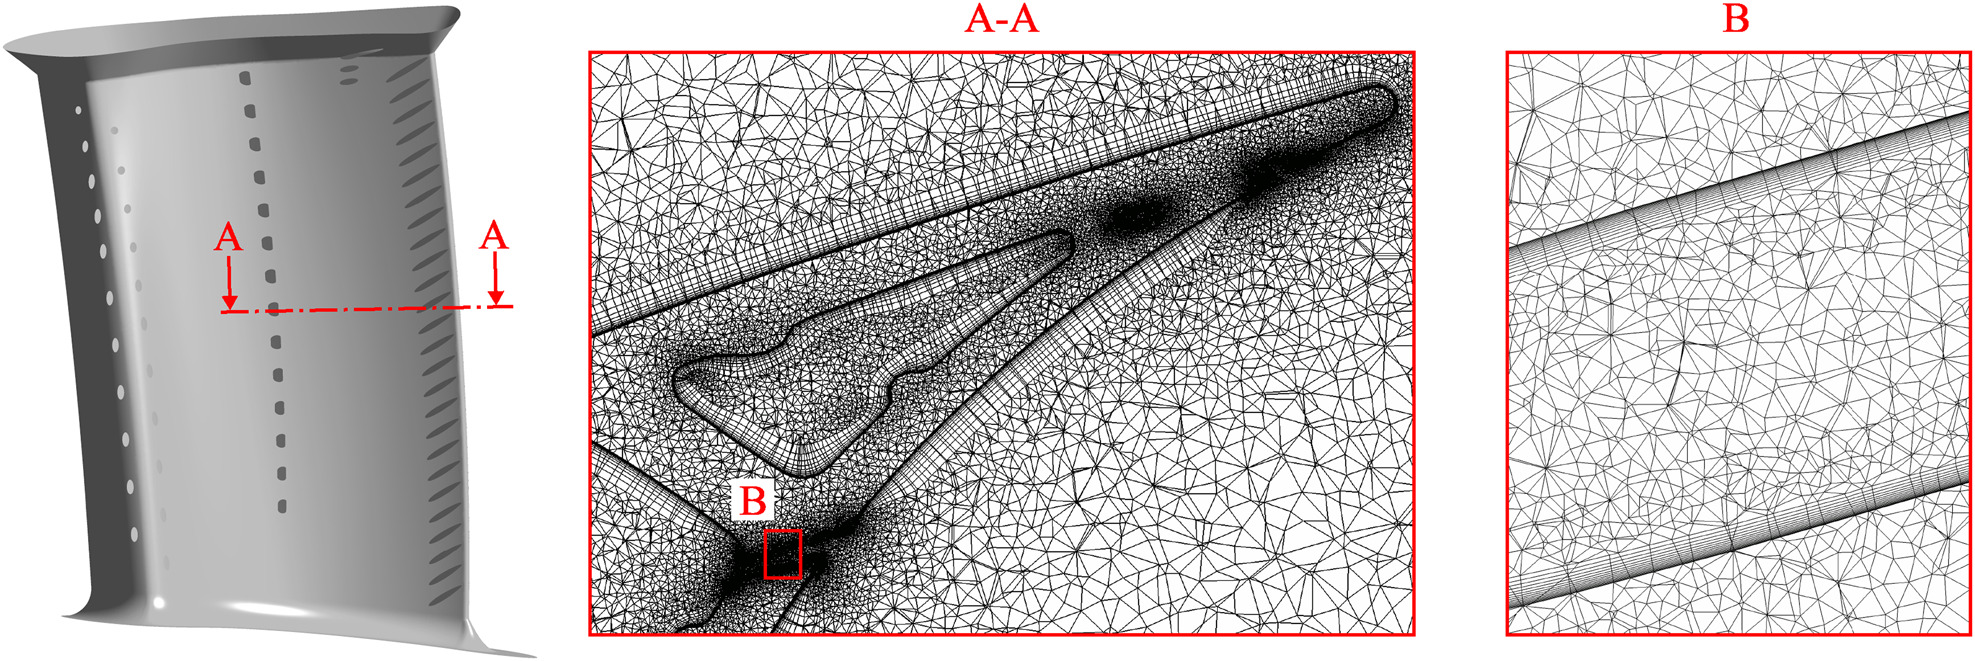
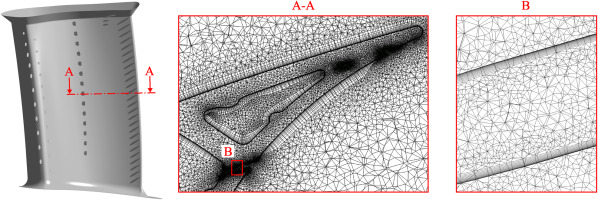
To support the experiments, conjugate heat transfer simulations are performed to predict trends for the internal flow where experimental data is not available. The numerical setup is based on Stichling (2018). Ansys CFX is used to predict a steady-state solution. Turbulence is modeled with the k-ω-SST model due to its robustness and applicability to both freestream and near-wall flows. The setup consists of the hot gas path, the coolant path and the blade solid. The hot gas path starts downstream of the flow conditioner and ends downstream of the tailboards (see Figure 1b). For the coolant path, the coolant inlet and outlet components shown in Figure 1a are modeled. A hybrid mesh consisting of a structured and unstructured grid is used. Wall regions are resolved with prism layers to reach a non-dimensional wall distance y+≈1, which is exemplary shown in the partial cross-section view A-A and in the detail view B in Figure 3. The meshes of both models (BSL and MOD) consist of ≈86 million elements. The two cases, BSL and MOD are simulated for coolant mass flow rates of ζ90, ζ100 and ζ120 with the swirler OSG7. The simulations are stopped after reaching stationarity of the field quantities at a low level for each residual (RMS<1e−4).
Figure 3.
Partial cross-section and detail view (cooling hole) at approx. midspan. 15 prismatic layers at walls.
Results and discussion
In this section the results of the simulations and experiments are discussed. First, the results of the simulations are validated against experimental data, followed by an analysis of the numerical results. Finally, the experimental results are investigated and discussed. With the information of the coolant flow inside the blade prediced by the CFD, a better analysis of the experimentally determined total cooling effectiveness is possible.
Validation of the CFD
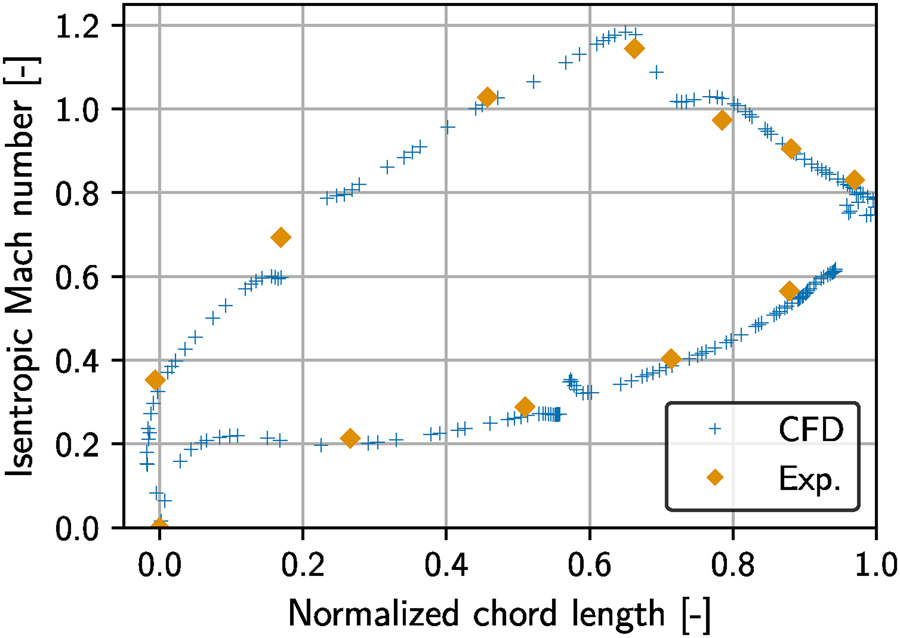
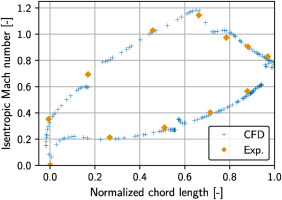
The CFD simulations are used to understand the influence of the leading edge hole enlargements on the blade internal flow. Therefore, the simulation setup is validated against experimental data on the basis of the coolant aerodynamics. The cooling hole flow and thus the film cooling is considerably affected by the difference of the hole inlet and exit pressure. The exit pressure is known for the tests in the form of Mach number distribution around the blade (separate test blade without film cooling). The cooling hole inlet pressure can not be determined experimentally for each hole. Hence, the coolant feed pressure upstream of the swirler is used for validation. The measured and predicted Mach number distributions at 50% blade span are shown in Figure 4. Overall, a good matching of the numerical results to experimental data can be observed. Deviations and gaps can be found at locations of film cooling holes, because the CFD is performed with the cooled blade.
Figure 4.
Simulated and measured Mach number distribution at midspan.
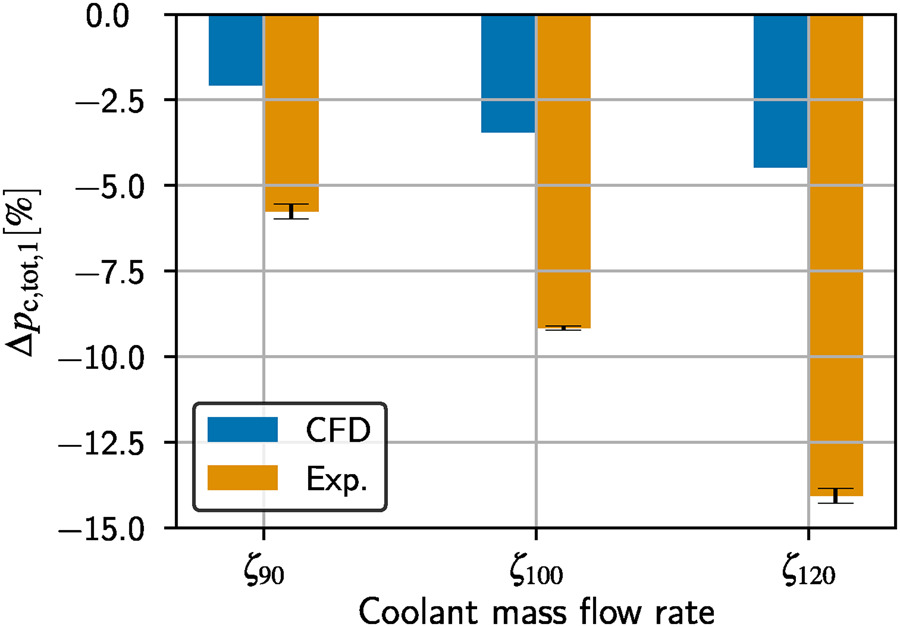
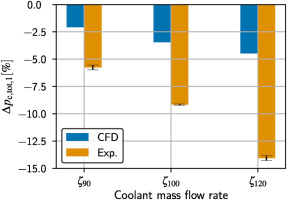
The change in feed pressure is described by Δpc,tot,1=(pc,tot,1,MOD−pc,tot,1,BSL)/pc,tot,1,BSL, with pc,tot,1 being the coolant inlet total pressure upstream of the swirler. For the assessment of the CFD’s ability to predict the changes in feed pressure caused by the cooling hole enlargement, Δpc,tot,1 is displayed in Figure 5 for three coolant mass flow rates. The experimental data includes the arithmetic mean and mean absolute deviation of all three swirlers, showing, that the influence of the swirler on the decrease of the coolant feed pressure is negligible. It can be seen, that the CFD underestimates the decrease of feed pressure by a factor of approximately three. The cause of this can be the neglected surface roughness inside the blade and possibly smaller film cooling holes in the CFD model. However, the simulations manage to predict the correct tendency, which is sufficient for the subsequent analysis of the coolant flow.
Figure 5.
Simulated and measured changes in coolant feed pressure. Mean absolute deviation of all swirlers displayed as error bars.
Simulation results
The simulation results are used to investigate the cooling air distribution inside the blade for case BSL and MOD. In Table 1 the difference of the mass flow rate Δm˙ζi=(m˙MOD−m˙BSL)/m˙BSL is listed in percent for ζ90,ζ100 and ζ120 for each row of film cooling holes. As expected, the mass flow rate increases for the rows SS-LE and PS-LE due to the increased hole diameter. The greater hole diameter at the leading edge results in a redistribution of the coolant inside the blade. The mass flow rate through the remaining holes is reduced. As a result, the coolant mass flow entering into the mid and trailing edge cooling passage (see Figure 2) for ζ100 decreased by 12.0% and 8.2%, respectively.
Table 1.
Predicted changes in mass flow rate and momentum ratio for the rows of film cooling holes (see Figure 2).
| Row | Δm˙ζ90[%] | Δm˙ζ100[%] | Δm˙ζ120[%] | ΔJζ100[%] |
|---|
| SS-FS | −5.6 | −10.1 | −13.5 | −14.3 |
| SS-LE | 24.6 | 33.6 | 38.6 | −32.3 |
| PS-LE | 43.0 | 43.0 | 45.2 | −25.7 |
| PS-FS | −23.0 | −24.8 | −24.0 | −39.2 |
| PS-TE | −7.6 | −11.0 | −14.1 | −17.4 |
The momentum (flux) ratio J=(ρcvc2)/(ρhvh2) is a relevant parameter in assessing the interaction of the cooling air jet and the hot gas in film cooling. In Table 1 the difference of the momentum ratio ΔJζ100=(JMOD,ζ100−JBSL,ζ100)/JBSL,ζ100 for each row is given in percent for the nominal coolant mass flow. For the rows SS-FS, PS-FS and PS-TE with fixed cooling hole diameters, the momentum ratio decreases due to the reduced mass flow rates and hence lower velocities in the cooling holes. At SS-LE and PS-LE the momentum ratio decreased −32.3% and −25.7%, despite an increased mass flow rate of 33.6% and 43.0%, respectively. This can be explained by a decreased velocity in these enlarged holes due to a reduced coolant feed pressure as a result of the greater discharge area. The higher mass flow rate through the row PS-LE, compared to row SS-LE, is presumably a result of the orientation of this row with respect to the swirl direction. In contrast to SS-LE, the axis of the holes in this row is better aligned to the incoming swirling flow (see Figure 2), which affects the discharge behaviour favourably as observed by Lerch et al. (2012). The redistribution of the cooling air partially depends on the coolant mass flow rate as shown in Table 1. With increasing coolant mass flow rate less cooling air is discharged through the rows SS-FS and PS-TE. The increase of mass flow rate at SS-LE varies from 24.6% for ζ90 to 38.6% for ζ120. The discharge through PS-LE and PS-FS remains almost constant.
Experimental results
The experimental results of the cases BSL and MOD are compared to each other after being normalized with the results of the conventional design (Conv; see Figure 2) for each coolant mass flow rate. This way, the results are evaluated with respect to a known conventional design, which is supposed to be outperformed. Additionally, by normalizing with the results of the conventional blade, possible changes in the boundary conditions of the tests between the measurement campaign for the baseline (Elfner et al., 2018) and modified case are considered. Hence, the baseline results are normalized with the results for the conventional design in Elfner et al. (2018) and the results for the modified case are normalized with repeated tests with the conventional blade for ζ90, ζ100 and ζ120.
Feed pressure
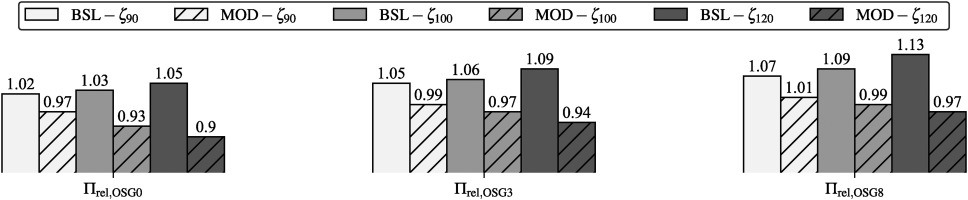
Prior to analyzing the thermal results, the cost of cooling will be considered. Two factors can be regarded as major costs for a cooling system: the necessary mass flow rate and the coolant feed pressure. To assess whether the cyclone designs require a higher or lower feed pressure than the conventional design for the same cooling mass flow rate, the relative pressure ratio Πrel,OSGi=ΠOSGi/ΠConv with the pressure ratio Πx=(pc,tot,1,x/ph,tot,1,x)x=OSGi,Conv is analyzed. The relative pressure ratio Πrel,OSGi of case BSL and MOD for each swirler and coolant mass flow rate is displayed in Figure 6. As shown in Figure 5, the modified design requires a lower feed pressure than the baseline design for all swirlers and coolant mass flow rates. The pressure for the modified design is also lower than for the conventional design (Πrel,OSGi<1), except for case OSG8-ζ90. For both cyclone designs the required feed pressure increases from OSG0 to OSG8, indicating a stronger swirling flow in the leading edge channel. The difference between the baseline and modified case increases with higher coolant mass flow rates for all swirlers. Thus, the modified design is especially advantageous for high coolant mass flow rates with respect to the required feed pressure.
Figure 6.
Relative pressure ratios Πrel,OSGi for case BSL and MOD for different coolant mass flow rates.
Total cooling effectiveness
The total cooling effectiveness of case BSL and MOD are normalized as described above. The relative total cooling effectiveness is defined as
The reader is directed to Elfner et al. (2018) for the thermal results (TCErel,BSL) of the baseline design and the effect of cyclone cooling in general. The effect of the enlarged holes at the leading edge on the total cooling effectiveness is of interest in this study and is analyzed by comparing TCErel,MOD to TCErel,BSL on the basis of the test results for the swirler OSG0 and the nominal coolant mass flow rate in the following. The difference of the cooling performance in both designs is more apparent when the ratio of the relative total cooling effectivenesses
is examined. In Figure 7a, ΔTCErel for the test case OSG0-ζ100 is plotted on the blade (no data available on grey areas). In Figure 7b, the ratio of the relative total cooling effectivenesses ΔTCErel is averaged over the blade span at discrete positions along the blade profile on both the suction and pressure side where experimental data is available. In addition to the areas on the blade surface with no experimental data, no evaluation is made at film cooling holes. The parameter s describes the position on the blade surface as percentage of the profile length for the suction and pressure side (see Figure 2).
Figure 7.
ΔTCErel for OSG0-ζ100.
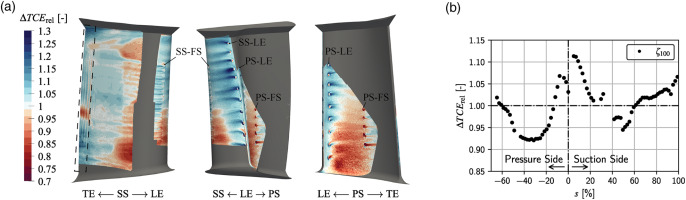
Three sections can be classified in Figure 7b: the leading edge area between −15%<s<22%, where the cooling performance is increased up to 10% on average. The majority of the suction side (s>20%) with overall similar cooling performance (ΔTCErel±5%), and the majority of the pressure side (s<−15%), where predominantly lower cooling performance is observed for the new design. The increased cooling effectiveness for case MOD at the leading edge (between SS-LE and PS-LE) is explained by a higher heat flux through the walls of the enlarged holes due to an increased mass flow rate (see Table 1) and wall surface area. The cooling effectiveness increased the most downstream of SS-LE and PS-LE. This can be explained by the higher mass flow rate through these holes. It is assumed that the decreased momentum ratio at SS-LE and PS-LE leads to a more favourable outflow of the coolig air for these cylindrical holes, which additionally increases the cooling effectiveness. The higher increase in cooling performance at the early suction side downstream of SS-LE compared to the area downstream of PS-LE is assumed to be related to the difference in momentum ratio. The massflow rate and momentum ratio at PS-LE is higher than at SS-LE, according to the simulations. The lower momentum ratio at SS-LE is assumed to be more advantageous to the film cooling effectiveness.
On the pressure side between PS-LE and PS-FS the lower cooling effectiveness for case MOD is at the location of the mid cooling channel (see Figure 2). Due to the higher mass flow rate through the leading edge holes, the mass flow rate in this channel is lower compared to the baseline case. A lower mass flow rate, thus lower Reynolds and Nusselt number results in a lower internal heat transfer causing a higher surface temperature. Downstream of row SS-FS, the total cooling effectiveness is for the most part slightly increased but decreases when experimental data is available again. The decrease of cooling effectiveness can be attributed to the lower mass flow rate through this row of fanshaped holes SS-FS. In addition, the above-mentioned internal effect in the mid channel is presumably leading to higher surface temperatures in this region.
Downstream of this area of lower total cooling effectiveness on the suction side, ΔTCErel around unity is observed. This area is at the location of the trailing edge channel. Contrary to the observation, a decrease of total cooling effectiveness was expected due to the reduced coolant mass flow rate in the internal channels. It must be stated, that the decrease of the mass flow rate in the internal channels is not equal for the mid and trailing edge channel, as shown by the simulations. For the simulated setup, the decrease of mass flow rate for the mid channel (−12.0%) is higher than for the trailing edge channel (−8.2%). Based on the available data, it is assumed, that the heat transfer in the trailing edge channel, which is influenced by relatively long ribs, is less susceptible to the present changes of mass flow rate at this operation point.
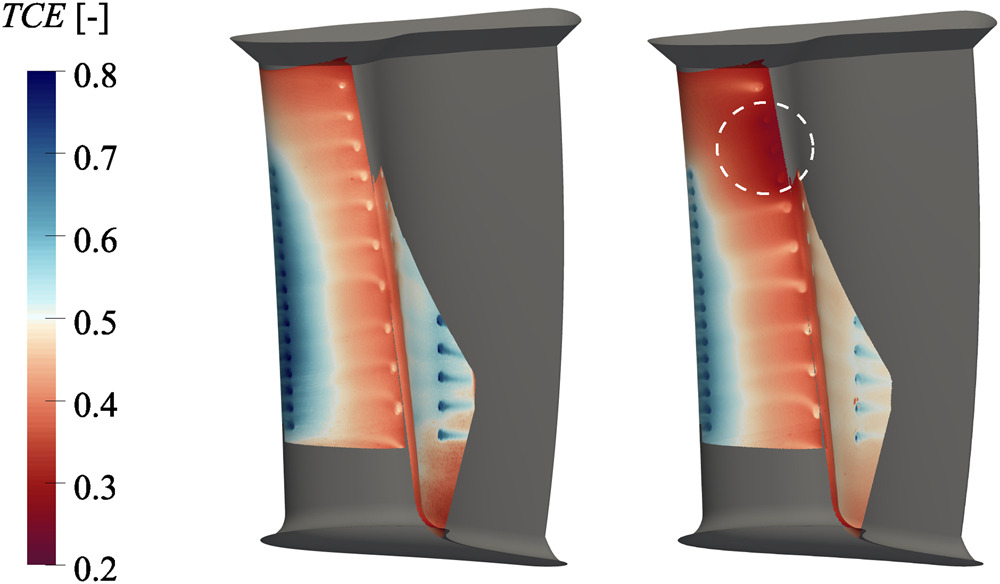
At the trailing edge of the blade on the suction side (marked by the dashed rectangle in Figure 7a), the cooling effectiveness is increased. This section of the blade is cooled by a row of cylindrical holes (PS-TE) at the pressure side. A hot spot in the marked area is visible, which is caused by a blocked hole due to a manufacturing error. This leads to an average increase of mass flow rate in the remaining holes of 4%, which is assumed to be the reason for the higher cooling effectiveness. Without the blocked film cooling hole, a lower cooling effectiveness at the trailing edge for the modified case is expected due to the reduced coolant mass flow rate.
Effect of coolant mass flow rate
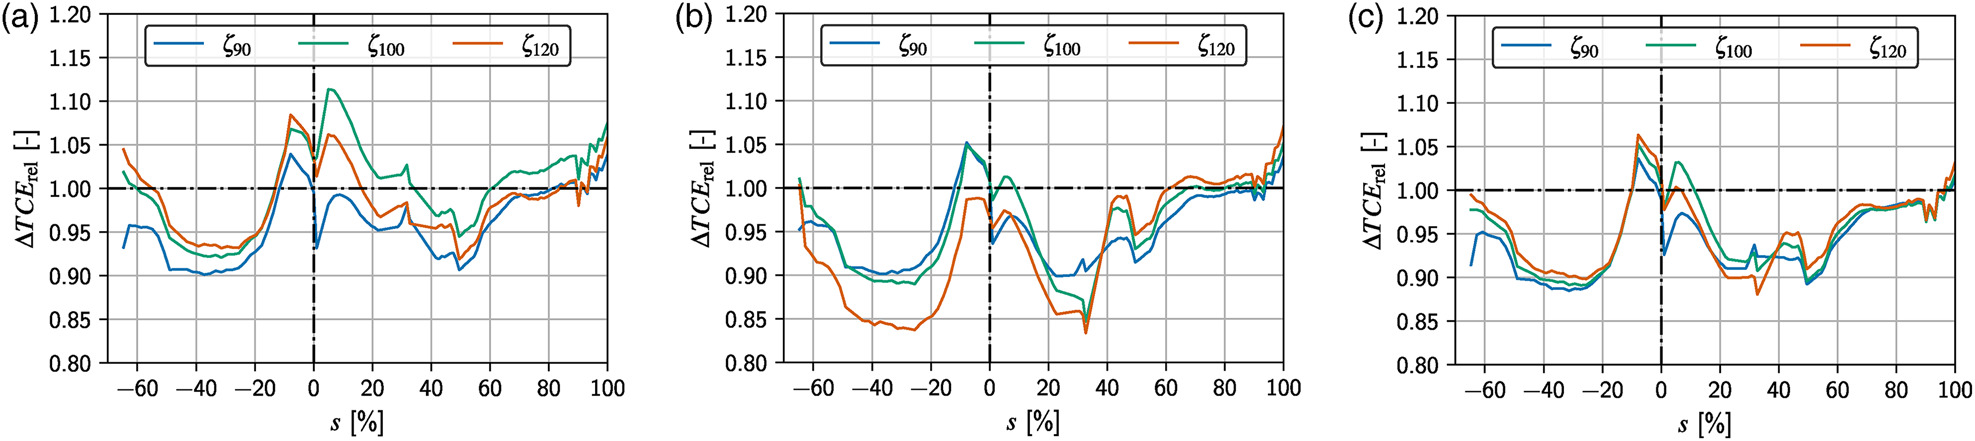
Following the analysis of the changes in the total cooling effectiveness for case MOD based on BSL, the effect of coolant mass flow rate on the cooling performance for case MOD is discussed. In Figure 8 the span-averaged ratio of the relative total cooling effectivenesses ΔTCErel for all swirlers and coolant mass flow rates are plotted. The qualitative effect of the modified design on the total cooling effectiveness is the same for all test cases with differences in the amplitudes of the effects: highest increase of cooling performance in the vicinity of the leading edge with a subsequent drop along the initial suction and pressure side and a following increase of the cooling effectiveness on both sides of the blade.
Figure 8.
Span-averaged Δ TCErel for all tests: OSG0 (a), OSG3 (b), OSG8 (c).
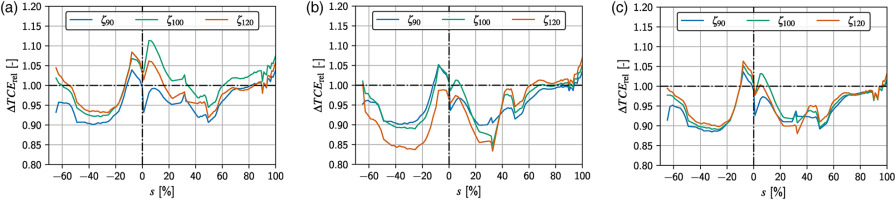
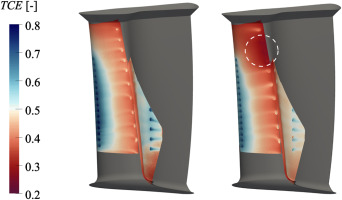
A mutual trait of all test results with a coolant mass flow rate of ζ90 is a high discrepancy of cooling close to the leading edge downstream of PS-LE and SS-LE. The cooling effectiveness is much lower downstream of SS-LE than it is downstream of PS-LE. This is caused by an absence of film cooling at three upper film cooling holes at SS-LE, which is shown in Figure 9. In this figure, the absolute total cooling effectivenesses for the baseline and modified case for OSG3-ζ90 are displayed. This effect is the same for all swirlers with a coolant mass flow rate of ζ90. It can be explained by the low pressure ratio Π. The pressure ratios are: 1.07, 1.11 and 1.20 for the swirlers OSG0, OSG3 and OSG8 for case MOD. These values are lower than in the baseline and conventional case (see Figure 6). The feed pressure is presumably too low for the film cooling to work properly. This is an important discovery since the film cooling at the leading edge must be ensured at all times for a safe operation of the blade. At a coolant mass flow rate of 120% the ratio of the relative total cooling effectiveness ΔTCErel is mostly lower than for the nominal coolant mass flow rate and only sporadically slightly higher (see Figure 8). The notable negative offset of the curve for OSG3 at the leading edge and pressure side can not be explained.
Figure 9.
TCE of OSG3-ζ90 for case BSL (left) and case MOD (right).
Effect of swirler
Tests with the swirler OSG3 and OSG8 result in a higher pressure ratio than with the swirler OSG0. This is attributed to a stronger swirling flow in the leading edge channel. The changes in the cooling performance are similar for OSG3 and OSG8 (see Figure 8). The only notable difference is for the coolant mass flow rate of ζ120 with OSG3. The increase of the cooling effectiveness with the modified design is the highest for OSG0. The cooling effectiveness is mostly reduced when OSG3 or OSG8 are used. Compared to the cooling performance of OSG0, the suction side downstream of SS-LE is on average not cooled as effectively for OSG3 and OSG8. This is presumably related to the stronger swirl for OSG3 and OSG8. As mentioned before, the axis of the SS-LE row is aligned unfavourably with respect to the incoming swirling flow. Thus, the inflow of the holes is likely adversely affected for an increased swirl number. The lower velocities in the enlarged film cooling holes combined with higher swirls in the leading edge channel apparently affect the film cooling effectiveness adversely.
Summary and conclusion
To improve the total cooling effectiveness at the leading edge of a cyclone-cooled turbine blade, the diameter of the film cooling holes at the leading edge was increased by 30% for a scaled turbine blade. The total cooling effectiveness was determined by means of infrared thermography. The effect of increased hole diameter at the leading edge on the blade cooling system was analyzed for different coolant mass flow rates and different swirlers. CFD simulations were carried out to support the experiments. The modified design of enlarged holes was compared to the baseline design with smaller holes at the leading edge. In the present study, the increase of the cooling hole diameter, with fixed coolant mass flow rates, results in a decrease of the coolant feed pressure due to the larger discharge surface. The decrease of feed pressure is greater for higher coolant mass flow rates. This outcome is beneficial to the whole cooling system. However, for the lowest coolant mass flow rate the feed pressure is too low to ensure film cooling at the leading edge. This is a critical point and needs to be addressed with future modifications. As expected, the larger holes lead to an increased cooling effectiveness at the leading edge due to a higher mass flow rate, detrimenting the cooling effectiveness of the remaining blade surface. This is explained by a redistribution of the cooling air as discovered in the simulations. The total cooling effectiveness is shown to increase the most for the lowest swirl in the cyclone channel. The relatively good performance of the swirler OSG0 compared to the swirler OSG3 and OSG8 is attributed to the improved film cooling of the early suction side. The enlargement of cooling holes for stronger swirling flows in the leading edge channel is found to generally downgrade the cooling effectiveness compared to the baseline design.
Overall, the modified design with the enlarged cooling holes at the leading edge is not recommended. A significant improvement of cooling effectiveness is limited to the leading edge area for a low swirl only. It is advised to modify the cyclone cooling design further by adjusting the orientation or the inlet geometry of the film cooling holes at the leading edge with respect to the swirling flow for an improved cooling performance.
Nomenclature
Latin symbols
Normalized blade length (−)
Total cooling effectiveness (−)
Greek symbols
Coolant mass flow ratio (−)
Abbreviations
Conventional cooling design