
Introduction
The performance of the fans and compressors can be detrimentally affected by inlet distortion in terms of efficiency and stability. To cut down specific fuel consumption and noise emission, the engine design has moved to larger fans with higher bypass ratio and lower fan pressure ratio (Suder et al., 2013). To increase the fan diameter without incurring the penalty of weight and drag, reduced axial length intakes are adopted (Hughes, 2011). The capability of the short intake to attenuate the distortions via internal flow diffusion is decreased, which makes the consequences of distortion more severe. Another architecture which can suffer from inlet distortion is boundary layer ingestion (BLI) propulsion (Kawai et al., 2006). By utilising fluid from the fuselage boundary layer as part of the entire propulsive stream, BLI can enable potential fuel consumptions savings. One of the main challenges with BLI is the fact that the compression system of the engines is forced to operate with significant levels of total pressure and swirl distortions due to the ingestion of the boundary layer as well as secondary flow within the S-shape intake. Therefore, the compression system must be robust against distortion.
A body of knowledge on inlet distortion were built through large amount of research and this enables the compressor designers to explore possible methods to make the compressors more robust when subjected to distortion; these methods can be classified into two categories: passive control and active control. Passive control of inlet distortion can be implemented with casing treatment (Prince et al., 1975; Smith and Cumpsty, 1984) or blade modification (Wadia et al., 2002). Active control methods for inlet distortion include tip injection, bleeding of flow and the application of variable inlet guide vane (VIGV) (Wadia, 2011). Both tip injection and bleeding can improve the stall margin with inlet distortion when stall is initiated at the tip, though bleeding is relatively less effective as compared with injection (Koch, 1970). Spakovszky et al. (Spakovszky, 1999) used an annular array of 12 jet-injectors located upstream of the rotor tip to extend the compressor stable operating range when subjected to inlet distortion. Steady state injection in distorted flow resulted in a range extension of 9.7% in stalling mass flow relative to the case with no injection. Similar conclusions are also shown in (Salunkhe and Pradeep, 2010).
In the experimental tests in (Day, 1991; Spakovszky, 1999; Li, 2017) multiple injectors were uniformly distributed around the annulus. Such setups require large amount of injection air which will decrease the net efficiency of the compression system. Therefore, methods which require less injected air are needed. The goal of this study is to find the most effective position for tip injection for stall control with distorted inflow. Thereafter, the injector can be installed only at these positions to reduce the amount of injected high-pressure air. This approach will be more beneficial when distortion location and pattern does not vary significantly, such as for the BLI engine. It can be seen from the experimental study of (Berrier et al., 2005) that the circumferential range as well as the location of the inlet distortion generated by the S intake is generally unaffected by inflow conditions though the amplitude can change.
It is known from previous research (Zhang and Vahdati, 2019) that the flow separation on the blade occurs when the blade enters the distorted region. Therefore, the injection in the distorted region can postpone/delay the appearance of blade separation. It was also shown in (Zhang and Vahdati, 2019) that the compressor will stall when the clean flow region fails to remove the separation created in the distorted region (and it is carried back into the distorted region again). Stall is initiated at the position when the blade moves from distorted region to clean flow region, where the incidence is also the largest. It is postulated that the injection at this position can reduce the incidence and hence suppress the stall inception. Moreover, previous investigation of the recovery process of a transonic fan (Zhang and Vahdati, 2020) from rotating stall revealed that the clean flow region plays an important role in the removal of the stall cell. The injection in the clean flow region can enhance the capability of the clean flow region to remove the separation. Therefore, the injection at all these three circumferential positions has the potential to suppress the occurrence of stall but their effectiveness needs to be investigated.
This paper is organised as:
Case validation; validate the simulation strategy using extensive experimental data with and without inlet distortion as well as with and without tip injection.
Study the effects of tip injection on compressor performance in presence of inlet distortion.
Find the most effective circumferential position for tip injection to delay stall.
Case setup
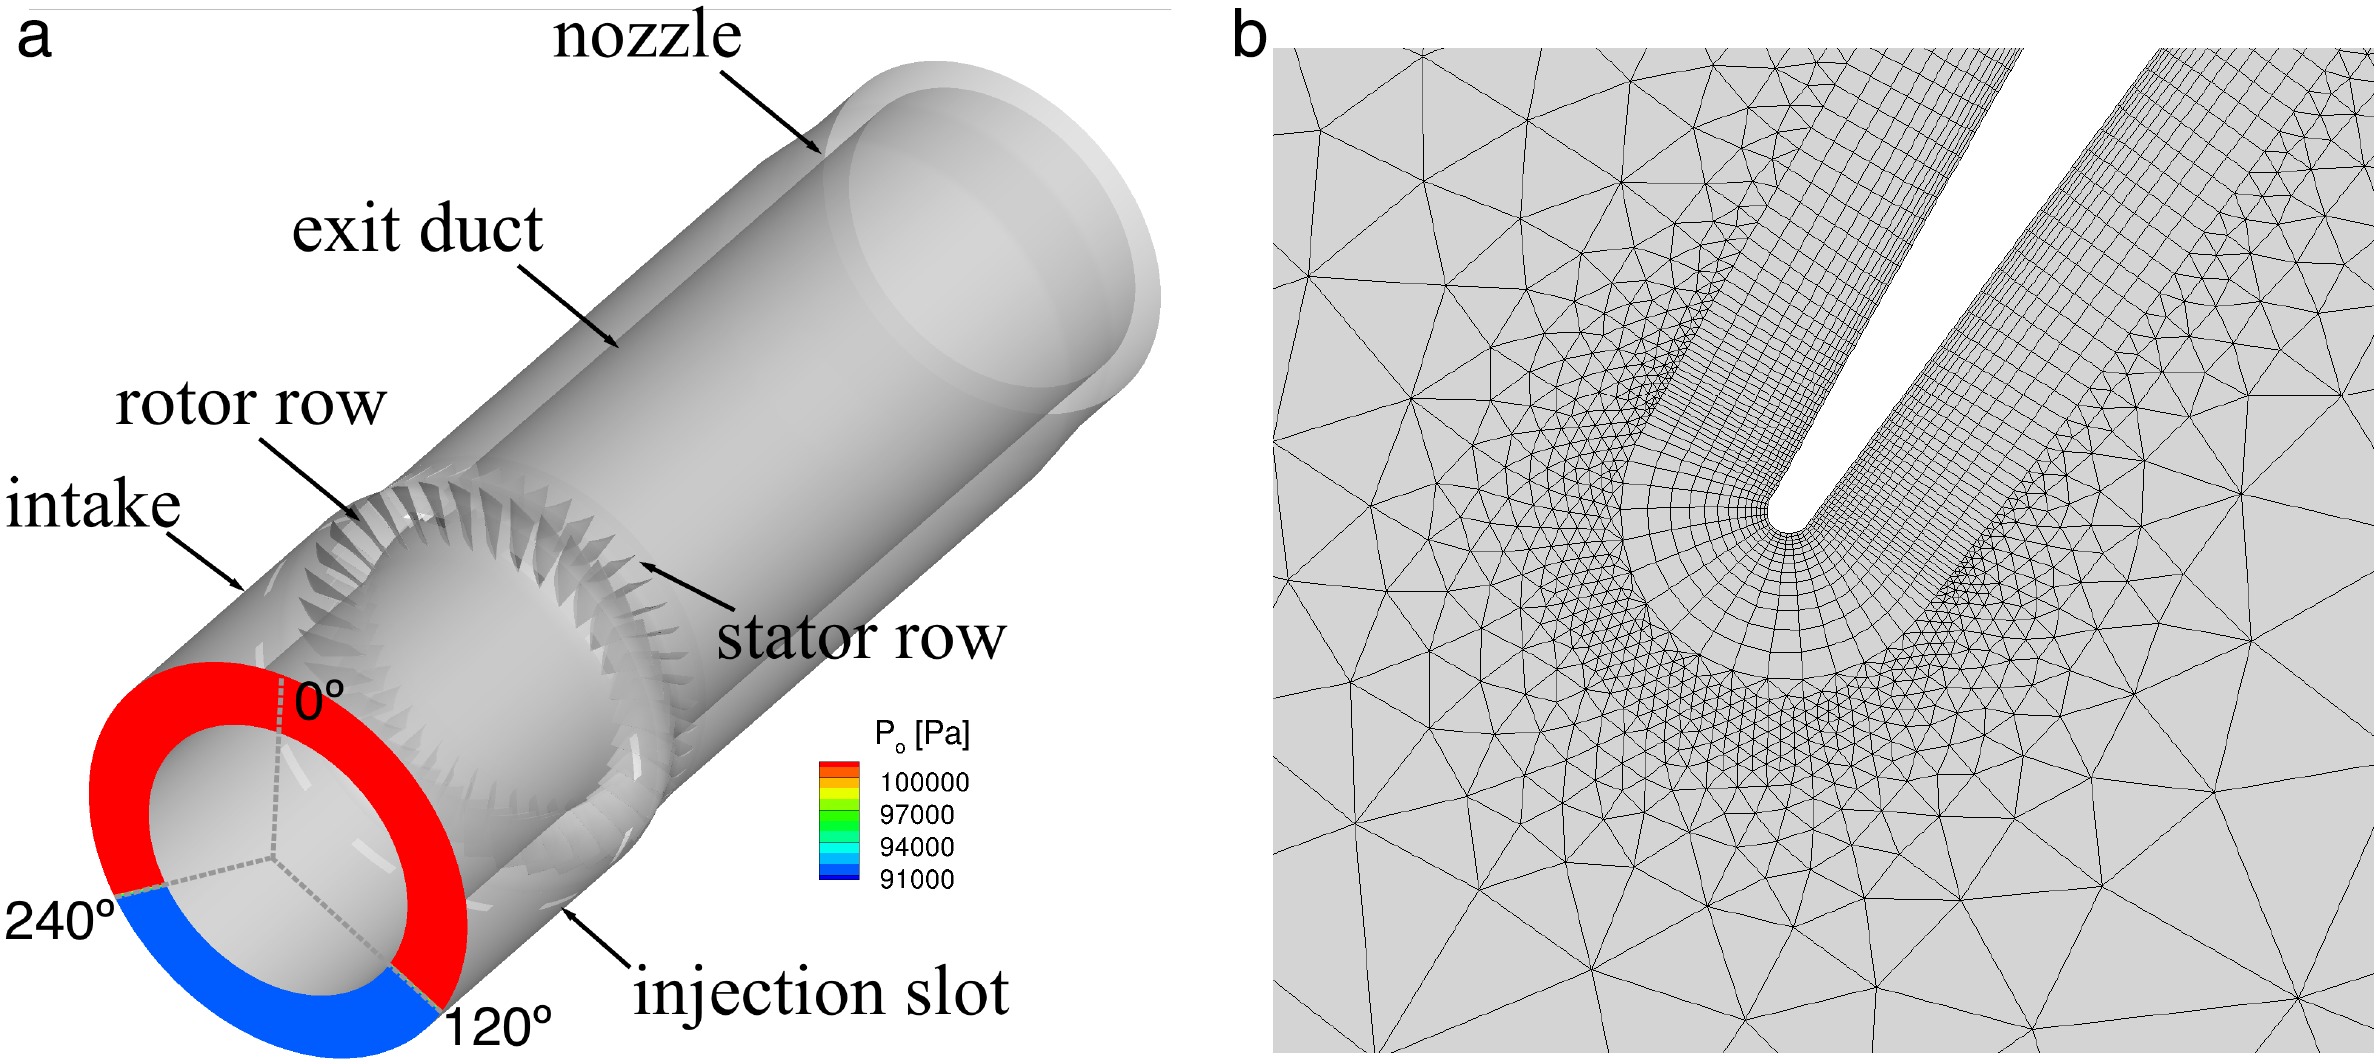
In this study, NASA stage 35 (Reid and Moore, 1978) is used as the test case, for which the experimental data with inlet distortion and tip injection is available. The design total pressure ratio of NASA stage 35 is 1.82 at a corrected mass flow of 20.2 kg/s. The tip speed of the rotor is 455 m/s at 100% rotational speed (Mach number of 1.49 and the aspect ratio of the rotor and stator are 1.19 and 1.26 respectively. The rotor row has 36 blades and the stator row has 46 blades. In the experimental tests, atmospheric air flew into the test stage and was discharged into the collector downstream of the compressor. A mesh screen was placed upstream of the compressor stage to generate total pressure distortion, as shown in Figure 1.
Figure 1.
Schematic diagram of NASA stage 35 with inlet distortion (the plot is not in proportion to the real geometry).

The geometry of the blades (pressure surface and suction surface) are obtained from (Reid and Moore, 1978). The leading edge and trailing edge circle are created with the radius size given in (Reid and Moore, 1978). The computational domain of NASA stage 35 is shown in Figure 2, which contains an intake, rotor row, stator row and an exit duct with a nozzle. The rotor has a tip gap of 0.04 cm and the hub clearance of the stator is 0.0762 cm (Chima, 2009). The rotor mesh has 0.8 million points per passage and 60 radial layers with 10 layers in the tip gap; the stator mesh has 0.3 million points and 50 radial layers with 8 layers in the hub gap. The distance between the distortion plane and the compressor is same as the one used in the experiment, which is 0.8D (rotor casing diameter). The length of the exit duct is 1.5D. The plenum is not included in CFD simulations as its volume is unknown.
Solver
The CFD solver used in this study is AU3D which has been developed and validated at Imperial College VUTC over the past 25 years with support from Rolls-Royce. It is an implicit, time-accurate 3D compressible Reynolds-averaged Navier-Stokes (RANS) solver. Further details can be found in Sayma et al (Sayma et al., 2000). The current computations use the one-equation Spalart-Allmaras turbulence model. The parameters in Spalart-Allmaras have been adjusted on previous fans to get good agreement near the stability limit; the parameters are held constant in all the present work. The resulting CFD code has been used for simulations at off-design conditions with a good degree of success (Dodds and Vahdati, 2015; Lee et al., 2018; Zhao et al., 2018).
Case validation in clean flow
The numerical strategy suggested in (Zhang and Vahdati, 2019) was employed in the simulations for stage 35. The steady simulations were performed on a single passage domain with periodic boundary conditions. Mixing planes are used between blade rows in steady computations while sliding planes are adopted in whole assembly time-accurate computations. At the inlet surface, the measured values of total pressure, total temperature and flow angle are specified. The values of these parameters are exacatly the same with the experiments. A choked nozzle is attached to the exit duct which throttles the compressor from choke to stall (Vahdati et al., 2005). It has been shown (Zhang and Vahdati, 2019) that a choked nozzle will stop the disturbances from propagating upstream and hence, the solution is independent of the exit pressure applied. The mass flow of the compressor is only determined by the nozzle throat area. It is found that this form of outlet condition is ideal for computations with inlet distortion as it would allow radial and circumferential variations of exit flow quantities. The computed overall performance for the whole stage at different rotational speeds are presented in Figure 3. The computed results (solid lines) show a good match with the experimental data (hollow dots). The total pressure ratio and especially the stall boundary of 100%, 90% and 80% rotational speed are accurately captured.
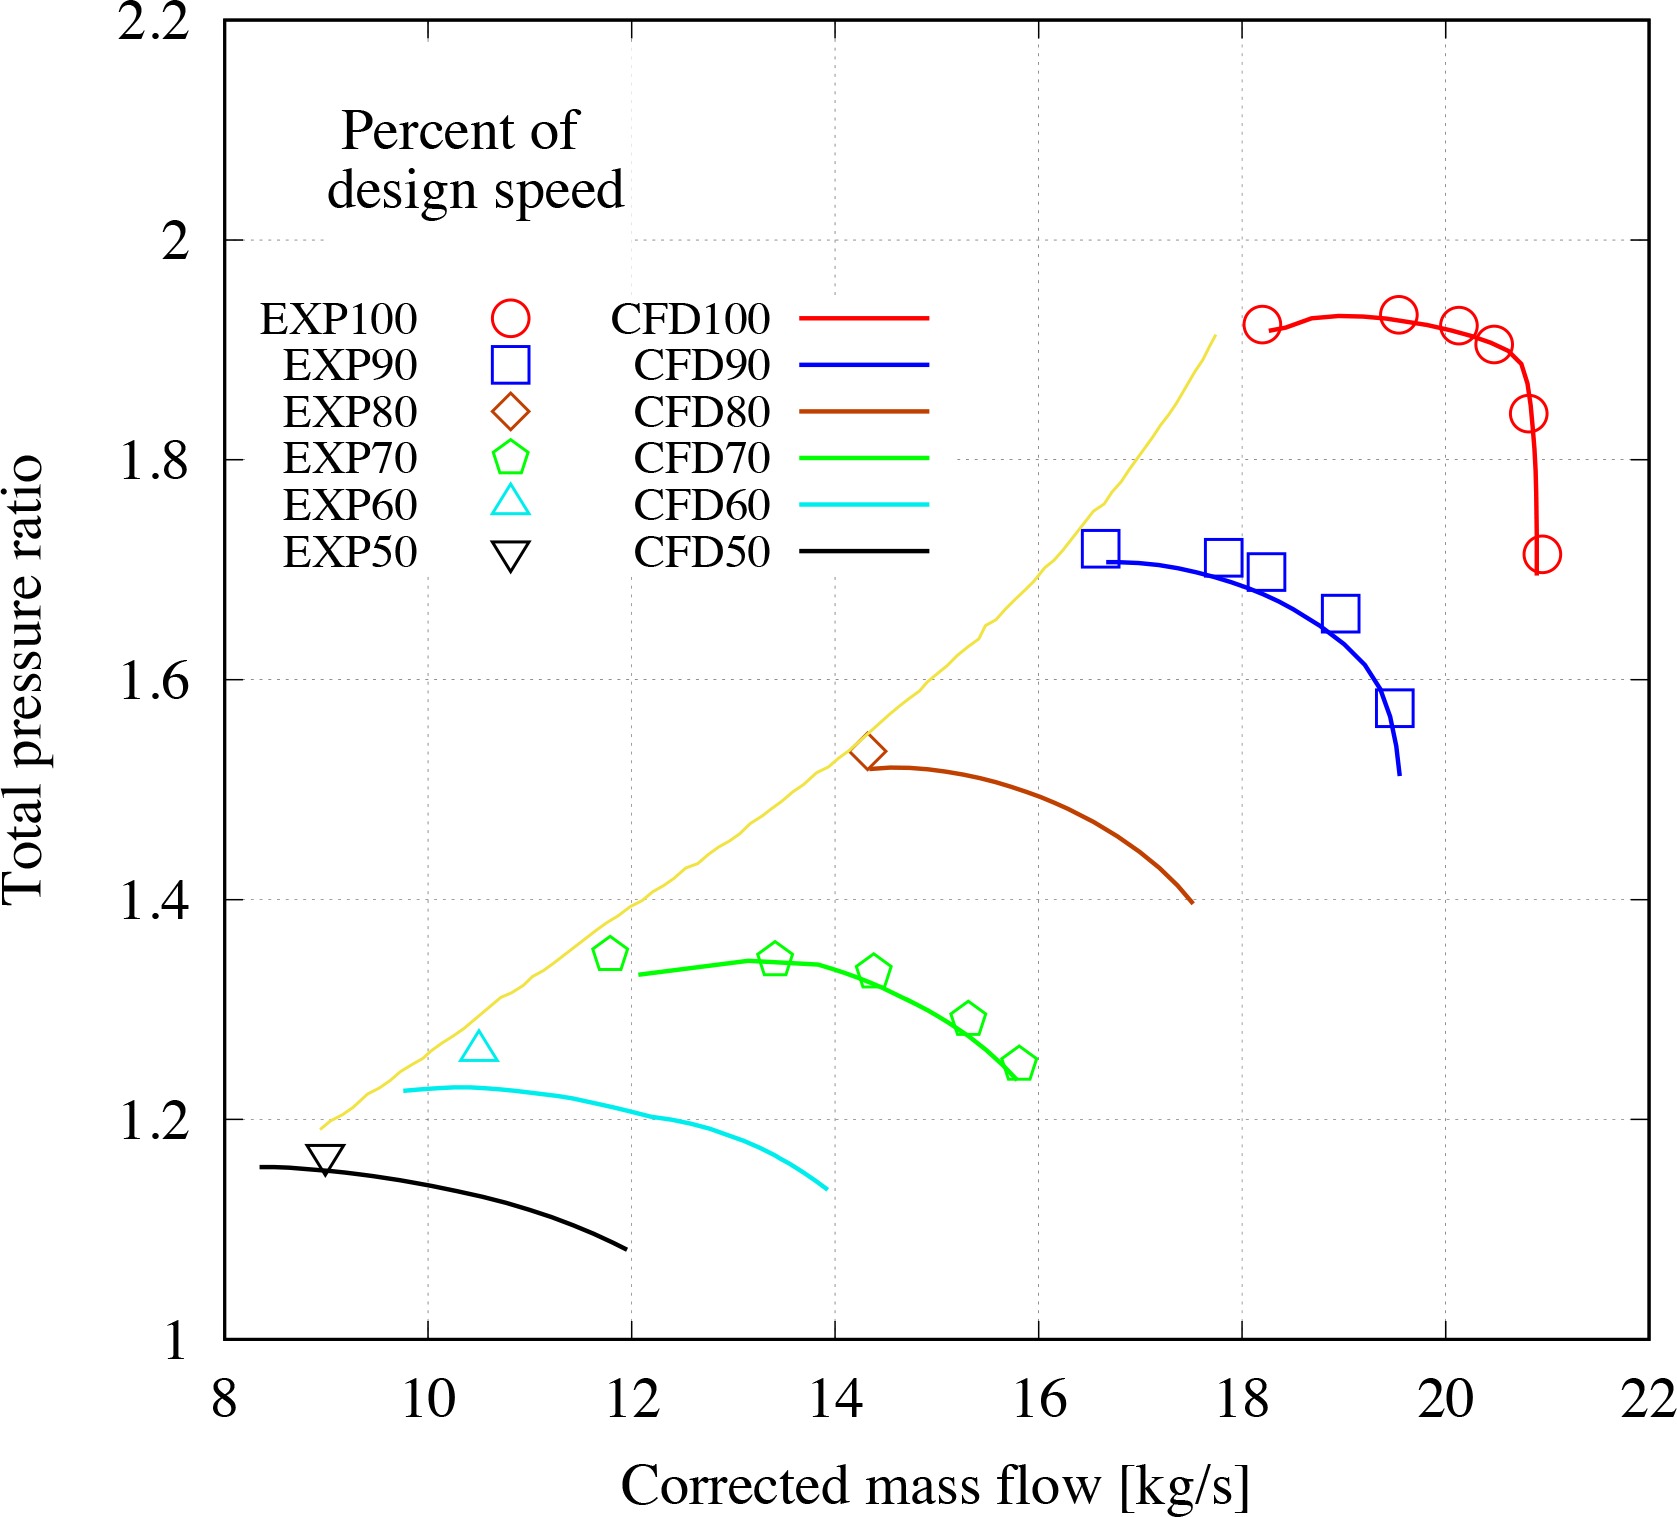
Figure 4 shows the comparison of the radial profiles of the normalised total pressure and Mach number downstream of the stator between CFD and experimental data (EXP) in clean flow for the near stall operating point (corrected mass flow = 19.6 kg/s) at 100% rotational speed. Good agreement is obtained in the overall profiles. This discrepancy near the tip region may be caused by the unknown stator geometry, which cannot be reproduced in the CFD mesh. The differences in the radial profiles between CFD and EXP are more significant at the lower 15% span range near the hub. For this compressor blade, CFD study has been conducted to investigate how the hub leakage flow influences the radial profile (Shabbir et al., 1997). It was demonstrated that the total pressure deficit in the hub region is caused by the flow leakage emitting forward of the rotor, between the rotor disc and the stationary centrebody.

Case validation with inlet distortion
To predict the stall boundary of stage 35 with inlet distortion (without tip injection), full annulus, time-accurate simulations were performed. Steady simulations performed in previous section showed that the hub leakage flow does not influence the stall boundary of clean inflow, and thus is not modelled in the case with inlet distortion. The circumferential angle of the inlet distortion is 120 degrees which expands between 120 and 240 degree in accordance with the tests (the blue region in Figure 2). The total temperature and the flow angle are uniform at the inlet. In the rig test, the compressor is pushed across the stability limit by gradually throttling the mass flow at constant speed. To maintain consistency with the experiment, initially a periodic converged solution (away from stall boundary) with inlet distortion is obtained and afterwards the downstream nozzle is gradually closed until the compressor falls into stall.
Experimental data with inlet distortion were obtained in (Spakovszky et al., 1999). The stall boundary with inlet distortion was recorded for three speeds (100%, 85% and 70%) but only the strength of the inlet distortion at 85% rotational speed was known. A makeshift method was developed to estimate the distortion strength at the higher and lower rotational speeds. In this method, it was assumed that:
The strength of the distortion generated with the mesh screen changes linearly with the square of the corrected mass flow at different rotational speeds.
On a constant speed line, the distortion strength stays unchanged from near choke to near stall condition.
These two assumptions were based on the observation in test data. For example, it was shown that in the experiments of NASA stage 11-4 that the distortion strength increases almost linearly with the increment of the square of the corrected mass flow (Sanger, 1976). Based on these relationships between distortion strength and stalled mass flow, the distortion strength at near stall point for stage 35 at 100% and 70% speed was 14% and 7% respectively.
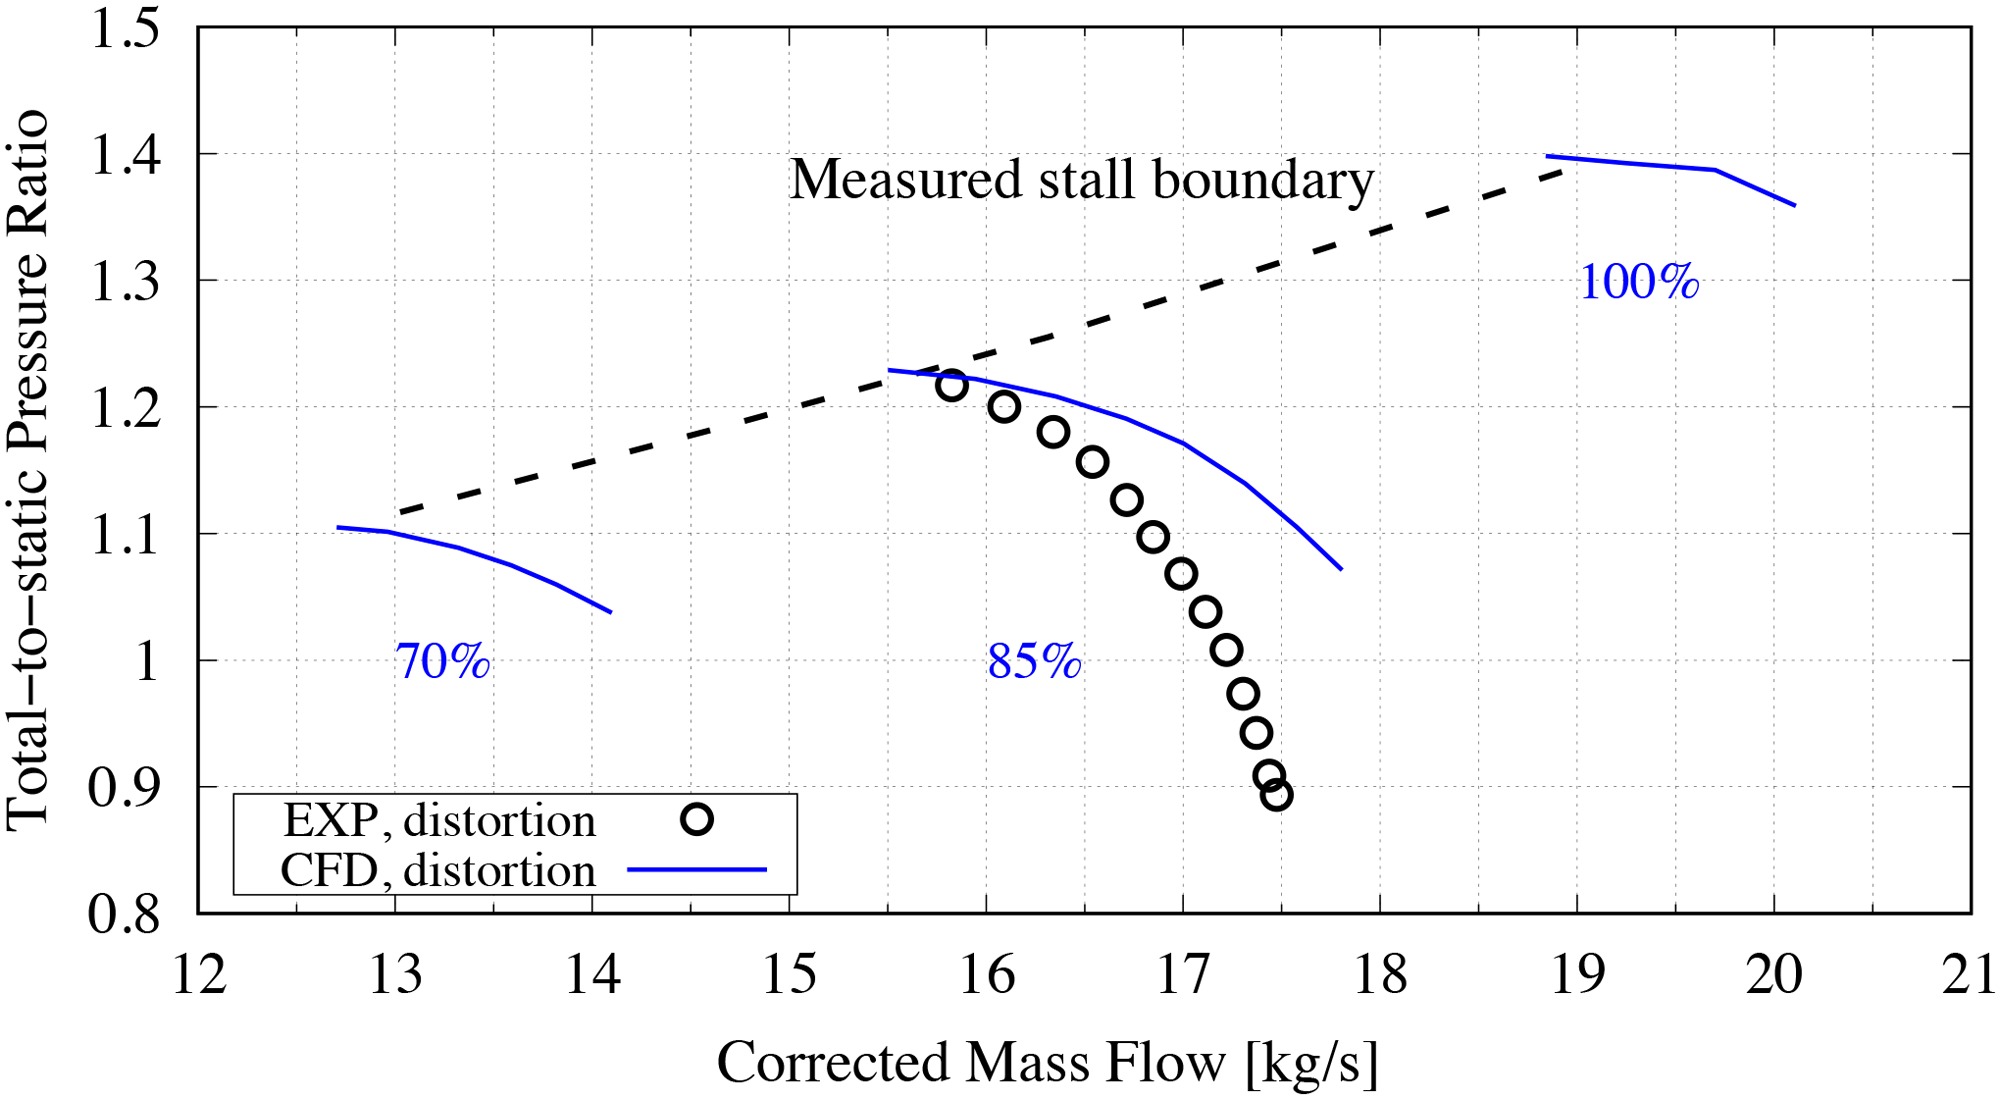
In the prediction of stall boundary for stage 35, 2,000 time steps/rev (Zhang and Vahdati, 2017) was used to seek a balance between computational cost and accuracy. Figure 5 shows the comparisons of the distorted stall boundary at 100%, 85% and 70% speed between CFD and measured data. The black dashed line is the stall boundary with distortion obtained in the experiments. As mentioned above, the measured compressor characteristic is only available for 85% rotational speed. Blue curves are the CFD results with inlet distortion. It can be seen that the predicted stalled mass flow was slightly lower than the experimental data. The simulated total-to-static pressure ratio is higher than the test results and the slope of the computed characteristics at near choke conditions tend to be flatter. This phenomenon was also reported in (Herrick et al., 2009). There was a suspicion that the stator was not set to the reported setting angle in the tests. Another possible reason is the stator endwall geometry. The stator had truncations and recesses at the start and end to reduce stress concentrations (Adamczyk, 2018). This allowed flow to leak from the pressure side to the suction side of the stator blades. In addition, the stator end-gaps were not well sealed which further promoted leakage flow. The above statements can be justified based on Figures 3 and 4 which show a good correlation between CFD and the measured total pressure variations. Total pressure was measured with probes immersed in the flow field, which are not influenced significantly by endwall profiles, while the static pressure measured on the wall surface depends on the geometry of endwall. Such stator end wall geometry was not modelled in CFD but it can contribute to the discrepancy between the CFD and the measurements.
Case setup with tip injection and validation
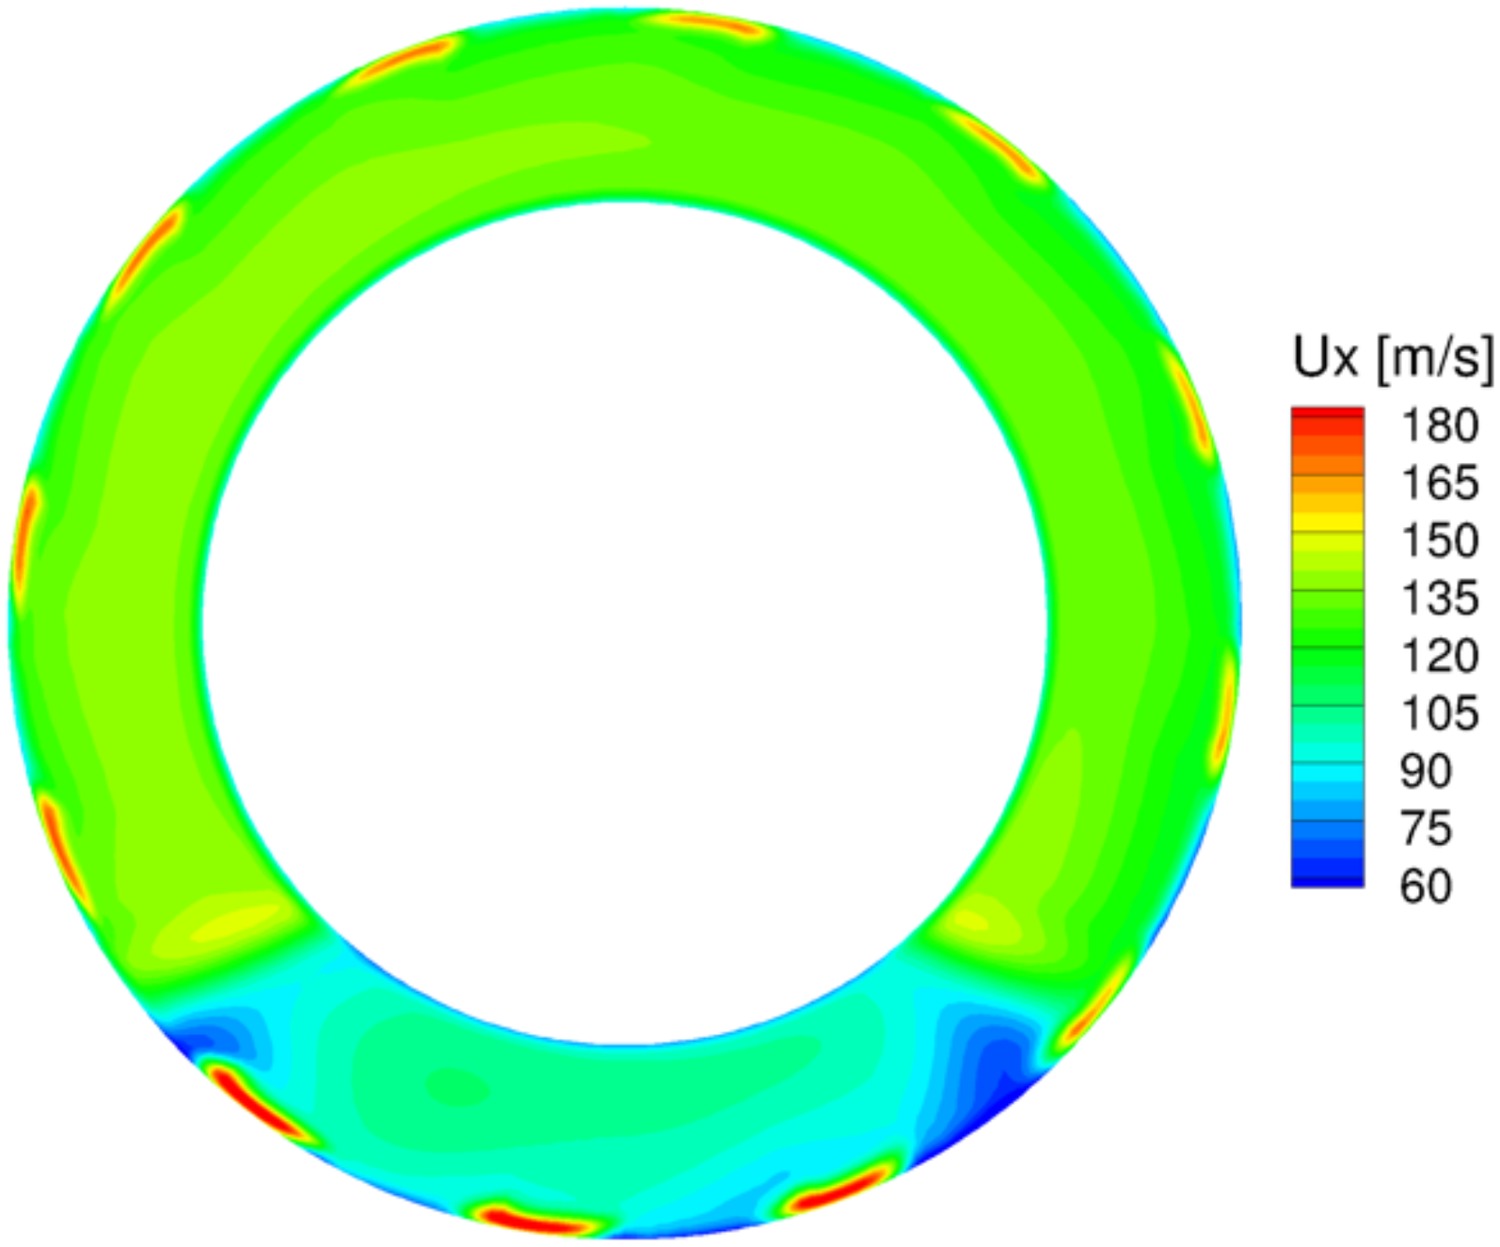
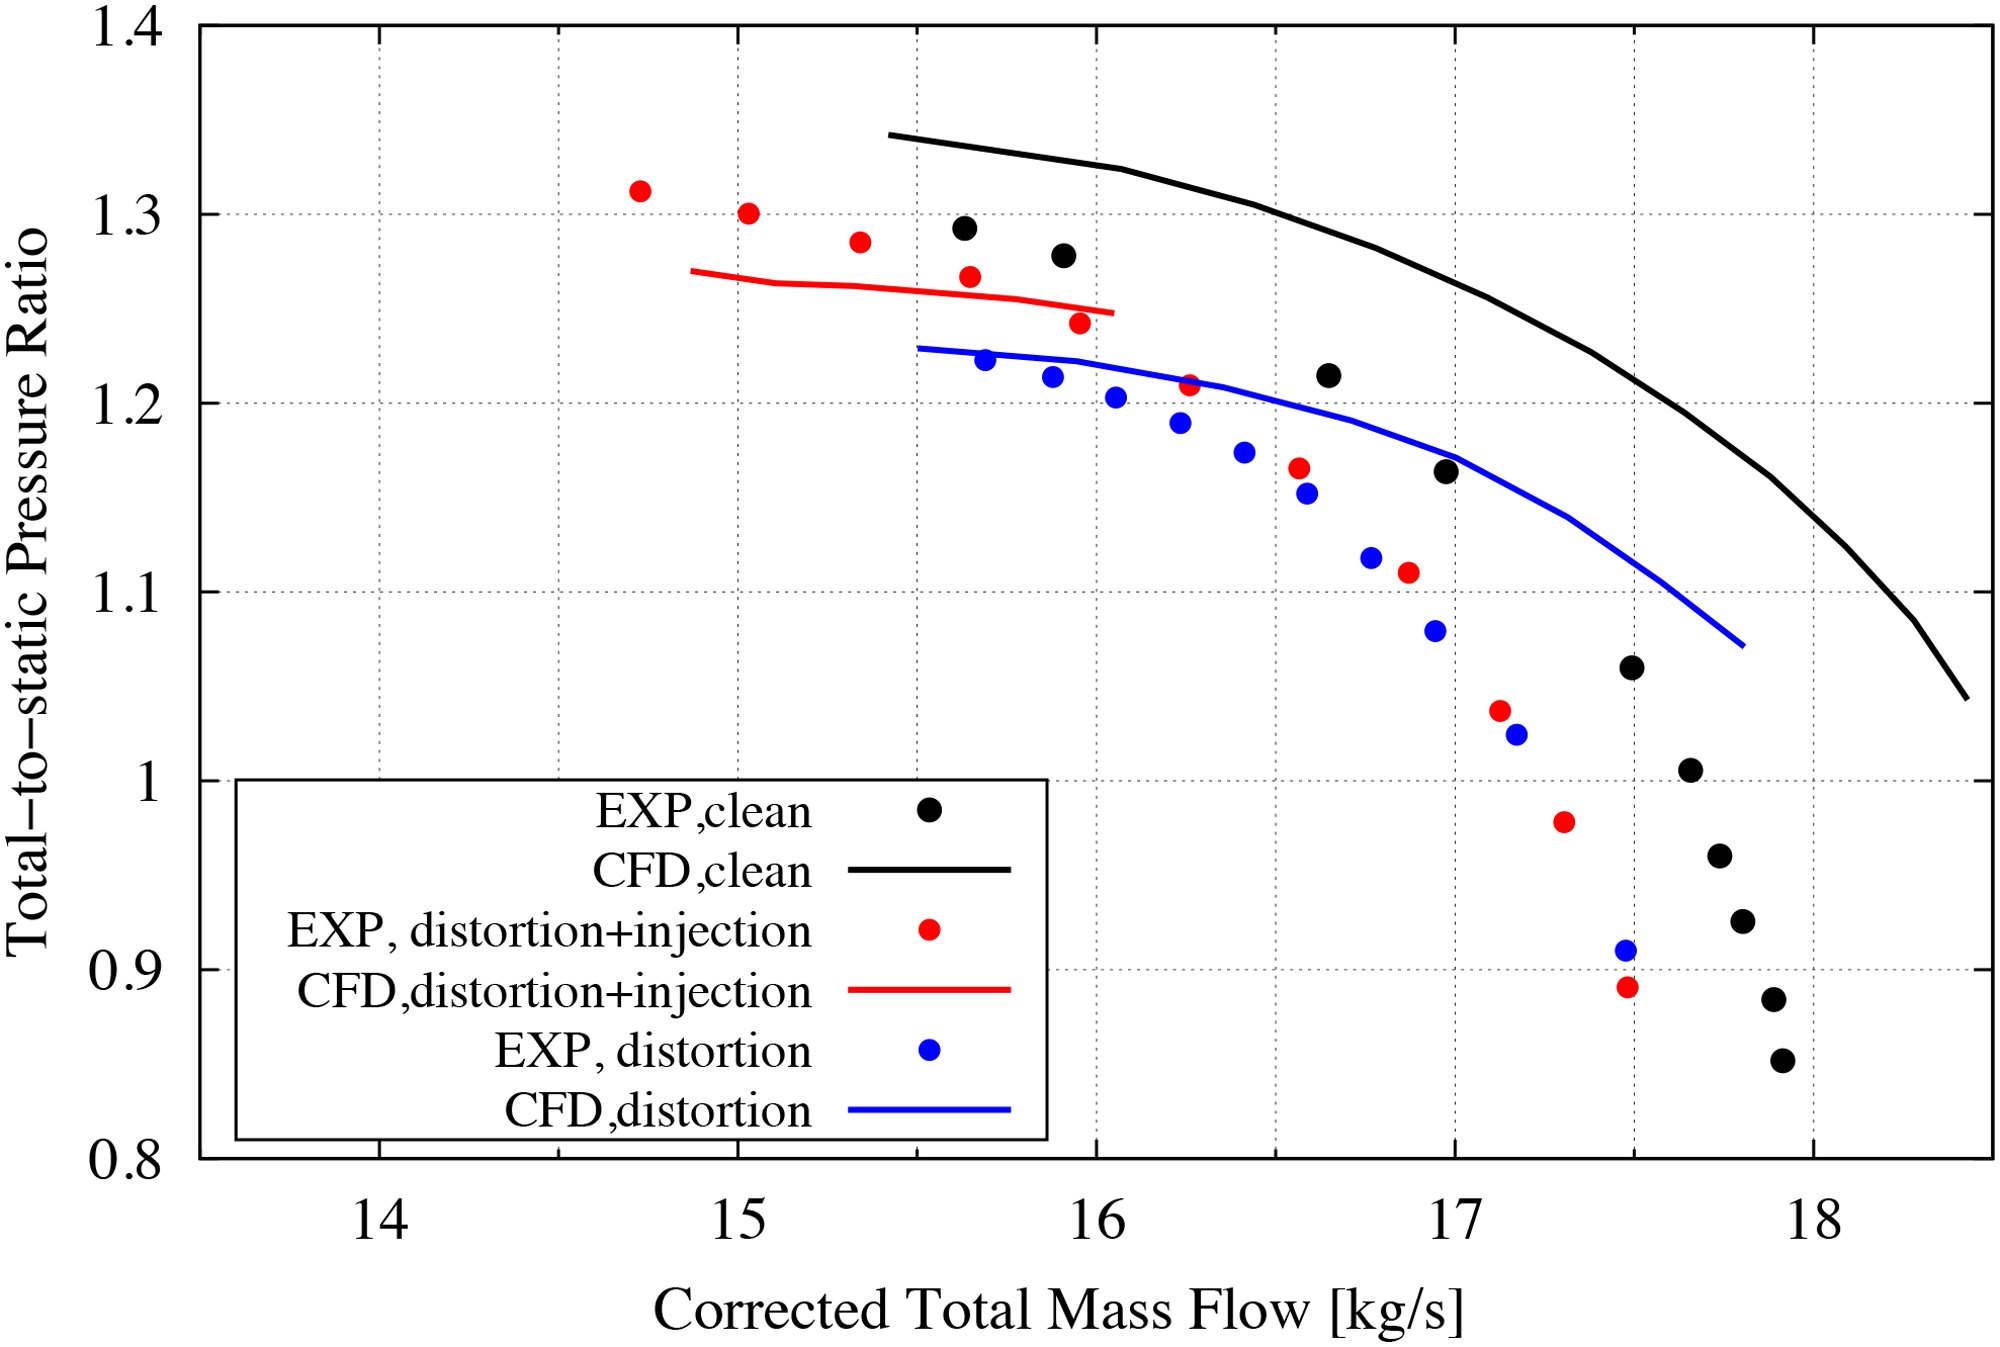
In the experiments, the total pressure of the injected air was 115 KPa and the total temperature of the air was 304 K, which yields a total corrected mass flow of 0.652 kg/s for 12 injectors (3.8% of the inflow at design condition). The 12 injectors are placed equally around the circumference, 63 mm upstream of the rotor leading edge. The geometry of the injector can be found in (Berndt et al., 1995). The injected air in the experiments was directed at a yaw angle of 15 degree (opposite to the direction of rotor rotation). It was found by Weigh (Weigl et al., 1997) that this angle gives the best improvement in stalling mass flow and highest pressure rise without inlet distortion. The injectors in the experiments affect the outer 7% of the rotor inlet span (Weigl et al., 1997). For the simulations with tip injection, the setup of the injectors in the CFD strictly follow the one in experiment. The measured total pressure and total temperature of the injected air are used as boundary conditions for the injection slots (Figure 2). The corrected mass flow in the CFD is 0.65 kg/s, which is the same as that in the experiment (i.e., the corrected mass flow of every single injector is about 0.054 kg/s). Figure 6 shows the contour of the axial velocity at the rotor inlet.
The comparisons of the compressor characteristic at 85% speed (for clean flow, distorted flow with and without injection) are shown in Figure 7. While the total-to-static pressure ratio differs between CFD and experimental results, the trend of the stalled mass flow is well captured by the CFD. The existence of the inlet distortion pushes the stall boundary to a larger mass flow. The tip injection can significantly extend the operational mass flow range by postponing the stall inception. There is also an increase in the total pressure ratio as the compressor approaches the stall boundary.
Effects of the tip injection at different positions
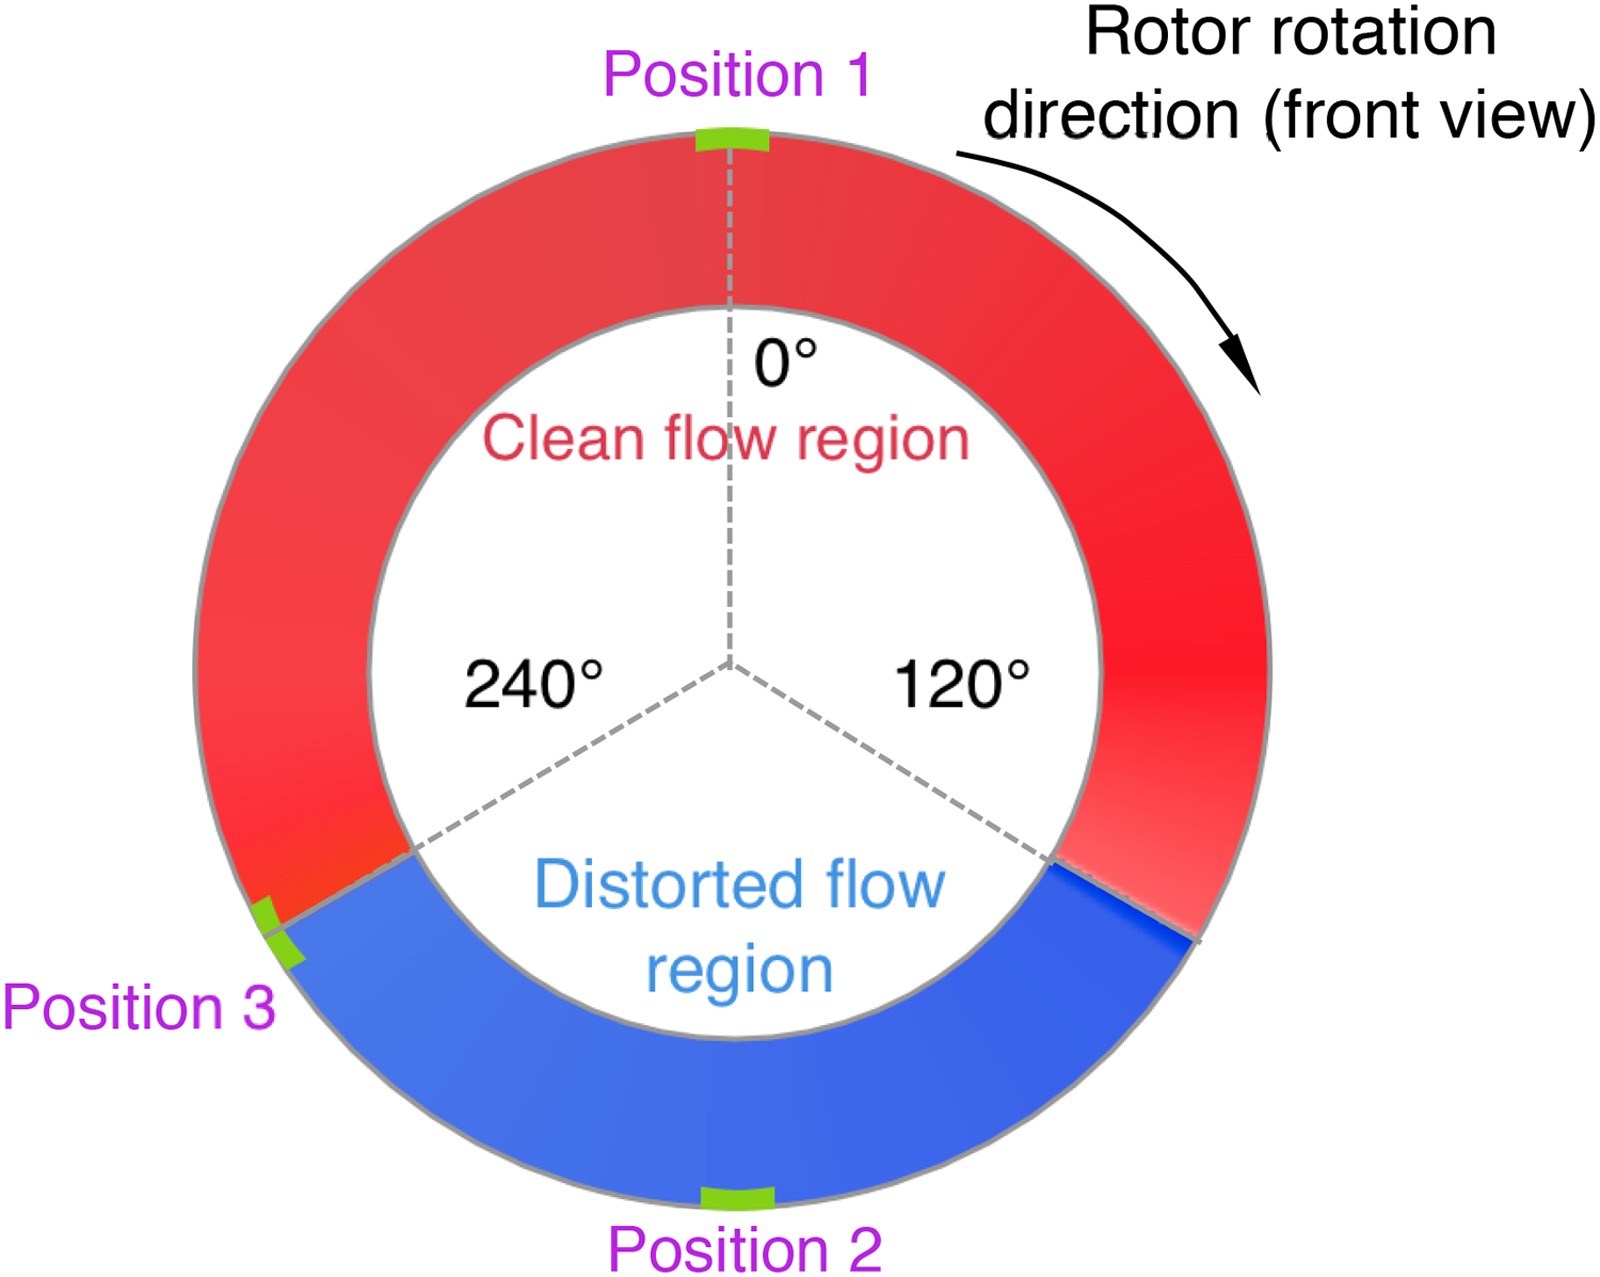
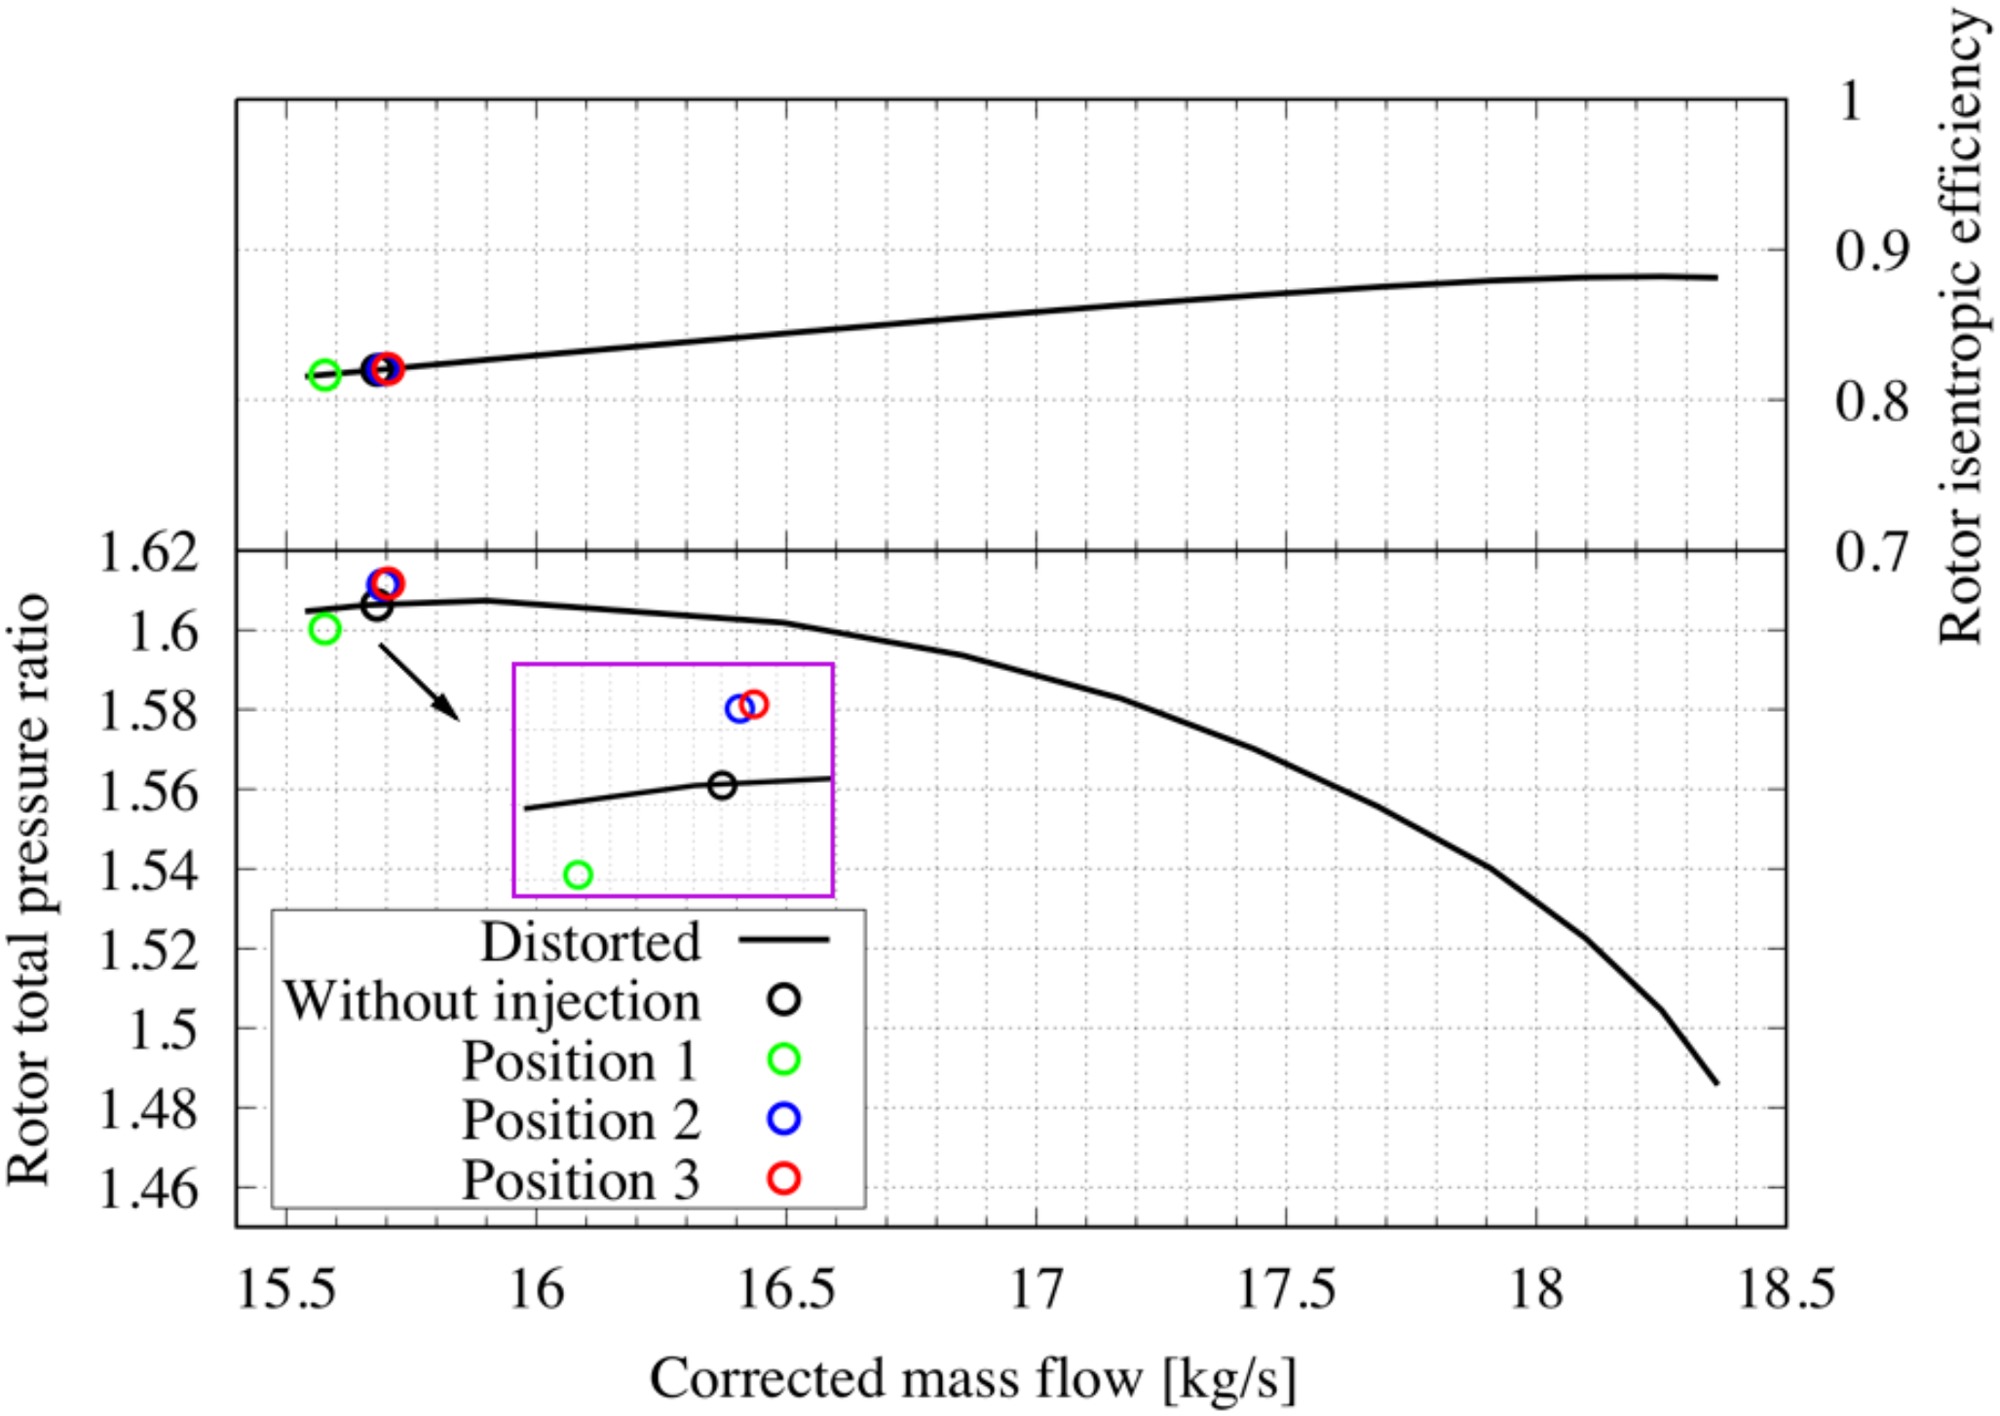
As mentioned in the introduction, to reduce the mass of injected air and increase the efficiency of the injection system of the compressor, the number of the injectors needs to be reduced and thus it is important to find the most effective circumferential position for tip injection. To achieve this goal, three different positions, labelled, Position 1, Position 2 and Position 3 were studied. Figure 8 shows the position of the injectors. Every case contains one injector only and the size and the axial location of the injectors are the same as that used in the experiments (Spakovszky et al., 1999). The setup of the cases is exactly the same to that in the above section. Position 1 and Position 2 are in the middle of the clean flow region and distorted flow region respectively. Position 3 is at the border between the clean flow region and the distorted flow region. The rotor rotates anti-clockwise in Figure 8. A converged case with inlet distortion but without injection (at corrected mass flow of 15.68 kg/s, stage total pressure ratio of 1.56 at 85% speed) is used as the starting solution for the cases with injection at the three positions. The injected mass flow in Position 1, Position 2 and Position 3 are the same and is 0.10 kg/s (0.66% of the main flow), which is twice the mass flow for every single injector in the experiment.
The operating condition of these three cases as well as the initial solution are plotted in Figure 9. The computed characteristic at 85% rotational speed with inlet distortion is also shown in this plot. It can be seen that the tip injection in Position 1 reduces the efficiency of the compressor. The corrected mass flow and the total pressure ratio are also decreased. Injection in Position 2 and Position 3 perform in a similar manner: the total pressure ratio is higher while the corrected mass flow and efficiency are unchanged at near stall condition.
Figure 9.
Operational condition of the cases with tip injection at different circumferential positions.
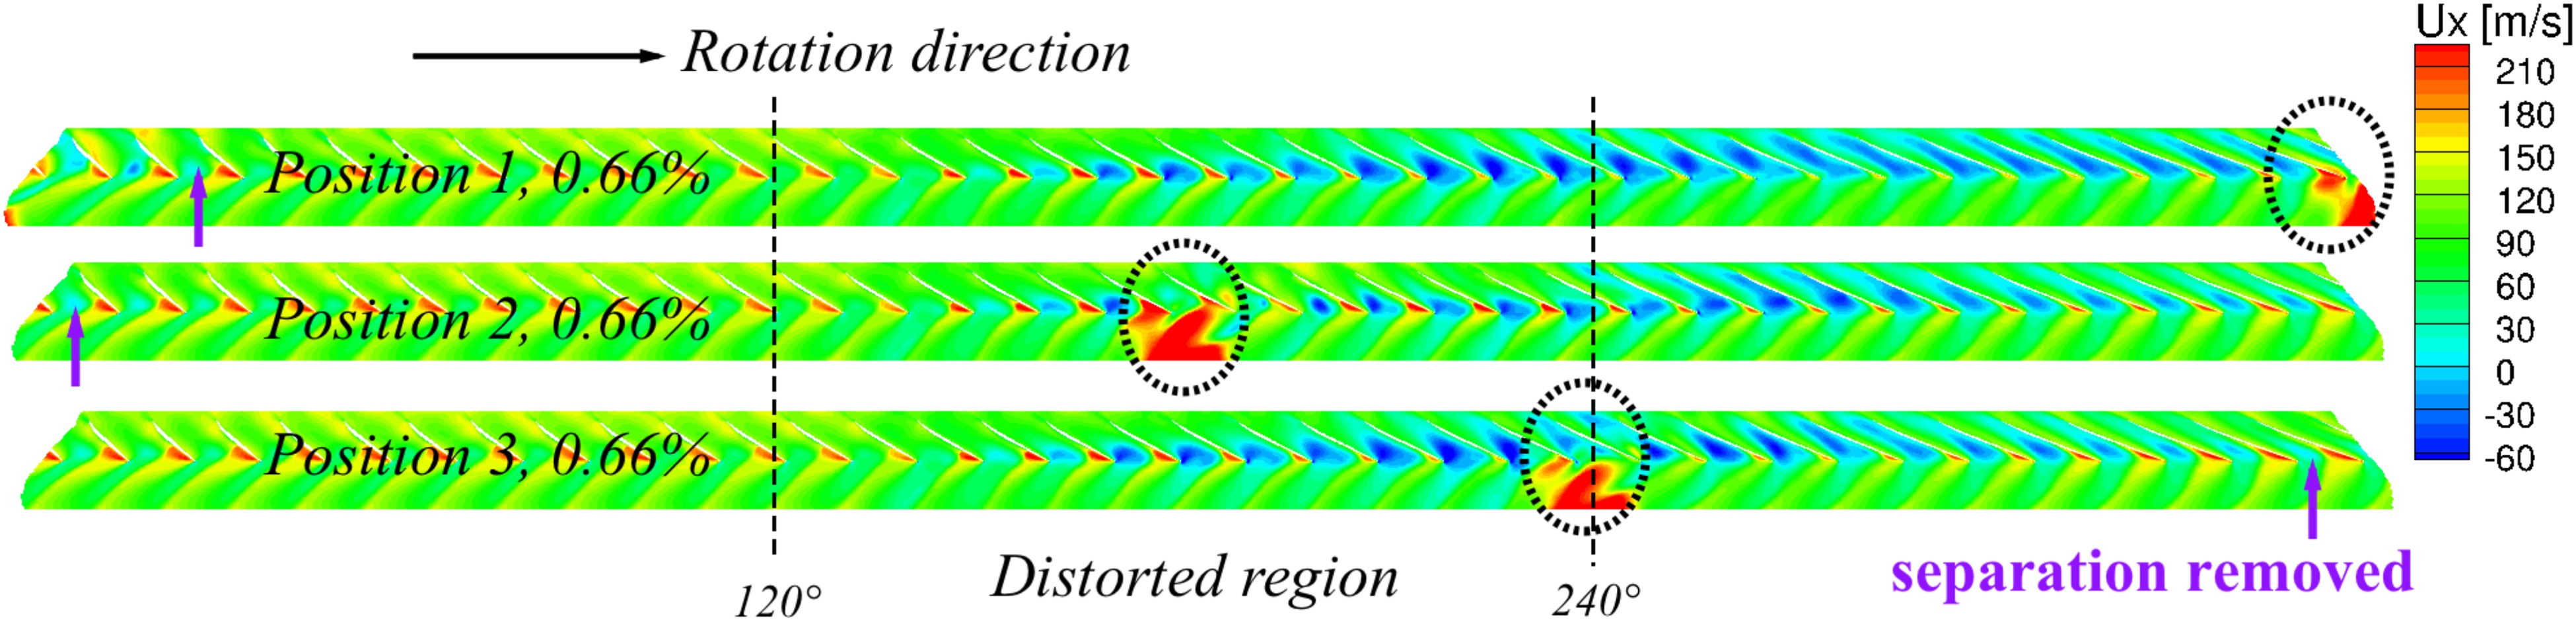
To explain these results, the flow field with and without injection are compared and analysed. Figure 10 shows the contour of the instantaneous axial velocity at 98% rotor span for these four cases: the distorted initial solution without tip injection, Position 1, Position 2 and Position 3. The positions of the injected flow are marked with dashed circles. In this plot, the location where negative axial velocity (separation) disappears is marked with the arrow. The flow on the blade surface remains attached when the blade enters the distorted flow region due to the hysteresis in the response of the blade. Thereafter, the flow separates in the distorted flow region which is gradually removed in the clean flow region. Compared with the case without injection, the flow pattern of Position 1 is quite similar, and the only difference is that the separation is totally removed by the injector (at angle 0 in Figure 8). The injector works as a “brush” to sweep the separated flow. In Position 2, the separation is clearly eliminated after the blade passes the injector, but it grows again in the distorted region and dies out at the same position as Position 1. For Position 3, the separation grows at the same rate as the case without injection in the distorted region but is suppressed (though not completely removed) by the injection. Comparing Position 3 with other positions, the separation is totally removed in the shortest time when the blade enters the clean flow region (at angle 320 in Figure 8).
Figure 10.
Contour of the axial velocity at 98% rotor span with tip injection at different circumferential positions, corrected mass flow = 15.7kg/s for Position 3.

When the nozzle is closed further, the case without injection will stall while the other three cases are still stable. The axial velocity contours at 98% rotor span are plotted in Figure 11. As the mass flow drops further, the removal of the separation in clean flow region will be slower, represented with a broader blue area in the clean flow region. In this plot, the injection at Position 1 can no longer remove the separation totally. Comparing the location where the separation is removed for Position 2 (at angle10) and Position 3 (at angle 350), it can be concluded that the injection at position 3 is more effective.
Figure 11.
Contour of the axial velocity at 98% rotor span with tip injection at different circumferential positions, corrected mass flow = 15.5 kg/s for Position 3.
The flow incidence at 98% rotor span is plotted in Figure 12. It was deduced in (Zhang and Vahdati, 2019) that the growth of the separation is directly influenced by the incidence onto the blade. Therefore, it can be presumed that the injection at the position with the largest incidence will be the most effective. It is seen from Figure 12 that the incidence is reduced significantly at the positions with injection and the largest drop in incidence occurs with the injector at position 3 (from 20 degrees to −3). However, as can be seen from Figure 12 the incidence to the trailing blade from the injector is increased, which is due to the blockage caused by the injected flow. This phenomenon will increase the loading of the trailing blade. However, the influence of the injection on leading blade passages plays a more important role as the trailing blade will pass the injector at a later time.

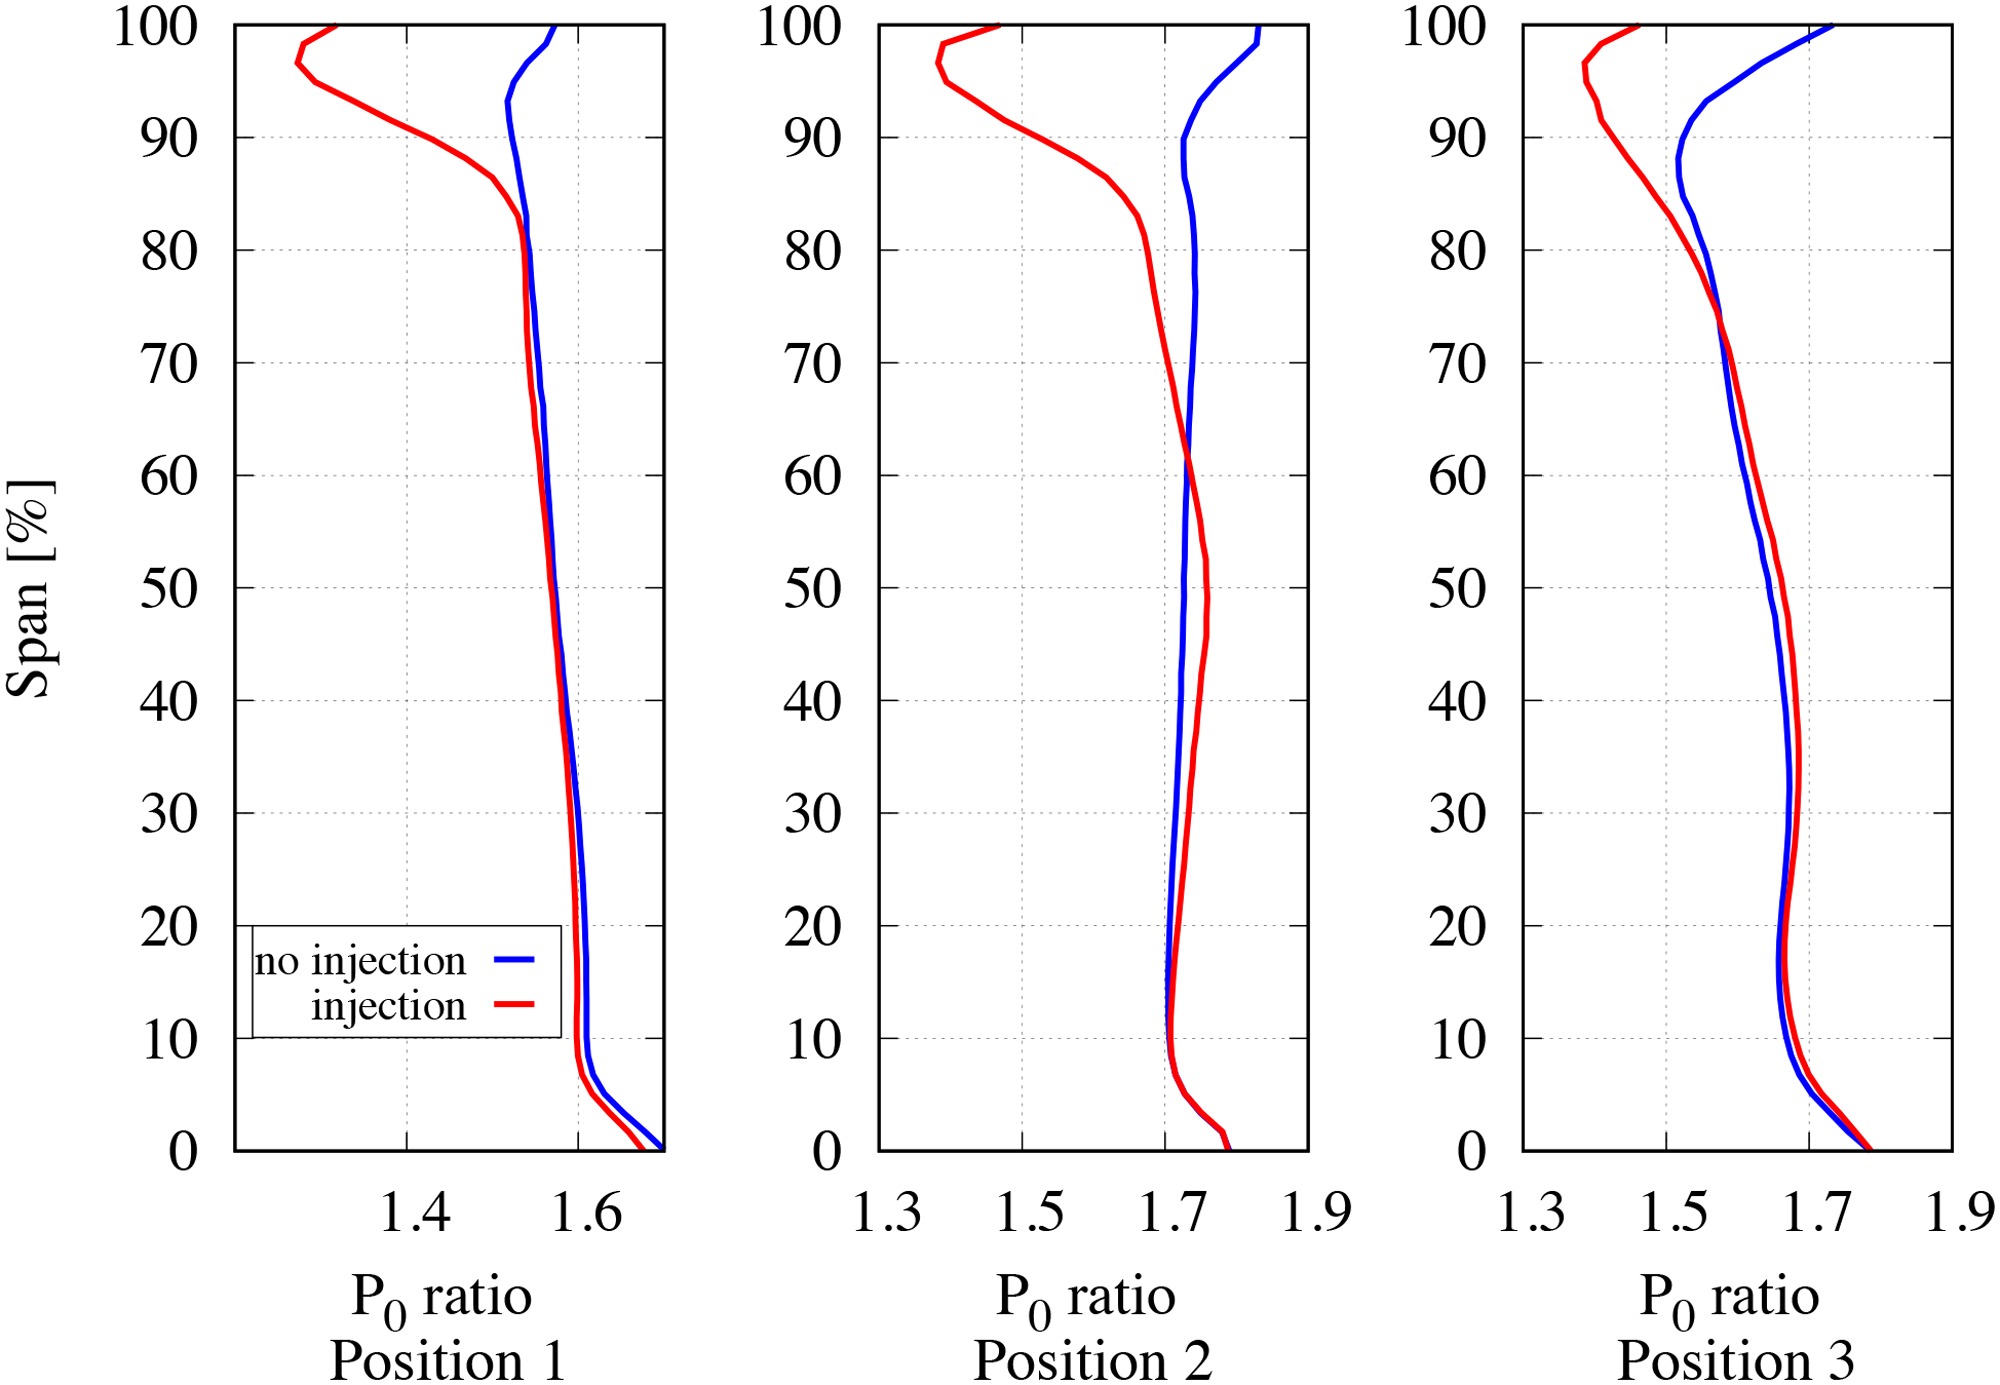
Figure 13 shows the radial variations of total pressure ratio in the positions with injection (see Figure 8). In this figure the blue curves show the case without injection while the red curves show the results with injection at different positions. It can be seen that the tip injection modifies the blade loading at the upper 20% span, which is due to the decrease of the flow incidence shown in Figure 12. Therefore, the main effect of the tip injection is to reduce the blade loading at the tip region, where stall is initialised as stage 35 is a tip-critical blade (Spakovszky et al., 1999).
In this research, a larger injected mass flow was also studied to see how tip injection affects the stall boundary for cases at these three injection positions. The injected flow is 0.23 kg/s, which is about 1.5% of the main flow at near stall condition for all three cases. The operational points with 0.66% tip injection and 1.5% tip injection at near stall conditions are plotted in Figure 14. For all three positions, the total pressure ratio decreases while the efficiency remains unchanged.

For Position 1, larger tip injection moves the stall boundary to a lower corrected mass flow and lower total pressure ratio, which is due to the reduction of effective rotational speed. This indicates that larger injected mass flow has no obvious improvement on the compressor performance in Position 1. For Position 3, when larger mass flow was used, the stall boundary was extended while the total pressure ratio remained unchanged.
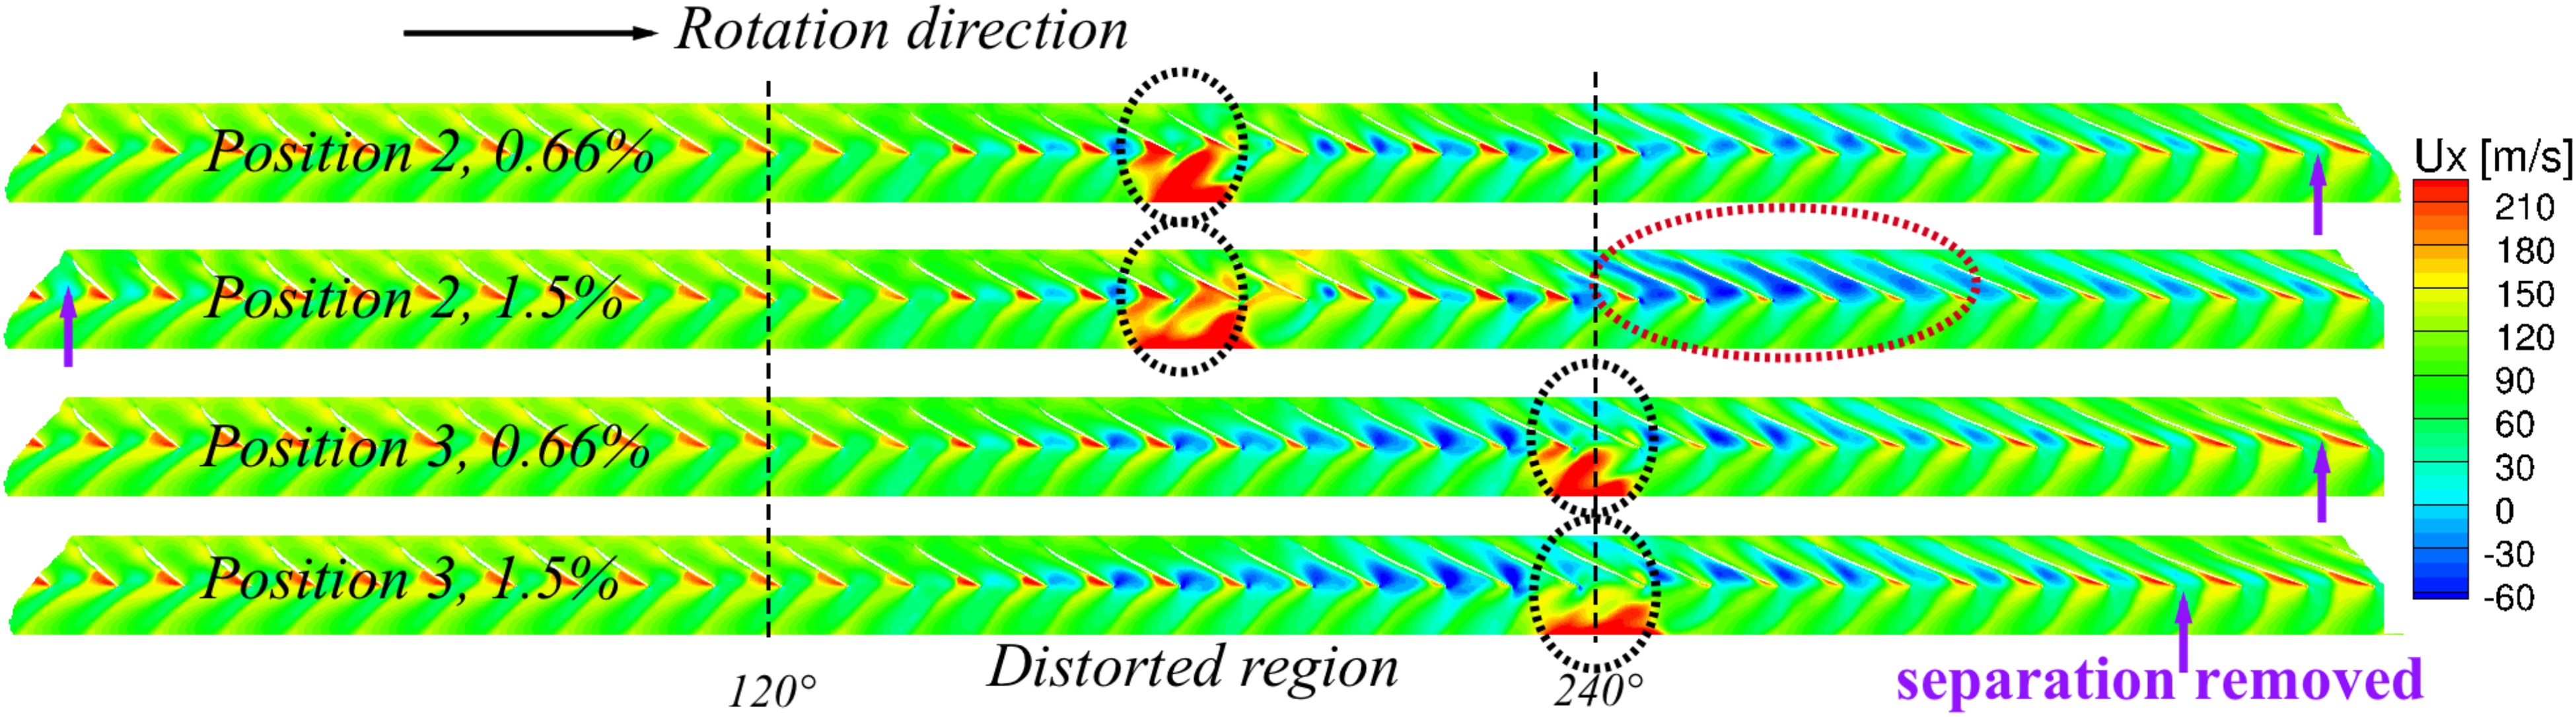
It is interesting to observe that Position 2 has a lower total pressure ratio with larger injected mass flow. This is mainly due to a larger tip blockage in the clean flow region. This is clearly seen by the area within the red ellipse in Figure 15, which shows the comparisons of the axial velocity at 98% span for Position 2 and Position 3 with different injected mass flow. This phenomenon is due to larger injections reducing the blockage at the blade tips in the distorted region. Consequently, the axial velocity increases which causes larger circumferential flow migration toward the distorted region (shown in the red circle) and thus larger incidence, which leads to a more severe blade separation. In Position 2, with larger injection the compressor is less capable of removing the flow separation in the clean flow region. Thus, the injection at Position 2 is beneficial when the injected mass flow is small, but the overall performance becomes poor when larger injected mass flow is used. In contrast, the separation in Position 3 disappears faster in the clean flow region. Another reason is further reduction of the loading of the blades in the distorted flow region.
Defining the stall margin as (Sanger, 1976):
where
Conclusions
Extensive computations of NASA stage 35 were carried out with and without inlet distortion. Good agreement between CFD and experimental data was obtained.
The computations with both inlet distortion and tip injection were performed for stage 35. It was found that tip injection can effectively extend the operational mass flow range and increase the total pressure ratio near the stall boundary. The underlying mechanism is the reduction of incidence which reduces the loading of the blade, the removal of the flow separation, which postpones the occurrence of stall.
When only one injector is used, the most effective circumferential position of the tip injection for stall control is at the border where the blade just leaves the distorted flow region and enters the clean flow region (Position 3). The underlying mechanism is that the incidence is the largest at this position and it is where the stall is initialised. For this case, a 0.66% injection can extend the stall margin by 2.7%. The injection in the clean flow region (Position 1) decreases the total pressure ratio and moves the compressor to a lower rotational speedline when it is near stall. Injection in the distorted region (Position 2) has similar effects with that in Position 3.
When the injected mass flow increases, the overall performance and stall margin of Position 3 increases. However, for Position 1, there is no improvement in the compressor performance, and it is even unfavourable for Position 2.
Future work
Based on the findings in current work, a promising strategy can be proposed: using larger injection at position 3 and smaller injection at position 2 simultaneously. By combining the injection at these two positions, the stall margin can be extended while the total pressure ratio is increased at near stall condition.