
Introduction
Prior publications related to the test case aimed to provide a reliable database both experimental Klausmann et al. (2022) and numerical He et al. (2023) for high pressure compressor flows, that can be accessed by the turbomachinery community to improve prediction methods.
Besides optimized geometries to improve efficiency, a major trend is to reduce engine weight. This leads to lighter designs with fewer and thus higher loaded stages. In state-of-the-art engines especially the high-pressure compressor (HPC) front stages are manufactured as integral bladed disks (BLISK) providing high potential in weight reduction but come with the disadvantage of low structural damping. In conjunction with thin blade designs this leads to a large vulnerability to blade vibration. Besides this general trend in conventional engine design, future trends tend to include low engine order excitation, e.g., boundary layer ingesting designs. This implies that good prediction of high cycle fatigue (HCF) of compressor components is a key enabling technology to further improve engine efficiency. Prior research has indicated that despite the increasing computational capacity, limitations persist in achieving the necessary confidence levels for predicting blade vibration, (e.g., predicting maximum deflections and damping) Holzinger et al. (2015). Therefore, to further improve theoretical and numerical models, experiments at realistic operating conditions are crucial.
To tackle these challenges the H2020 funded project ARiAS aims to improve the prediction capability of methods used to analyze aerodynamically induced blade vibrations in aircraft engines, by conducting extensive experimental and numerical investigations by multiple academic and industrial partners. At the Transonic Compressor Darmstadt (TCD1) at the Institute of Gas Turbines and Aerospace Propulsion (GLR) detailed investigations on compressor forced response were conducted at a representative high-pressure compressor front stage using different up- and downstream excitation features to excite the BLISK rotor at several resonance crossings. Using extensive steady and unsteady instrumentation the general compressor characteristics, the aerodynamic influence of introduced excitation features and the related forced response vibrations can be investigated. This work introduces the experimental investigations, describing the used excitation configurations and measurement procedures and concludes the general impact on aerodynamics and aeroelastics of the investigated configurations.
In order to predict forced response amplitudes, thus High Cycle Fatigue (HCF), it is necessary to solve the aeroelastic problem as formulated, assuming a harmonic solution, in Equation 1. Where
This division leads to the possibility that unsteady aerodynamic forces can be solved independently from the coupled forces in an transient CFD simulation, while the aerodynamic damping resulting from the coupled forces are determined via a flutter analysis. To strengthen this approach, this study offers experimental evidence that the damping is independent from unsteady aerodynamics for a prevalent forced response problem. It achieves this by offering experimentally assessed damping for varying aerodynamic conditions and different external forcing.
Methodology
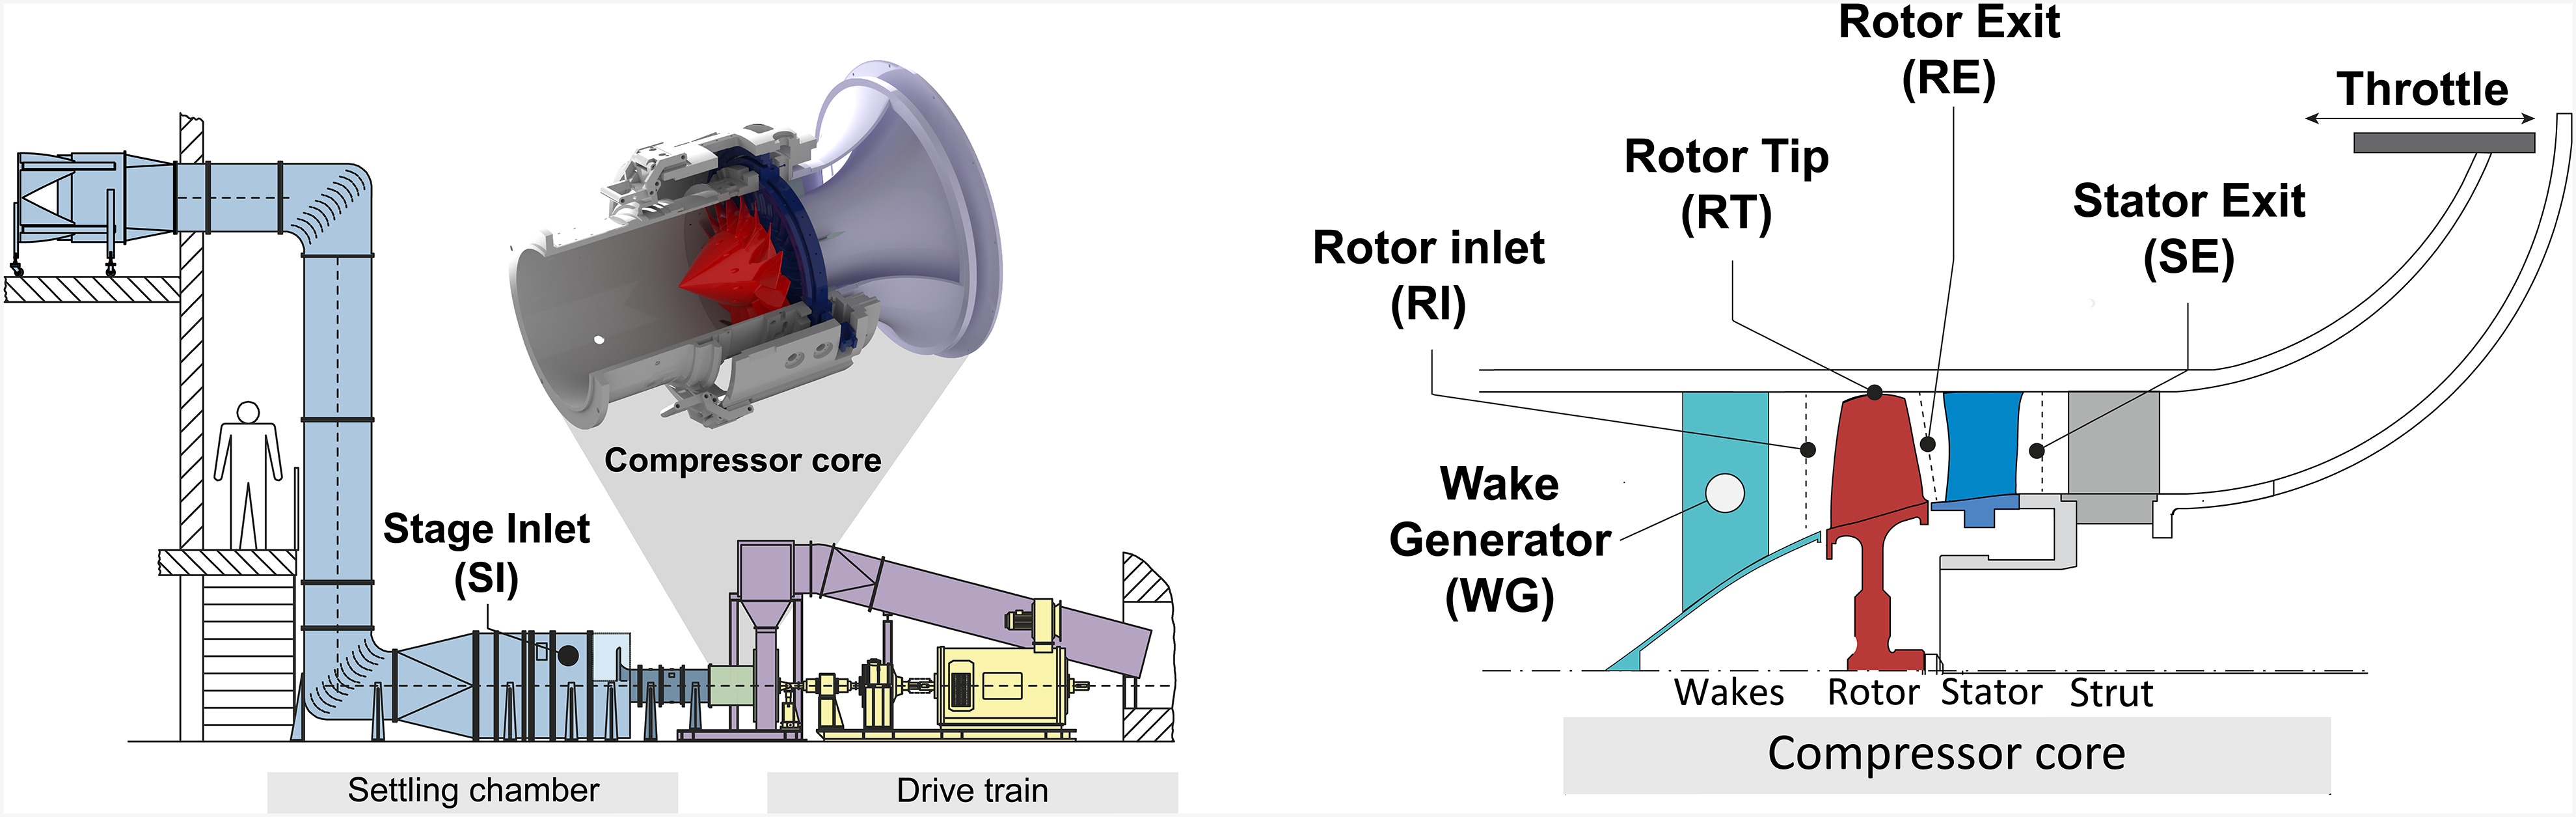
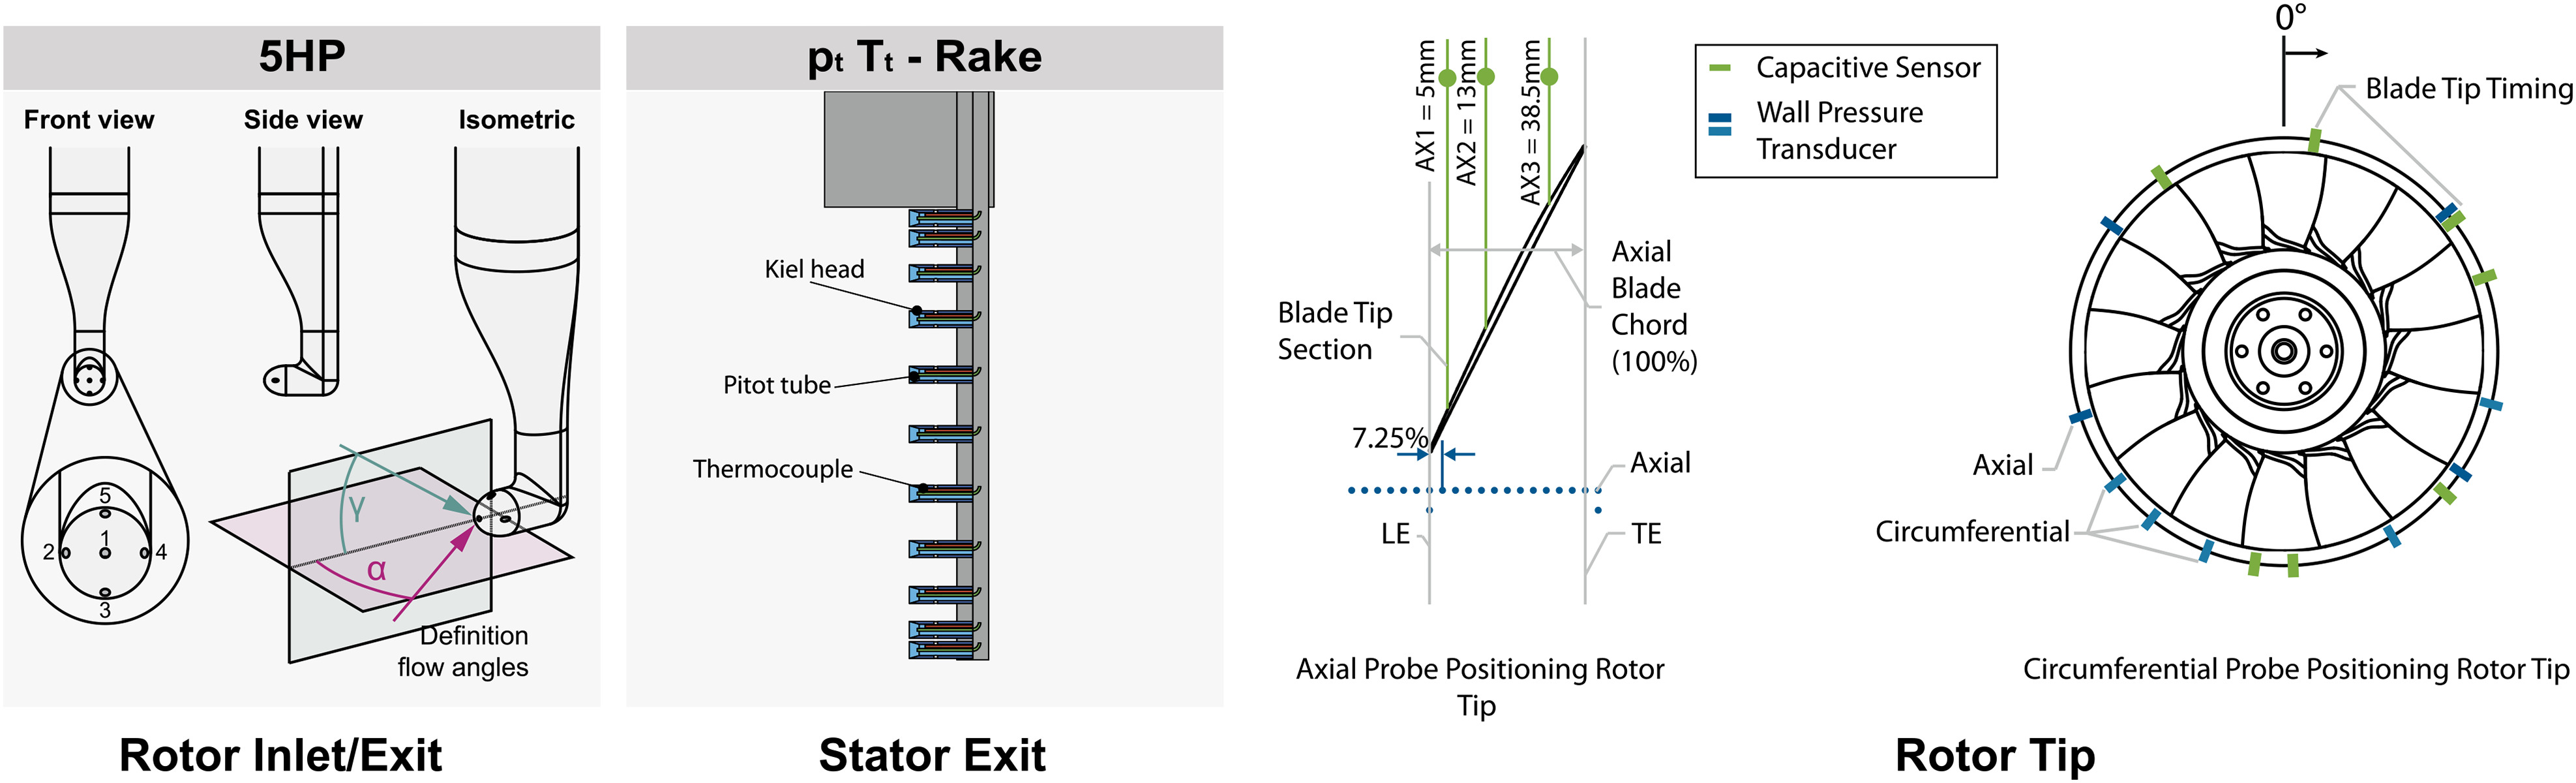
The experiments were conducted at the TCD1 test facility. A detailed description of the open loop wind channel for high-pressure compressor front stage tests at TRL level 4–5 can be found in the introduction of the Darmstadt Open Test Case in Klausmann et al. (2022). Table 1 lists the relevant characteristics. Figure 1 illustrates the test facility (left) and introduces relevant test sections (right). For the purpose of the ARiAS project the open test case stage, comprising a BLISK rotor with 16 blades and an CFD optimized stator with 29 vanes is modified by introducing a wake generator module (WG) upstream the stage. The rotor attached spinner is removed and replaced. The 360° traversable wake generator module is designed to hold 3–16 equally spaced inlet guide vanes. By the introduced wakes an intentional excitation of a specific resonance can be achieved. For simplicity, the inlet guide vane geometry is replaced by symmetric NACA0012 vane. The investigations considered in this study involve the determination of Stage Inlet (SI) conditions in the settling chamber. The aerodynamic impact of introduced excitation features on the rotor inflow and outflow is assessed through the use of traversable five-hole probes (5HPs). The probe and related definitions are depicted in Figure 2 on the left. The compressor characteristics are evaluated using inlet conditions (SI) and combined total pressure and total temperature rakes in the Stator Exit (SE). The Rotor Tip (RT) instrumentation includes blade tip timing probes and unsteady wall pressure transducers. Blade tip timing sensors are instrumented in seven circumferential and three axial planes relative to the rotor to obtain an optimized signal for a wide range of blade mode shapes. The circumferential distribution is optimized to achieve the highest accuracy for Blade Mode 1–6, while maintaining a good signal quality for simultaneously measured tip clearance.
Table 1.
Darmstadt open test case key characteristics.
| max. power | max. torque | Design speed | Design mass flow | Shroud radius | Tip gap |
|---|---|---|---|---|---|
| 800 (KW) | 350 (Nm) | 20.000 (rpm) | 16 (kg/s) | 189.2 (mm) | 0.8 (mm)/0.85% Chord Length |
The configurations of interest are presented in Figure 3 on the left. Configurations E and EP15 are composed of 3 equally spaced NACA0012 vanes and are designed to introduce an excitation of Engine Order 3 and harmonics. Similarly, configurations F and FP15 consist of 8 equally spaced NACA0012 vanes and are intended to excite EO8 and its harmonics. The inclusion of the “P15” suffix in the configuration names denotes the use of a NACA stagger angle of plus 15° for all vanes in rotor direction. This staggering is expected to significantly alter the level of forcing. The Campbell diagram for the studied rotor is presented in Figure 3 on the right. Although several resonances can be observed during operation, this work focuses solely on the highlighted ones. Mode 1 EO 3 is present during operation with configurations E and EP15, while Mode 2 EO 8 and Mode 3 EO 8 occur during operation with configurations F and FP15. The corresponding measured frequencies are summarized in Table 2, which includes both, the frequencies measured during operation using the blade tip timing system and those of the corresponding modes investigated with a miniature hammer impact excitation measurement, as described in a patented approach Kühlhorn and Beirow (2010). Both measurements suggest the presence of unintended mistuning, its impact on this specific test case will be further explored in future publications. The variation in resonance frequency indicated for the values in operation is attributed to differences between single resonance sweeps and operating conditions, as shown by Kilian et al. (2022).
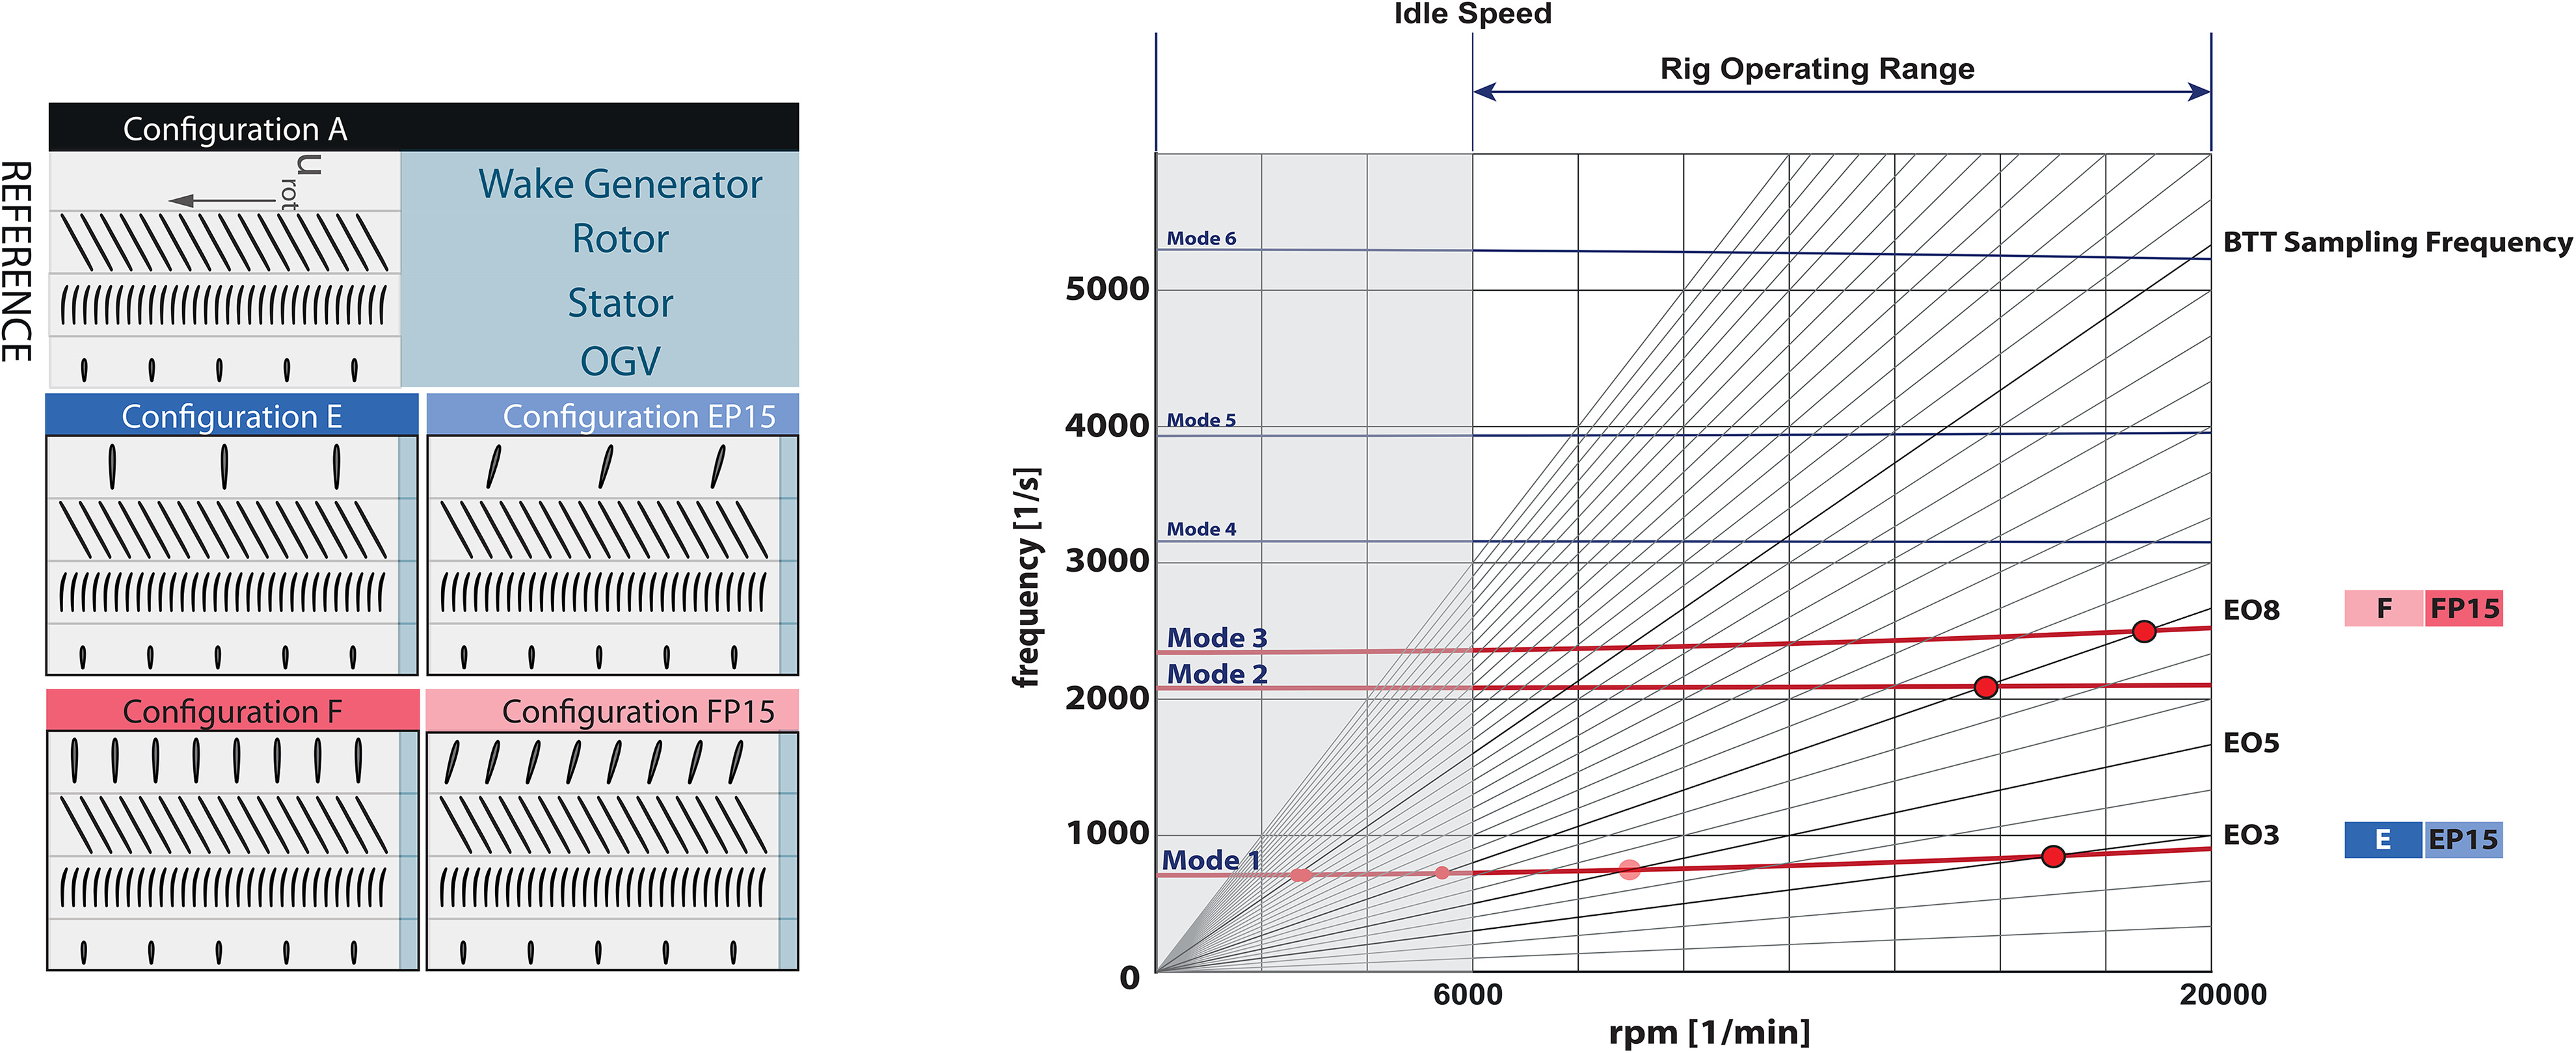
Table 2.
Overview investigated resonances.
| Frequency (Hz) | Frequency split (%) | |||||
|---|---|---|---|---|---|---|
| Mode | Crossing | Rotating | Non-rotating | Rotating | ND (−) | Shape |
| M1 | EO3 | 859.36 | 726.9 | 0.75 | 3 backwards traveling | 1F |
| M2 | EO8 | 2177.01 | 2169.5 | 0.80 | 8 standing | 1T |
| M3 | EO8 | 2548.25 | 2403.2 | 1.79 | 8 standing | 2F |
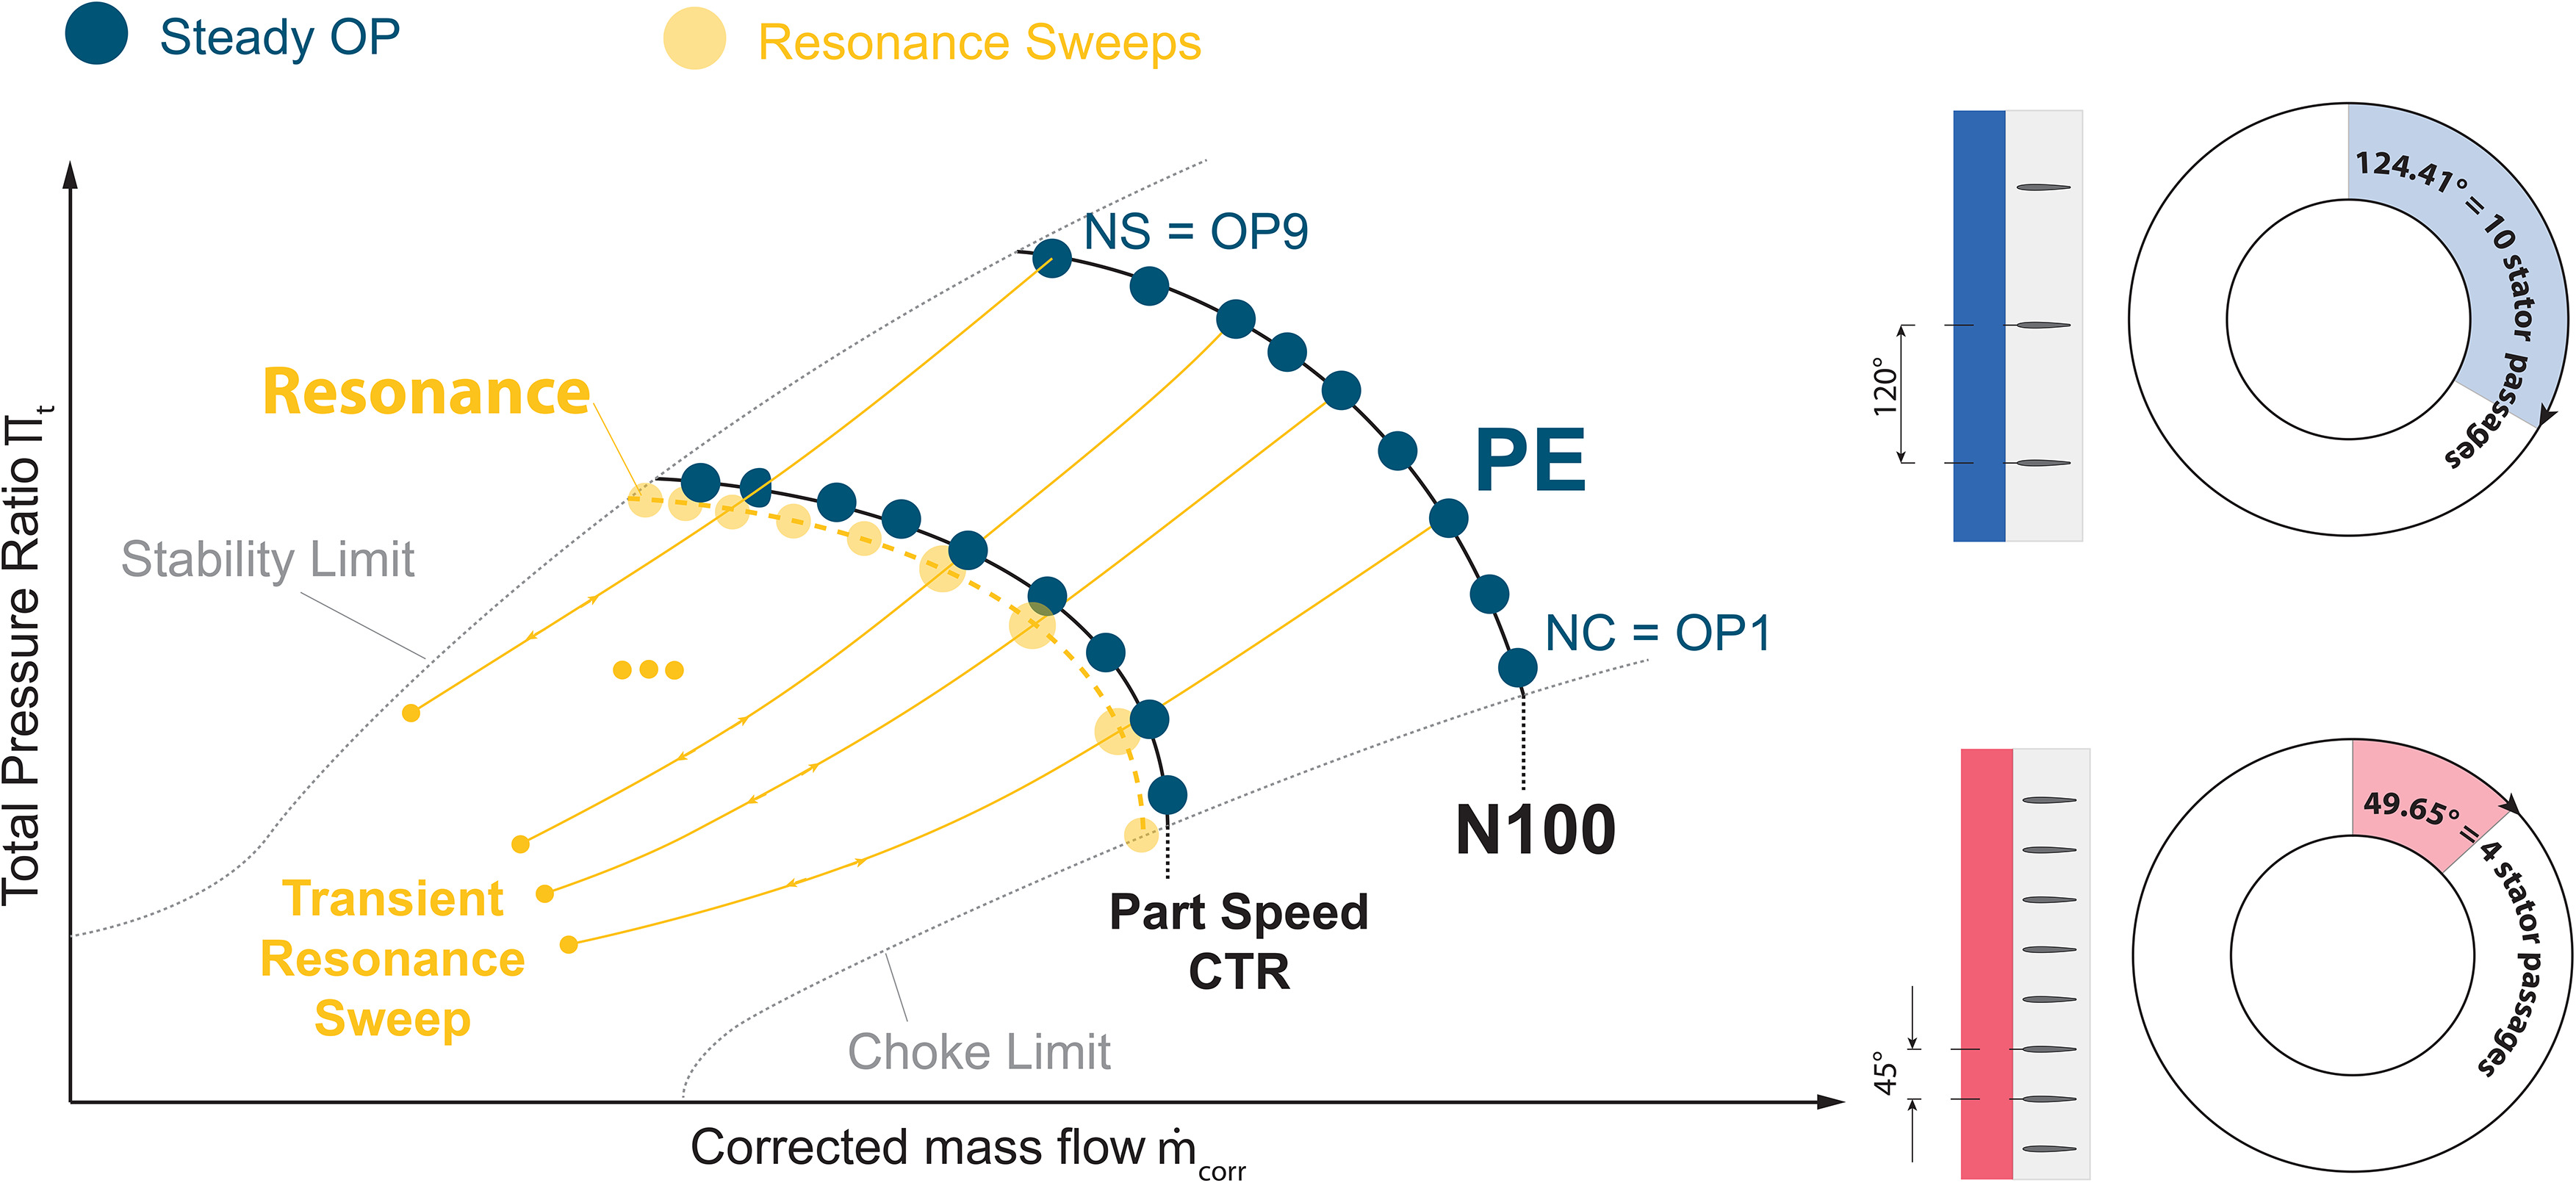
Figure 4 illustrates the conducted measurement procedures. To investigate the aerodynamic disturbances introduced and their corresponding resonance behavior, this study follows specific test procedures for each configuration. These involve stationary measurements (indicated in blue) at both nominal speed and close to the identified resonance condition (CTR). Despite the global characteristics, this paper focuses on comparing aerodynamics at the compressor design point denoted at nominal speed, which corresponds to the peak efficiency (PE) condition. In order to capture the aerodynamics related to the introduced upstream excitation features, measurements of at least one wake generator vane pitch are required. Specifically, for EO3 pattern, a 120° pitch, and for EO8 pattern, a 45° pitch must be considered. In the stator exit, the dominant flow features are related to the stator vanes. Therefore, an integer multiple of the stator vane pitch is always considered to determine the stage performance. For EO3 pattern, 10 stator passages are considered, and for EO8 pattern, 4 stator passages are considered. In order to investigate the resonance behavior during transient acceleration and deceleration maneuvers a set of nine predefined throttling conditions, OP1 to OP9, are considered (indicated in yellow). OP1 represents the near choke (NC) operating condition, OP3 denotes the peak efficiency (PE) operating condition, and OP9 represents the near stall (NS) operating condition. These resonance sweeps are conducted for all four wake generator configurations and two different rotor tip clearances to obtain blade tip timing data on the three resonances M1 EO3 (observed through configurations E and EP15), M2 EO8 and M3 EO8 (observed through configuration F and FP15). To investigate the effects of different clockings and acceleration speeds, several variations are explored. However, the presented data includes information only on resonance sweeps where the wake generator to stator relative clocking position remains constant and the acceleration or deceleration speed satisfies the Hackenberg criterion Hackenberg and Hartung (2016).
Results and discussion
The primary objective of this work is to present and analyze the aerodynamic variations that arise as a result of the introduced excitation features, along with their impact on the underlying aerodynamic damping within resonance. This includes a description of the resulting stationary rotor in- and outflow and the variations induced by:
Aerodynamic influence of excitation pattern
Figure 5 illustrates the compressor characteristics at nominal speed for the various configurations investigated in this study. The data of the OTC serves as the reference and is depicted by black filled circles. A close examination reveals a high degree of similarity between both configurations without staggered NACAs (E and F). However, the wake generator configurations, which feature a non-rotating endwall in front of the rotor hub, exhibit a minor reduction in the choke mass flow (E: −0.12%, F: −0.14%) as indicated by marker A. Notably, for the open test case, an additional operating point is introduced between choke and peak efficiency conditions.
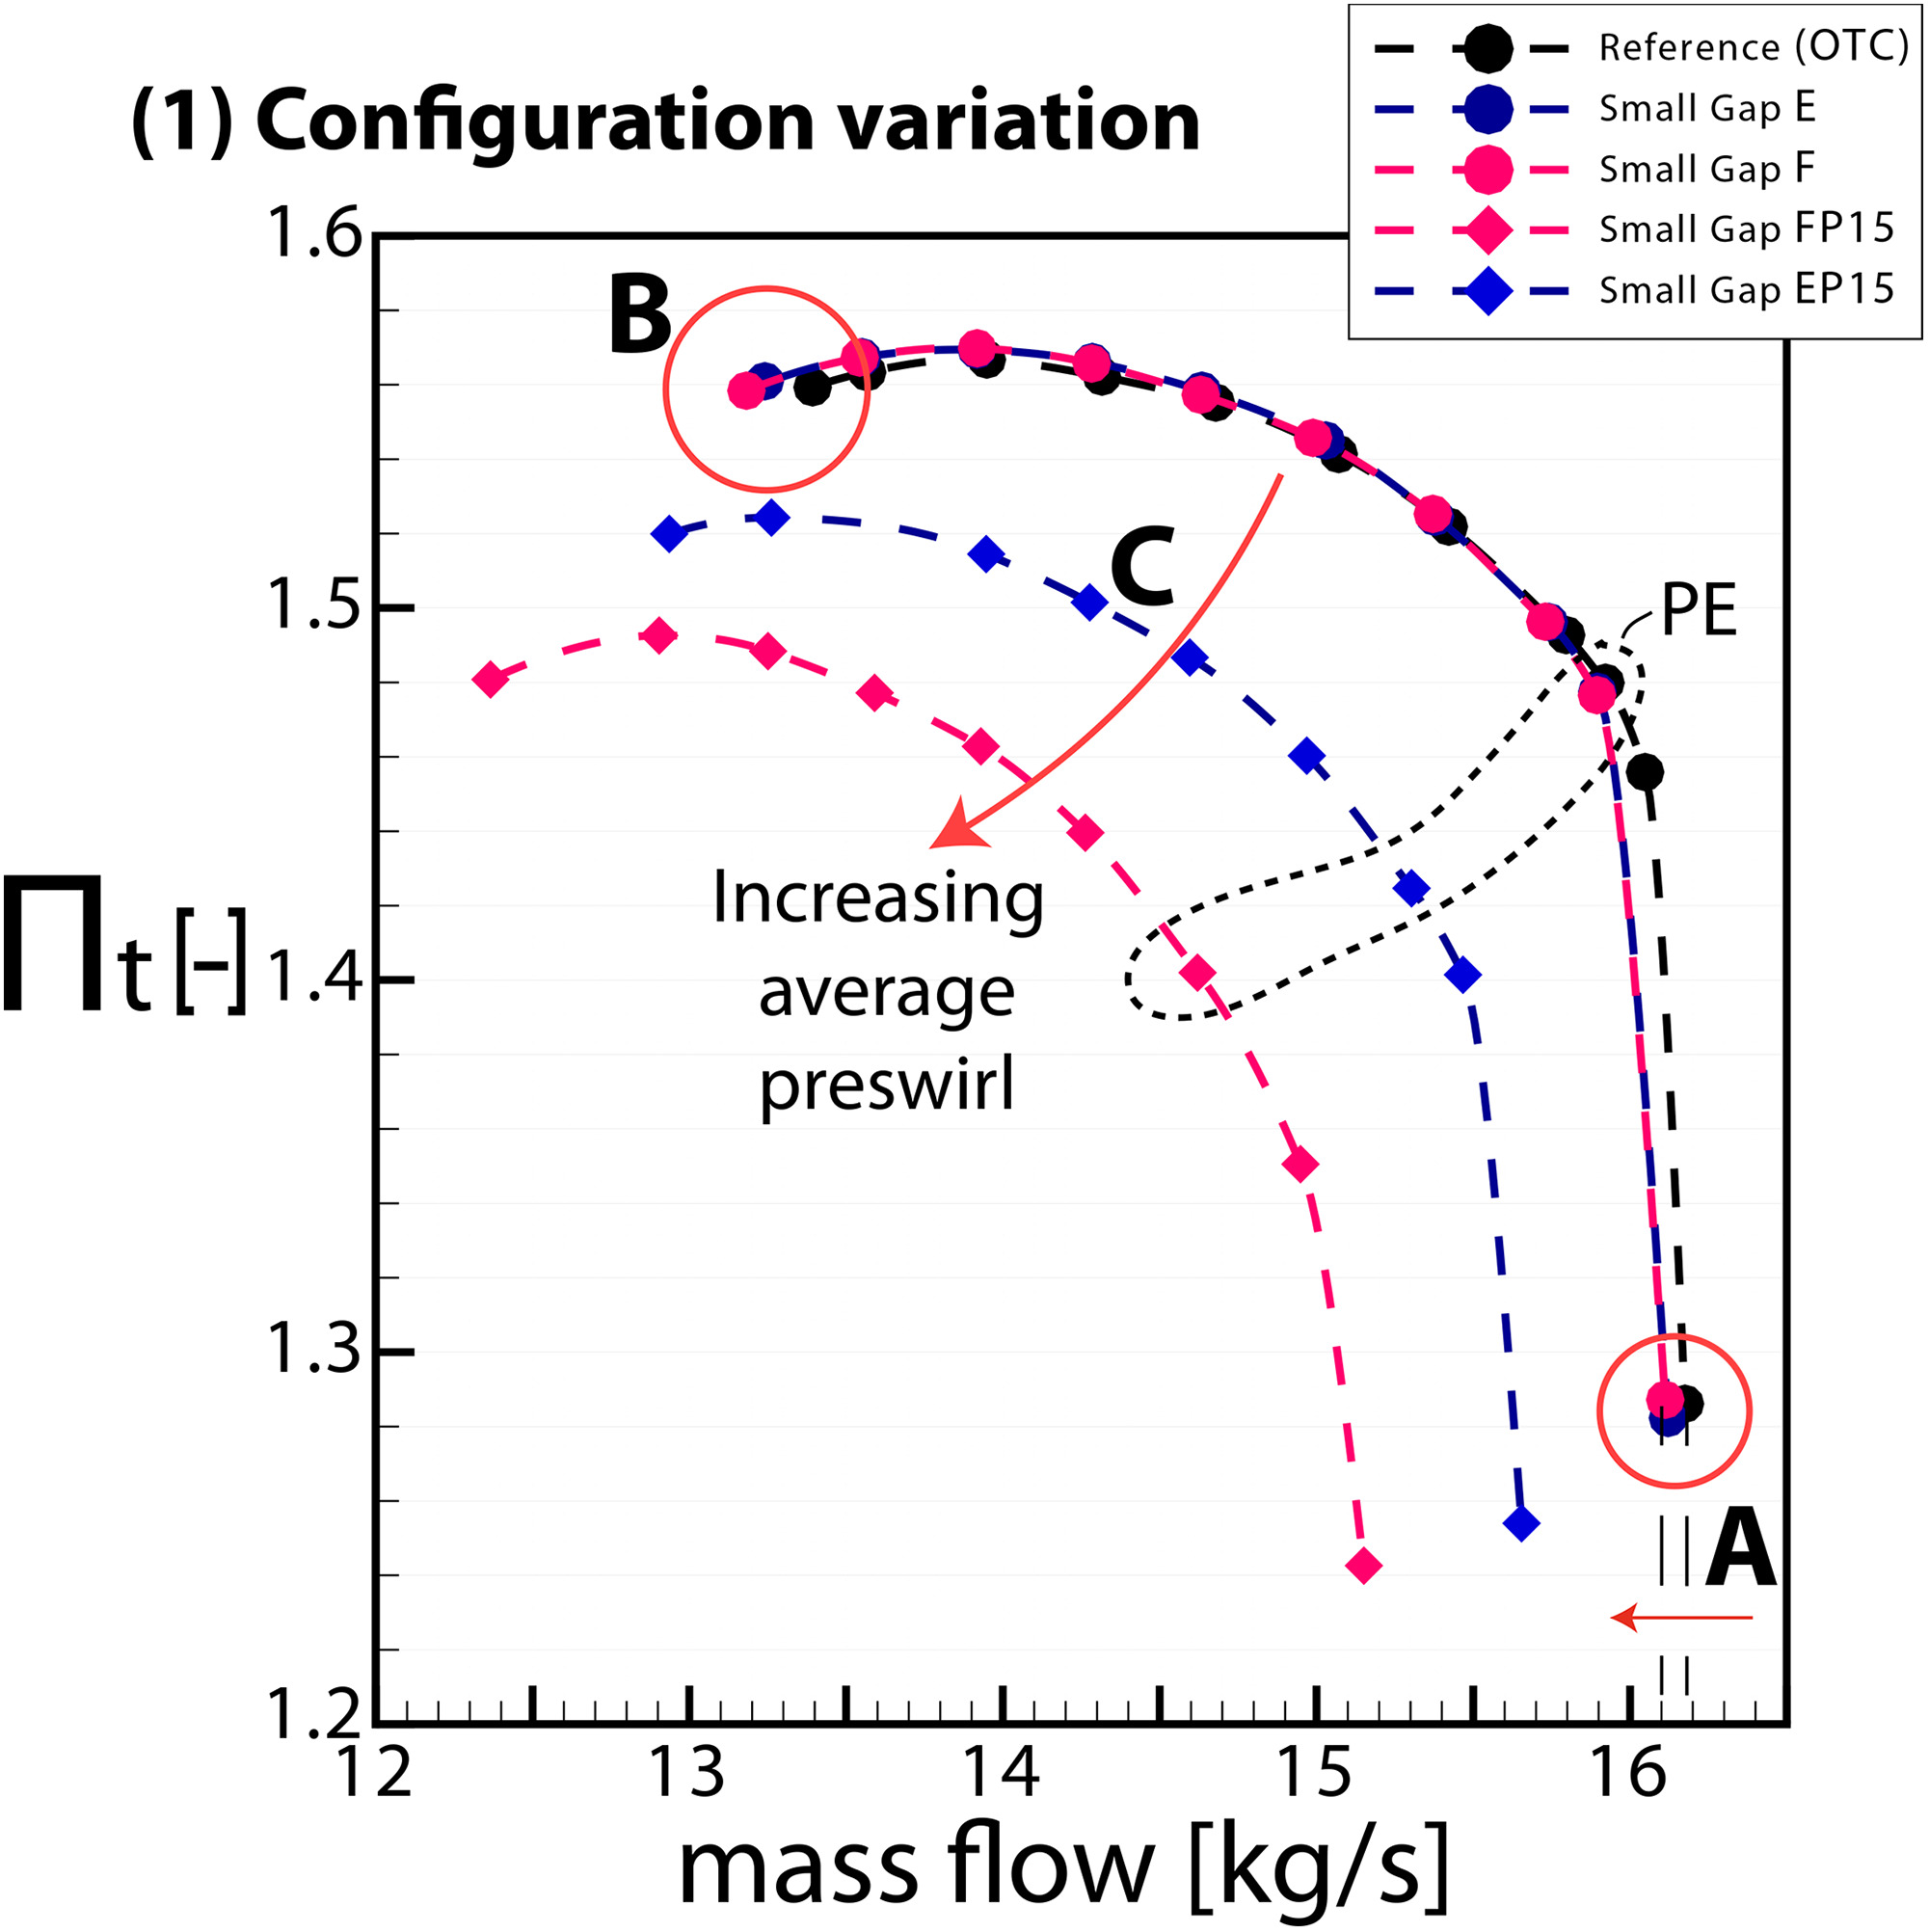
The experimental results indicate a significant decrease in the stall mass flow during transient rig operation for both wake generator configurations, thereby enabling an additional measurement point near stall (E: −1.9%, F: −1.8%) indicated by marker B. It can be presumed that the absence of the rotating endwall of the spinner results in a lower inlet swirl at the rotor hub, leading to a non-negligible change in rotor blade loading at high loading conditions.
The characteristics of the staggered NACA variants exhibit similarities to those expected from the closing of inlet guide vanes Biela (2013). The speedlines are shifted to lower mass flows for increasing average preswirls, thus the average blade loading for EP15 and FP15 is in general lower than for the un-staggered variants indicated by marker C. The comparison of characteristics at nominal speed already reveals significant differences between the staggered and unstaggered variations, suggesting that the stationary aerodynamics during resonances will differ to a similar extent, while the impact on global performance for E and F is comparably insignificant.
As the global characteristics do not give any information regarding circumferential variations, Figures 6 and 7 provide a comprehensive view of the rotor inflow and outflow conditions across the full annulus for N100 PE.
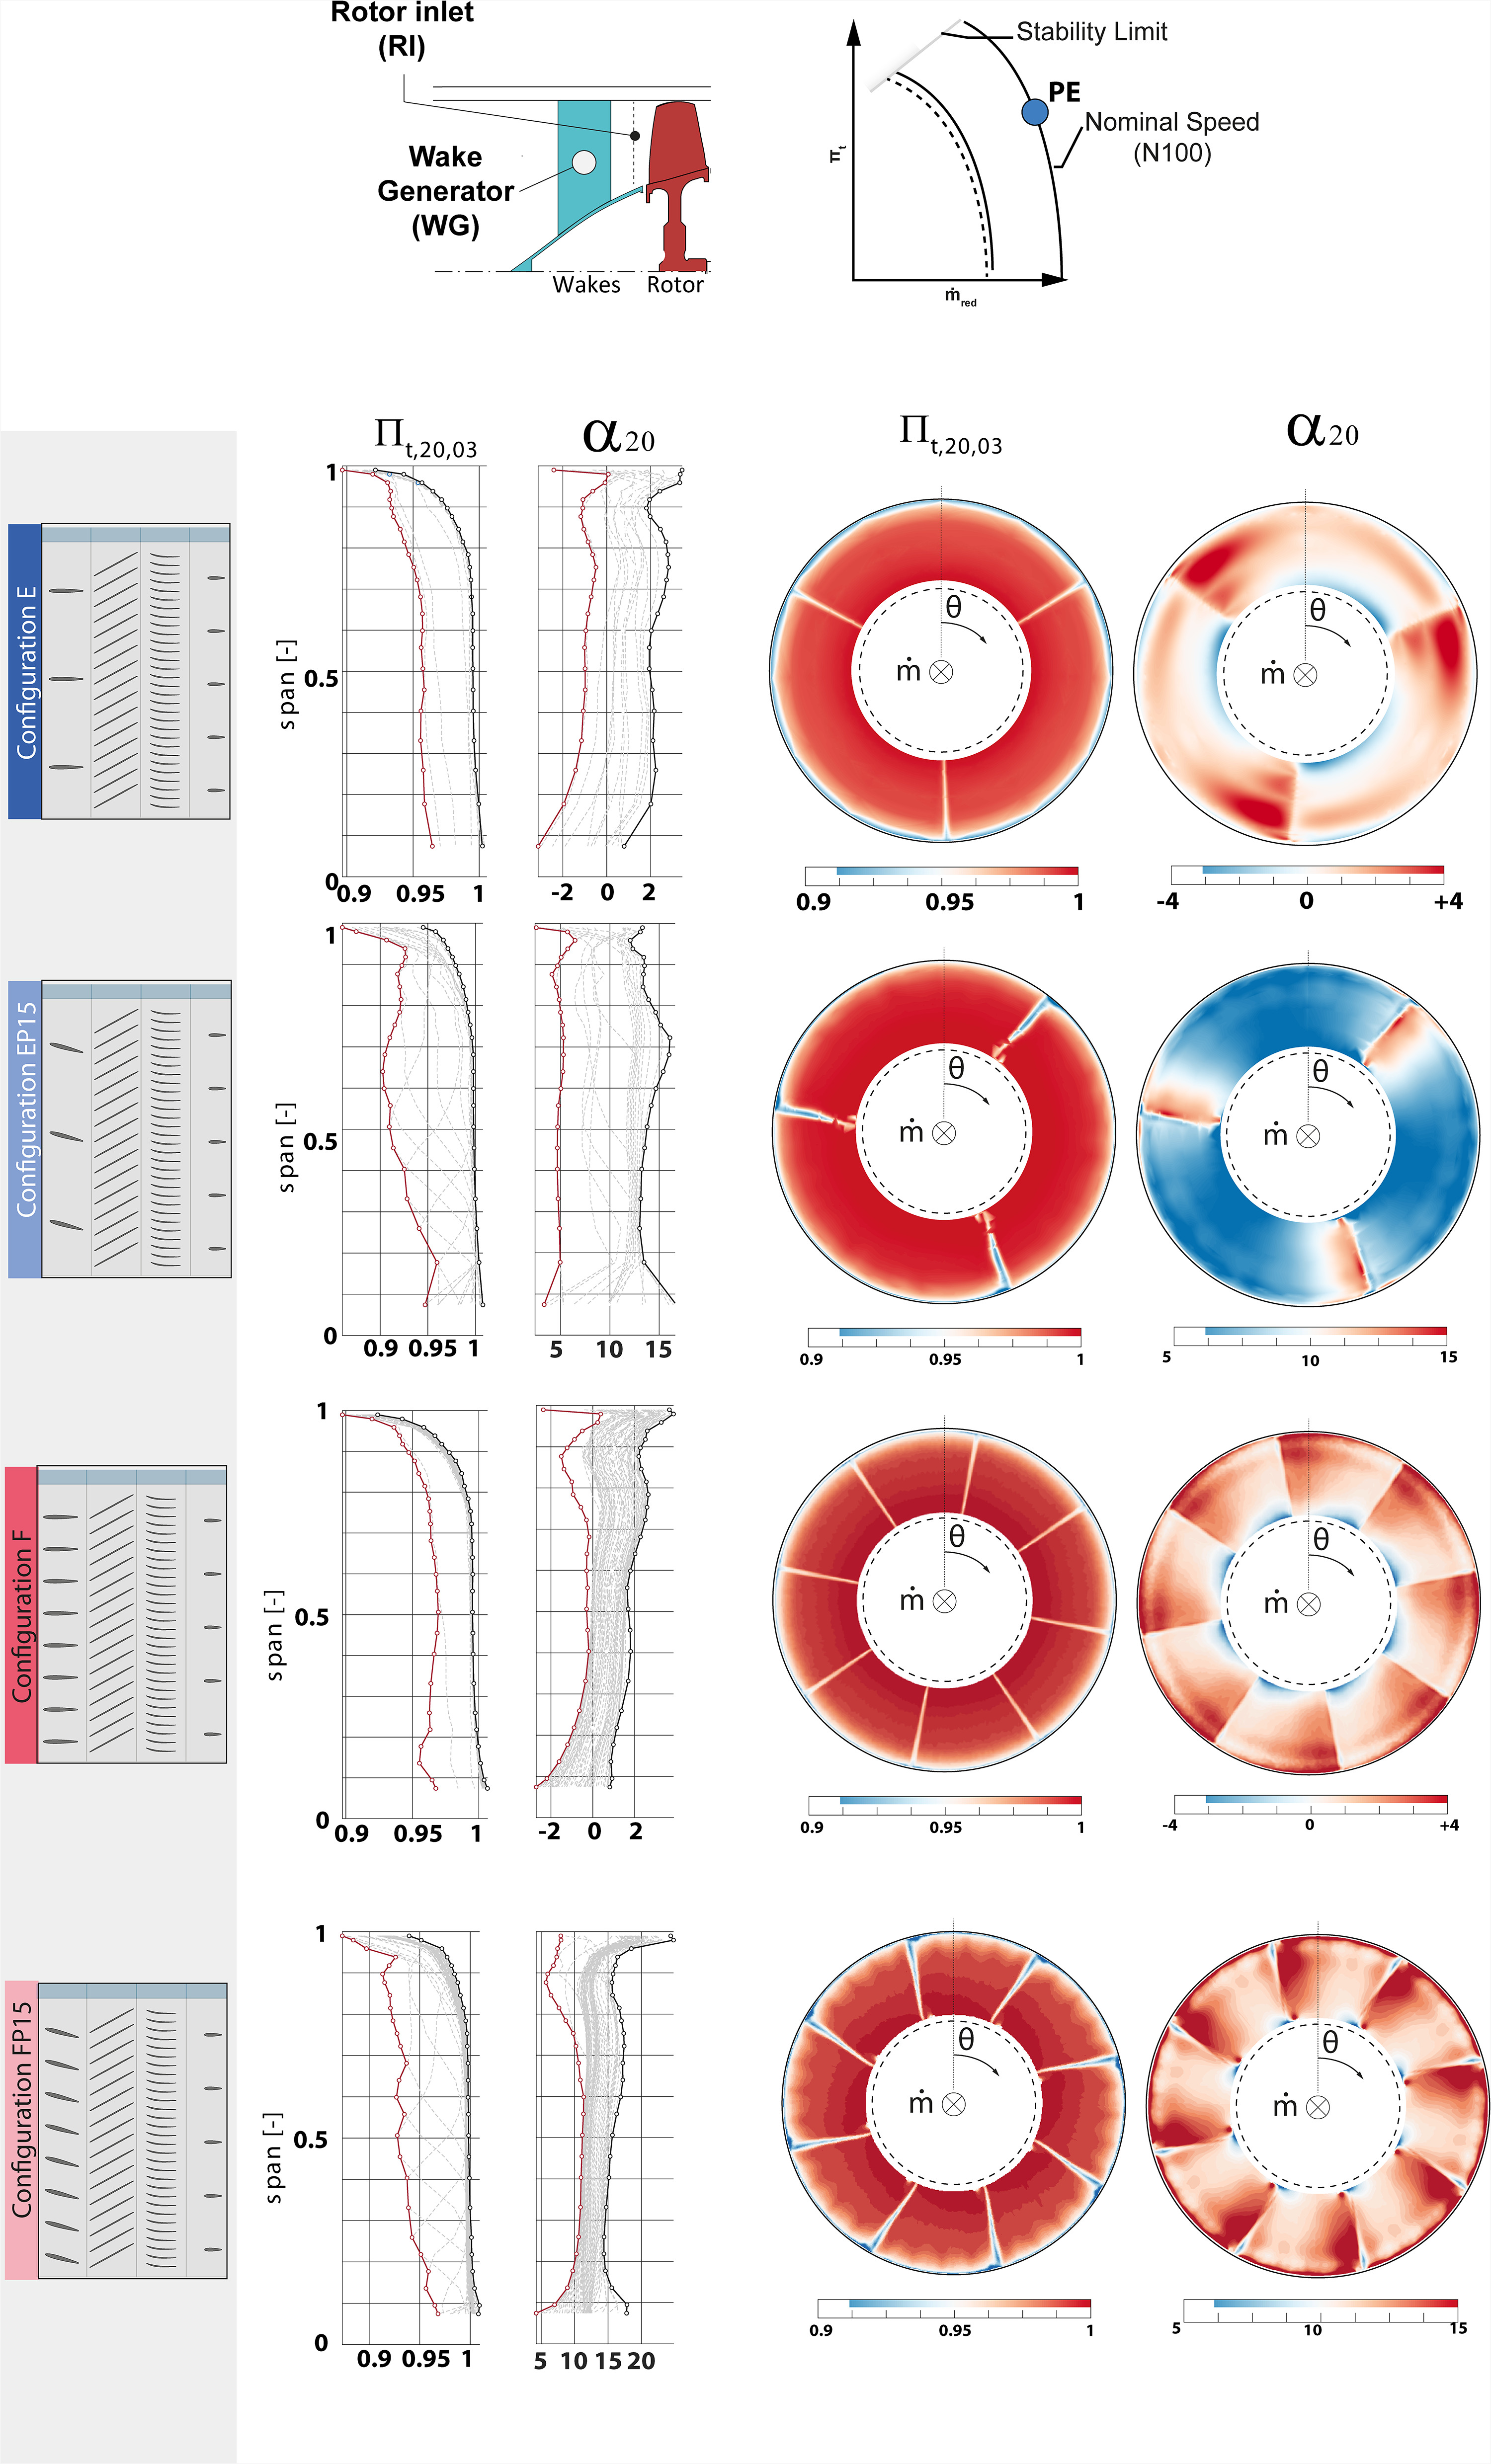
In Figure 6, the inflow characteristics are illustrated. The data shown in the figure is obtained using five-hole probes that are radially inserted between NACA profiles and the rotor. The total pressure loss from the settling chamber (SI) to the rotor inflow is determined by calculating the pressure ratio between the settling chamber and the corresponding probe position position for all configurations, as described in Equation 3.
Additionally, the tangential inflow component is indicated by the preswirl angle, represented by
On the right-hand side, a two-dimensional flow field is depicted to provide further insight into the circumferential extent of the rotor inflow disturbance generated by the NACA profiles. The rotor rotation,
For Configuration E three distinct drops in the total pressure inlet characteristics are present due to the NACA wakes, with a thickness within the magnitude of the blunt NACA trailing edge. The deviation to the main flow reaches a maximum of −5% below 80% channel height. In the upper 20% the inlet boundary layer characteristic can be identified. Here the deviations differ to the main flow, since the wake strength is associated with the axial flow velocity. Thus the lower axial momentum in the boundary layer weakens the wake in terms of total pressure loss. The regions of total pressure loss are also associated with lower axial inflow Mach numbers (not shown for brevity), leading in general to a short inclination of blade loading on the rotor when passing by. Originally, this pattern was designed to provide a forcing mainly due to the described mechanism. The usage of vanes instead of e.g., a grid leads to superimposed effects associated with vane rows. The area averaged inlet flow angle is close to zero, but the radial profiles and the 2D visualization indicate a variation of ±3°. In general the upstream influence of the rotor will inevitably lead to flow deflection into rotor rotation direction within the investigated section. The NACAs straighten the flow at their physical location. Additionally the shock in transonic operation is interacting with the vanes’ leading to the higher positive inlet swirls in the upper 40% channel height, resulting in a slight circulation within the passage, with a negative preswirl close to the hub and a positive preswirl close to the shroud.
Configuration F provides an almost identical inflow characteristic with the same flow features involved but with a smaller circumferential extend. Compared to pattern E the spatial resolution is increased. Pressure losses in the midspan region of the NACAs show slightly decreased deviation in the inlet total pressure corresponding with a region showing locally lower minimum flow angles.
For both staggered variants (EP15 and FP15) the NACA profile is subjected to higher aerodynamic forces, thus the profile’s surface is divided into pressure and suction side. A significant low pressure area in the corner between shroud and vane suction side indicates the presence of part gap leakage flow present due to the necessary part gap for vane staggering. A similar feature can be assumed at the corresponding position at the hub, which is slightly indicated in the data for FP15, but not fully resolved since the probe could only be traversed below 7% channel height.
The mean preswirl is clearly altered, resulting in an area-averaged inlet swirl of 6.8° for configuration EP15 and 11° for pattern FP15, thus the influence on the compressor characteristics is significantly higher for FP15. This indicates that neither configuration is capable of effectively turning the flow towards the geometric vane angle of 15°. As a result, the three profiles of pattern EP15 must withstand a higher loading than those of FP15, leading to a more pronounced total pressure loss in the wake. This is evident when comparing the minimum and maximum values, which reach their maximum of 10% total pressure deficit at 60% span for pattern EP15, while maintaining at approximately 7% for FP15.
The inflow characteristics present a very narrow and defined excitation for the unstaggered variants E and F, where globally the flow seems to be little disturbed and the excitation due to the wakes is induced by a distinct drop in total pressure and axial velocity, leading to a short increase in blade loading of the rotor when passing by.
The staggered variants on the opposite provide an increased forcing due to a more pronounced wake that is resulting from an increased loading on the vane. Additionally, inflow angles provide a variation within a large extend of the passages.
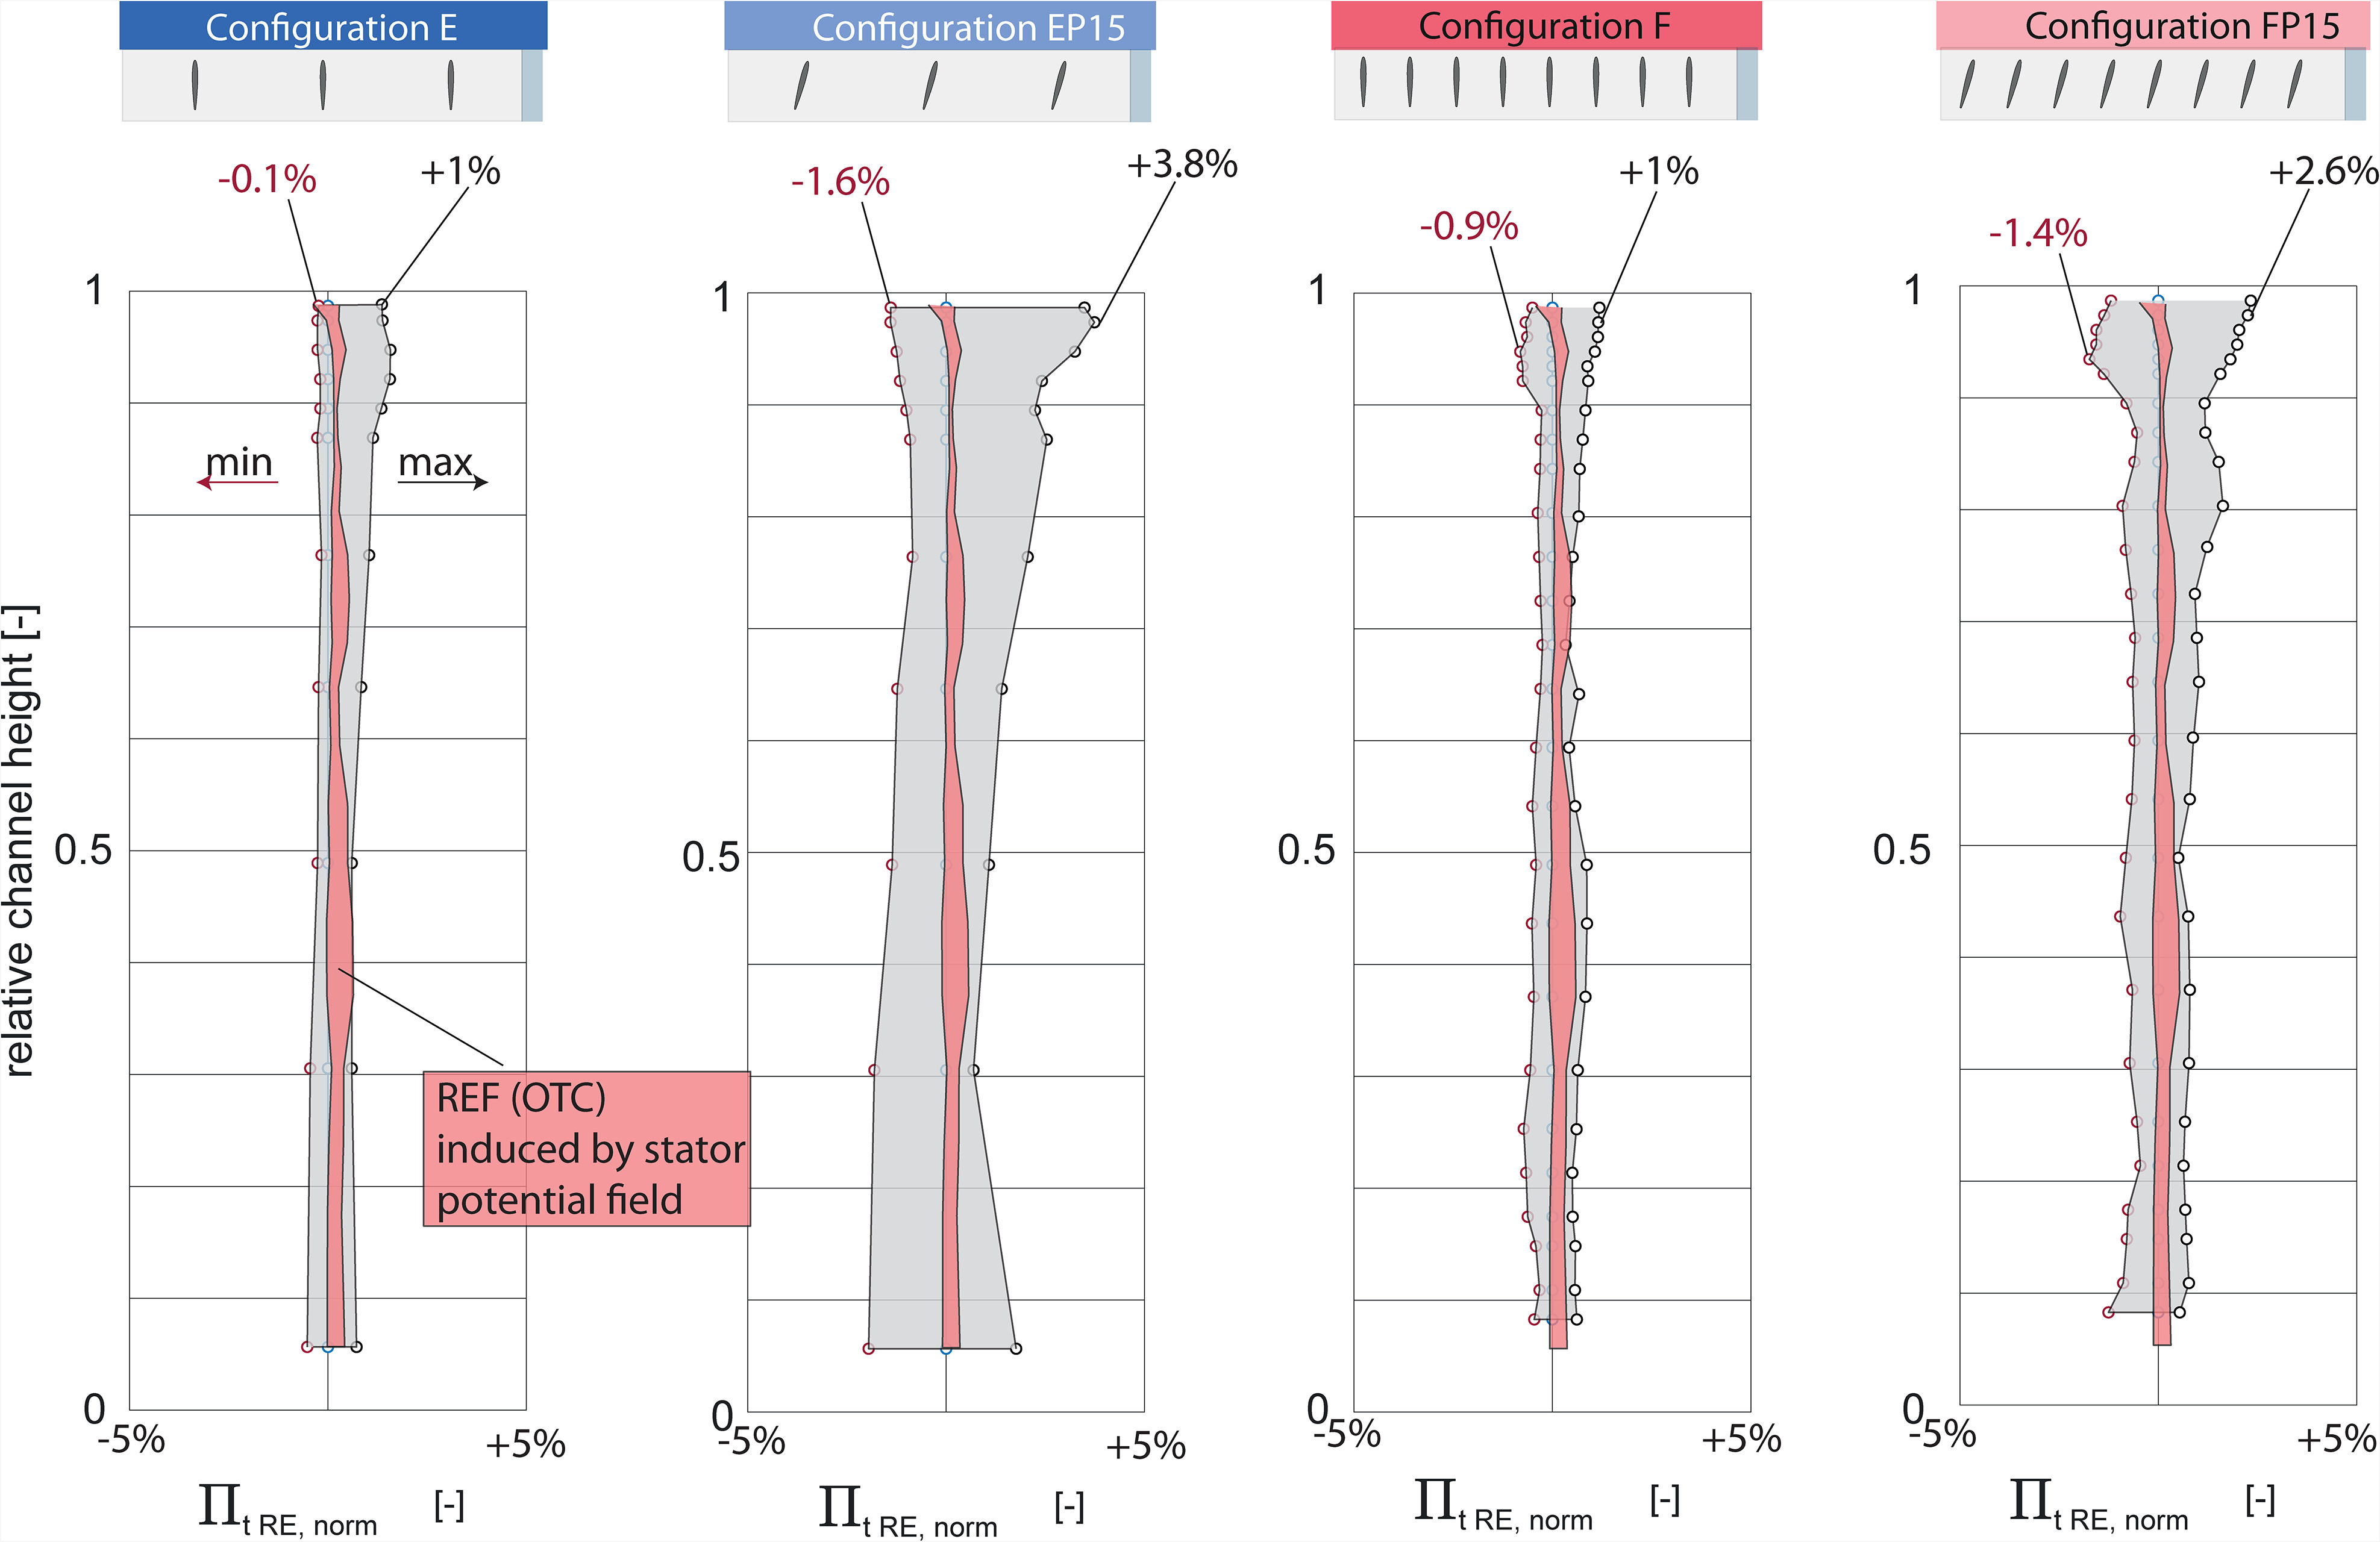
To qualitatively evaluate the varying levels of influence based on stationary probe data, Figure 7 demonstrates the impact on total pressure rise through the rotor. To compare the different setups, the total pressure ratio is normalized by the weighted average value at each channel height, as specified in Equation 4, resulting in a relative deviation plot in total pressure. The minimum and maximum deviations are once again indicated.
For reference, the variation induced by the stator potential field is normalized accordingly and plotted as red area. This data is obtained without excitation feature and consists of 6 stator relative measurement positions. For all configurations the highest variation is evident in the upper 10% channel height, indicating that the varying inlet conditions foremost influence the rotor tip flow and associated tip leakage. For the unstaggered variant E and F the deviation below 60% is in the range of the stator induced fluctuations. Consistent to the high inlet disturbance for the staggered variants the rotor exit characteristics are varying significantly more in comparison to E and F and can therefore be associated with a higher forcing for the corresponding resonances. Additionally, it is clear that blade loading conditions and secondary flow phenomena must be significantly influenced for these pattern.
Influence of tip clearance variation on aerodynamics
Besides the different configurations a variation of the rotor tip clearance is investigated, with an increase in the running tip gap at nominal from
Figure 8 shows the corresponding compressor characteristics compared to the nominal case. For both shown configurations a lower peak total pressure ratio, reduced stability margin and lower stage efficiency can be observed. Due to a higher rotor capacity the choke mass flow is slightly increased, similar to findings for comparable stages in Jüngst (2019). Again the straight vane pattern show only slight variations compared to each other.
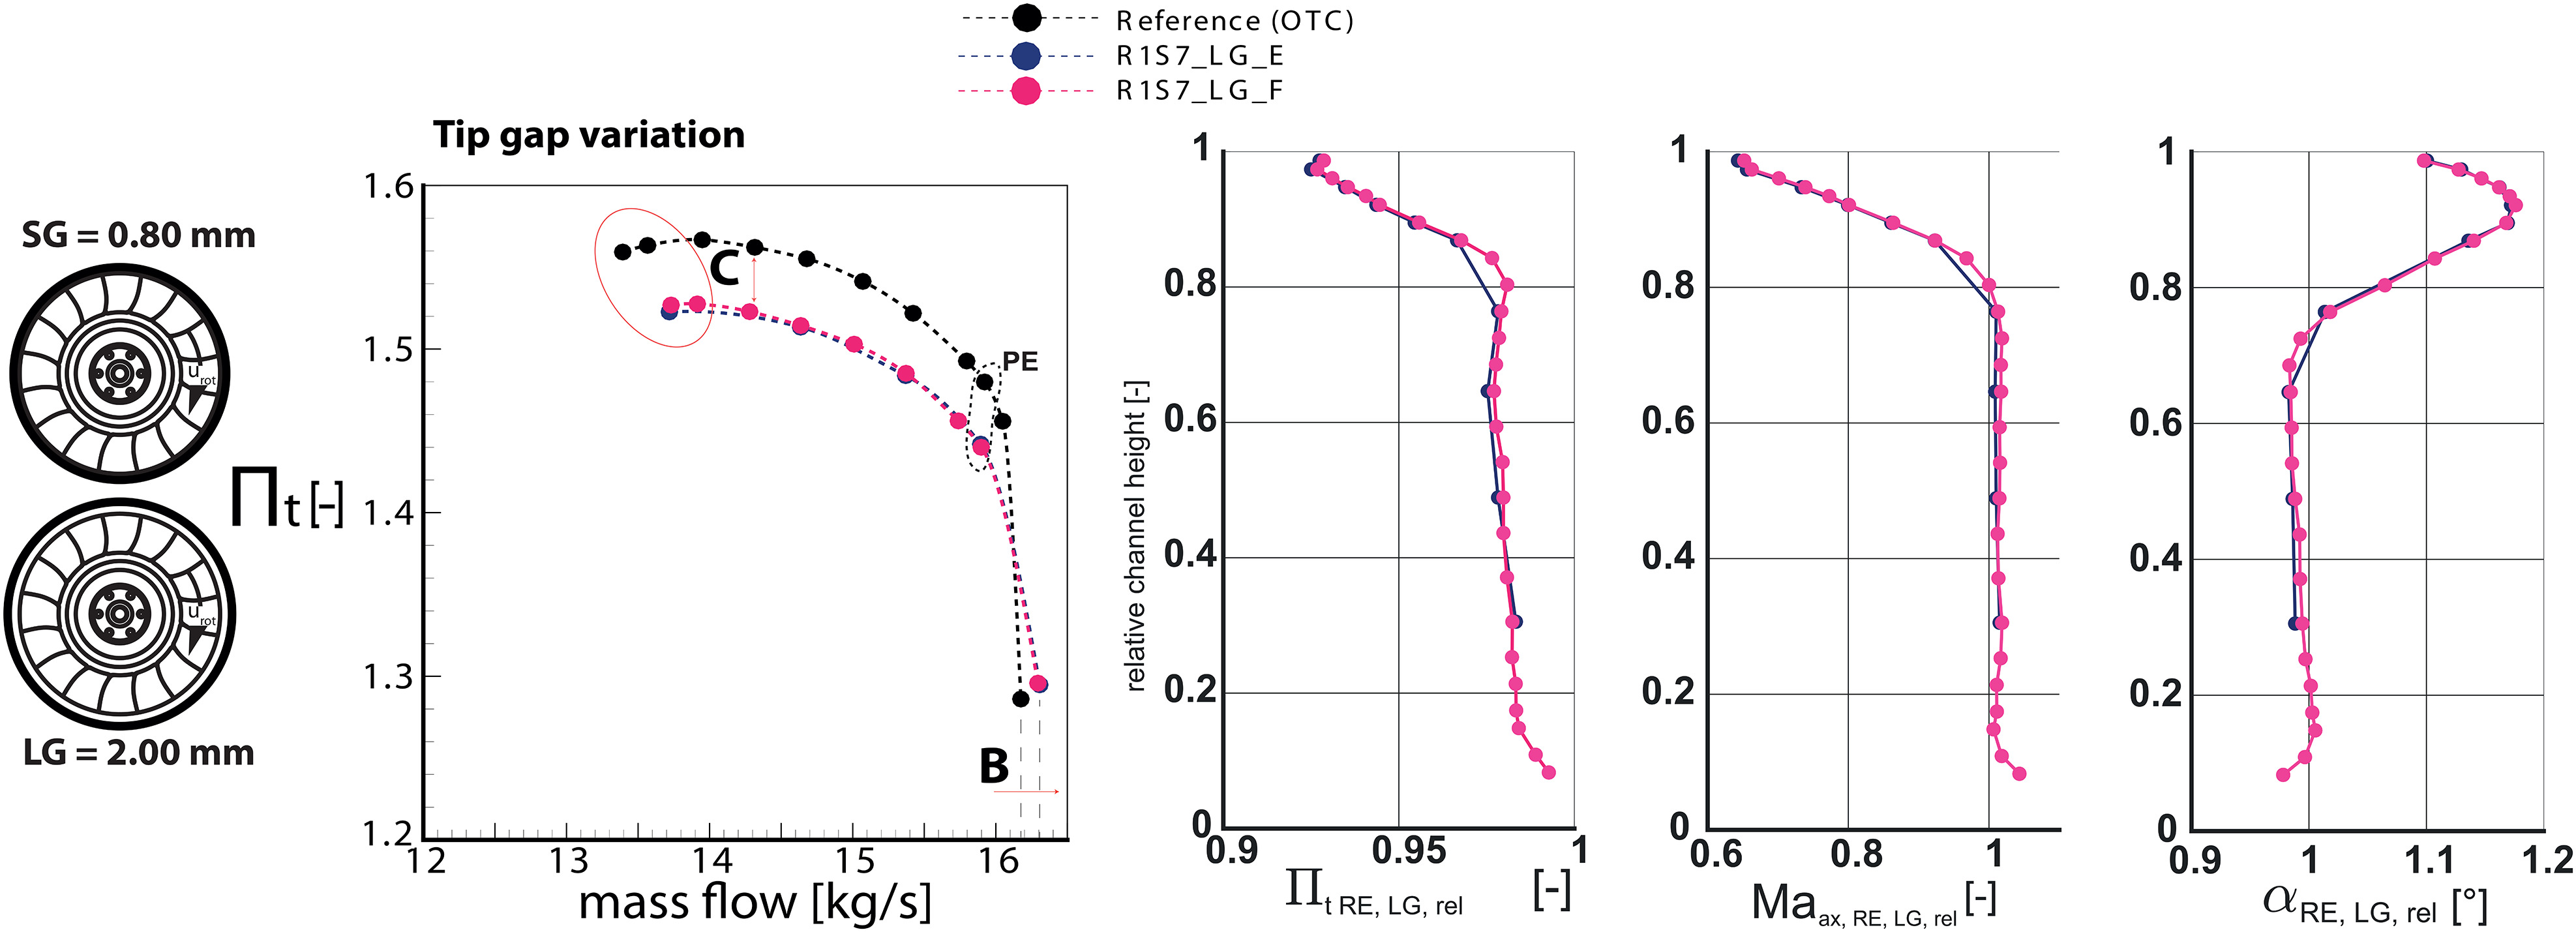
The shown radial profiles conclude the influence on the rotor. The radial profiles are normalized to the corresponding radial exit with identical inflow disturbance and small clearance as denoted in Equation 5. In this Case VAL stands for all plotted variables. Resulting in the corresponding deviation.
Total pressure rise in the rotor is significantly reduced for all channel heights with most significant deficits in the upper 20% channel height, which is contributed by the massively increased losses in the tip clearance vortex and associated interactions with the rotor tip shocks. Simultaneously the axial mach number is decreased while the flow angle is significantly increased. To maintain continuity the axial mach number below 80% is slightly higher. This indicates, that the local blade loading at the tip for similar mass flows is significantly higher with larger tip clearance.
Influence on system damping in resonance
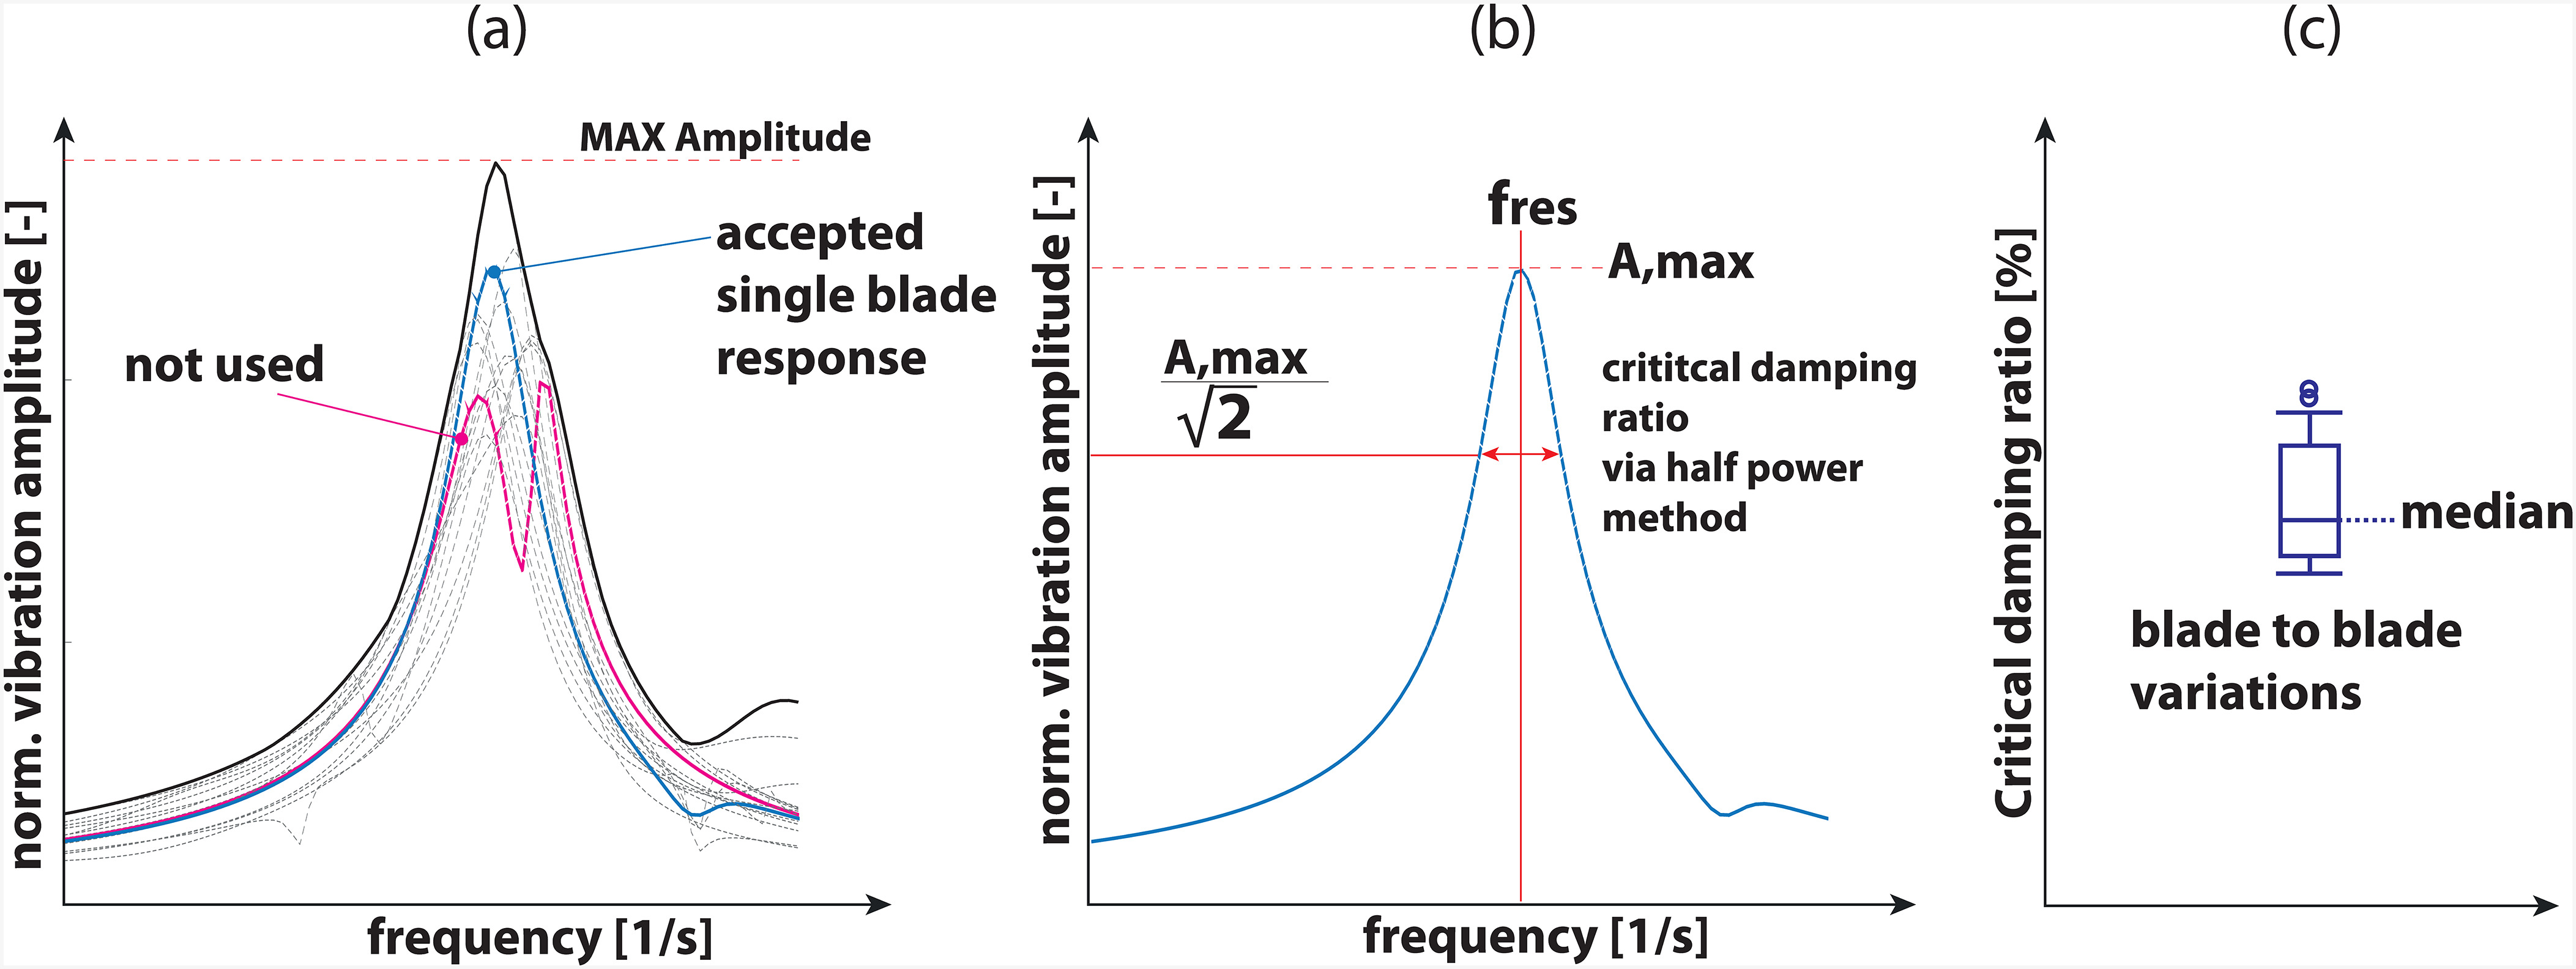
The previous description and comparison of aerodynamics highlights the induced variations in the stationary flow field. The following chapter concludes the findings towards measured system damping for the introduced resonance crossings. For the blade tip timing evaluation a data post processing sofware from MTU Aero Engines is utilized following the data post processing schemes presented by Zielinski and Ziller (2000, 2005). Since the investigated BLISK is not perfectly tuned due to wear and tear and manufacturing variations of the single blades, the data fitting is influenced by the underlying unintended mistuning. Figure 9 illustrates the data post processing performed after the extraction of resonance curves for all blades, indicated in (a). It is a common challenge to obtain good fits for every single blade Besem et al. (2015). The fact that unintended mistunting is relatively low and fundamental modes are investigated leads to a majority of resonance curves with a similar characteristic to a single degree of freedom oscillator, even when using a multi degree of freedom fit. A corresponding curve is highlighted in blue. Resonance curves that show an interference are not used for further post processing. Curves that are qualitatively matching the SDOF response are further post processed by evaluating the damping via half power method, as indicated in (b). By this the critical damping ratio for the system can be determined. This data still underlies slight variations, thus for the global trends the median value is used [compare (c)].
The available data set consists of at least 80 resonance sweeps per configuration providing a stochastically reliable insight into corresponding trends.
Figure 10 comprises the results of the described data for Mode 1 Engine Order 3, Mode 2 Engine Order 8 and Mode 3 Engine Order 8. The corresponding mode shapes are illustrated in the upper right corner (compare Table 2). In every plot the median value for each single resonance sweep is indicated as blue dot. The black dashed line results from a least square fit using all available data. The red dotted lines indicate the 95% confidence intervals for this fit. Additionally the same fit is performed using only the data points of the corresponding configuration, e.g., for M1EO3 the unstaggered variant (E) with three equally spaced NACAs, the identical upstream excitation with large gap (ELG) and the configuration with increased pre swirl (EP15). As an open loop wind channel is utilized for the experimental analyses, the observed variations also comprise deviations in inlet total temperature and inlet total pressure, given that the measurements were conducted between the end of August and early April.
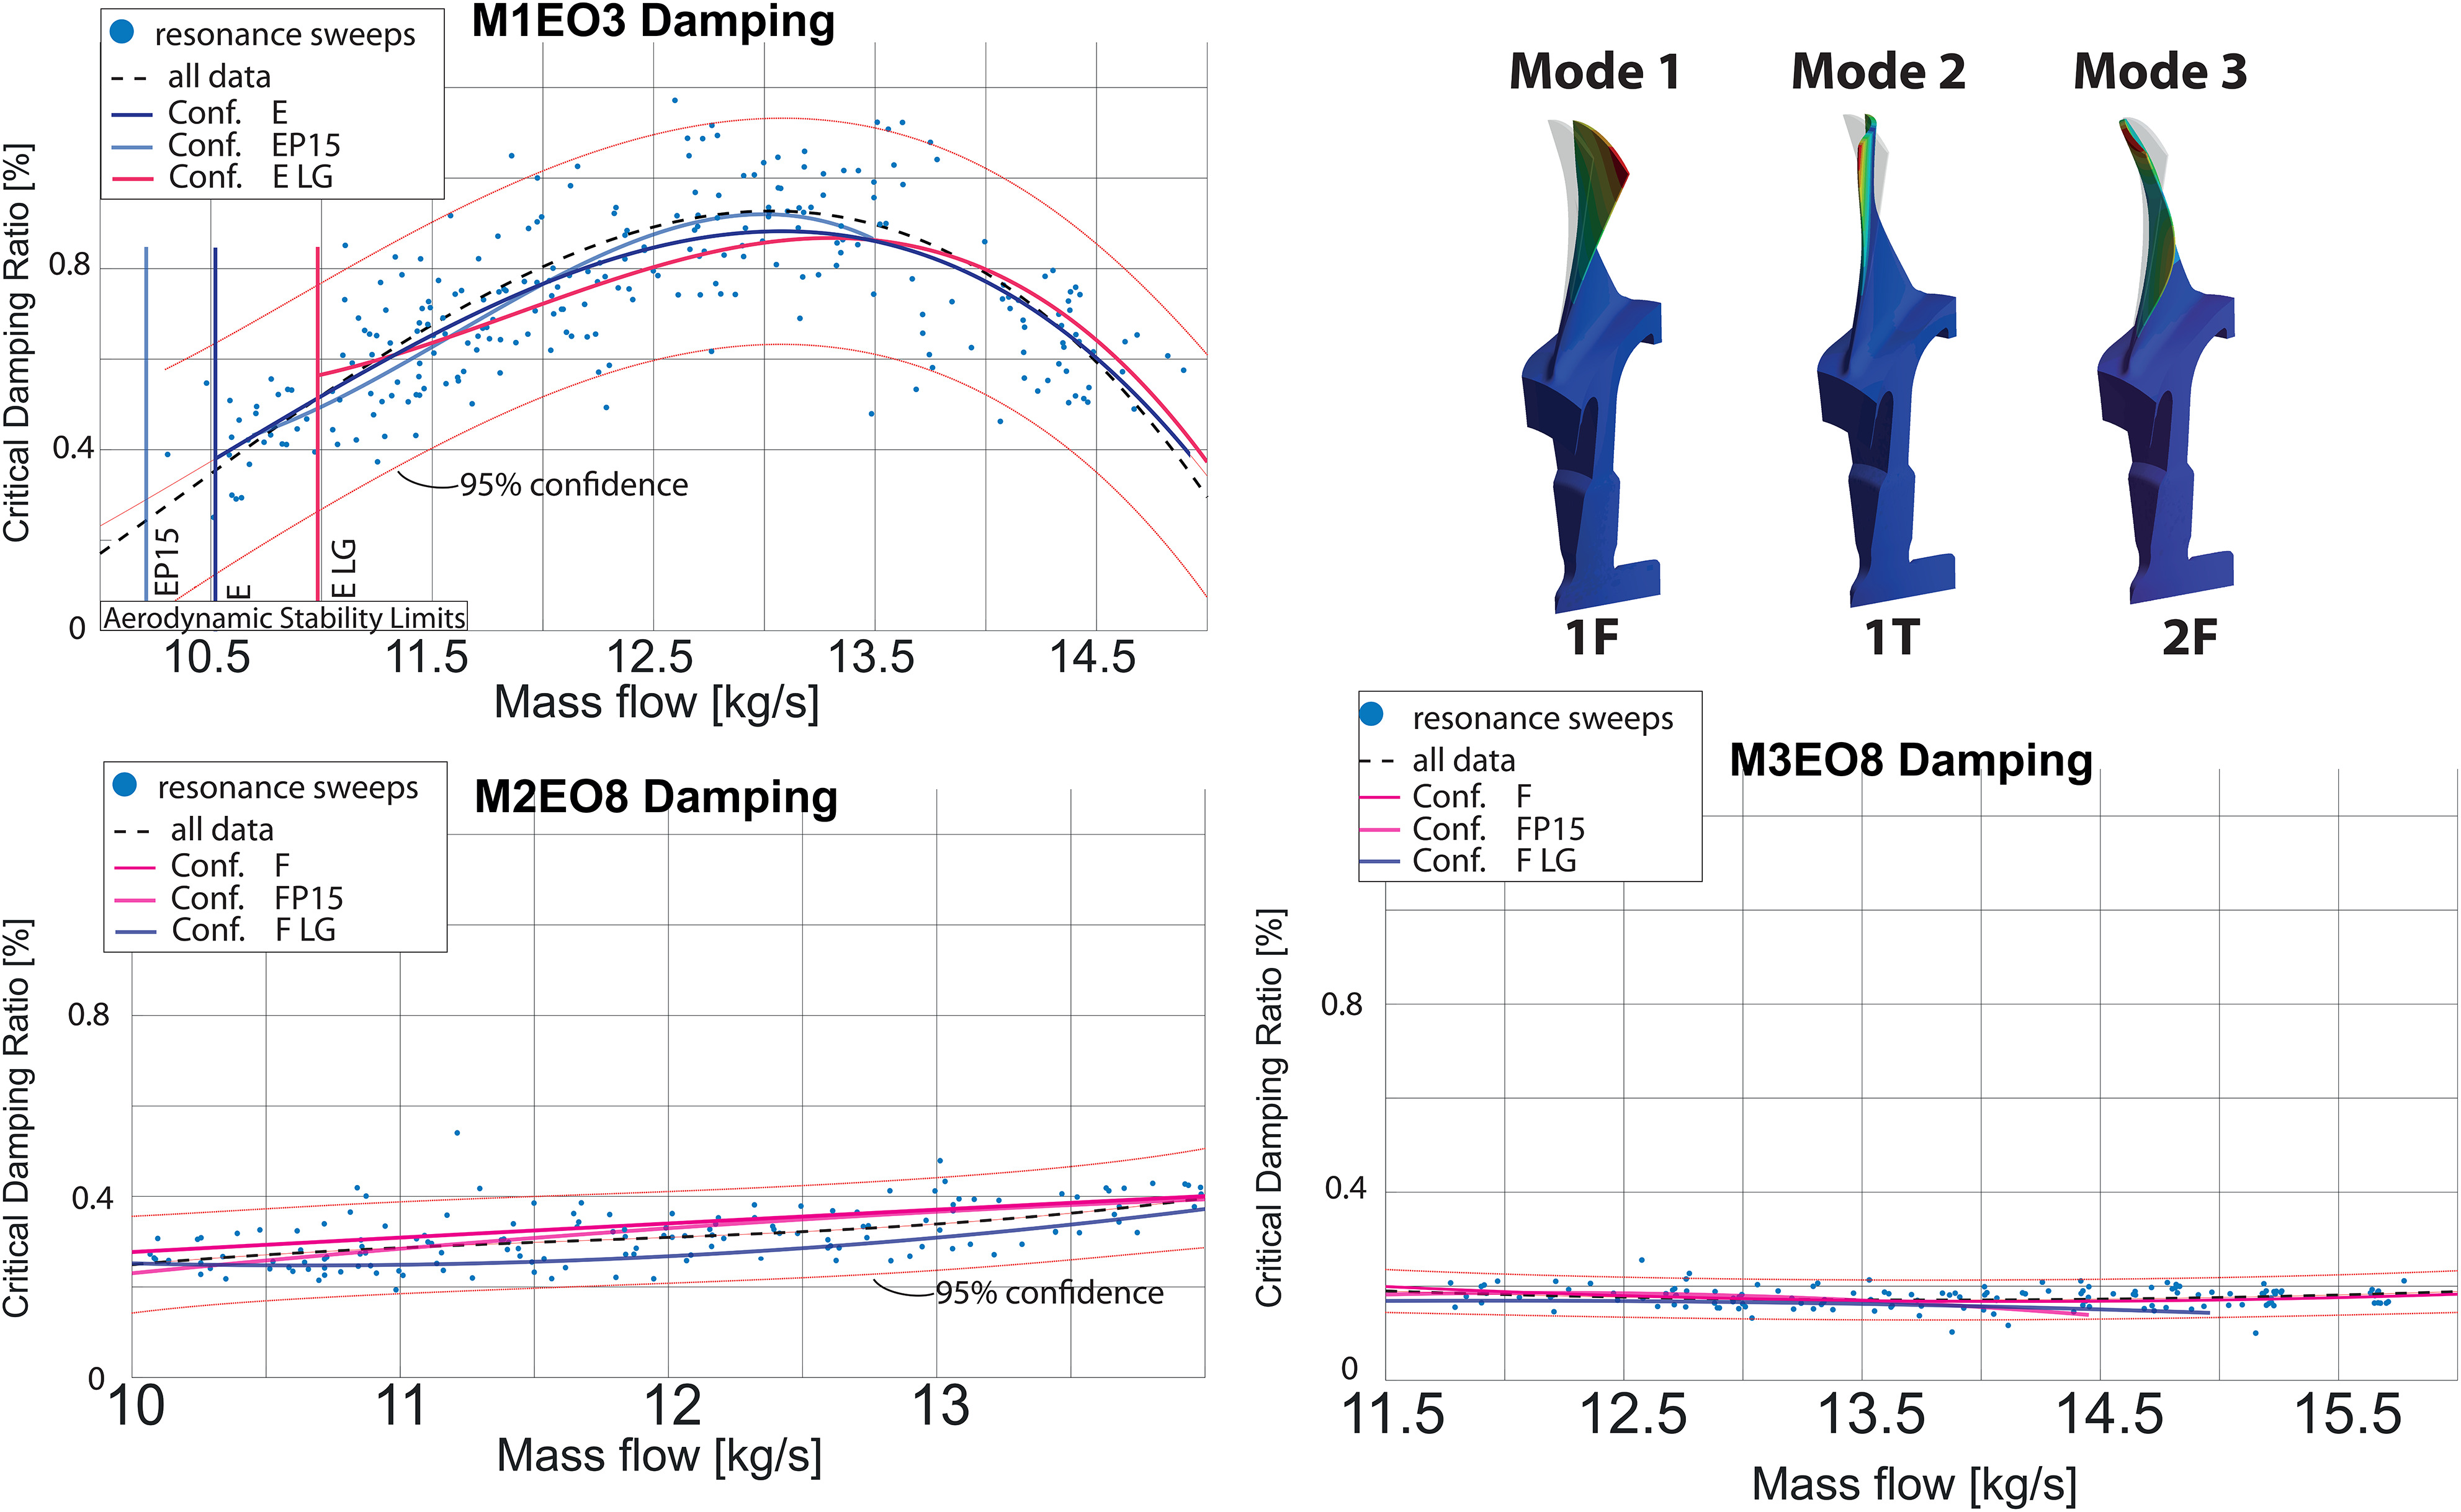
For all resonances it is obvious that almost identical damping values are present for a large variety of operating conditions. For Mode 1 EO 3 a clear dependency on the operating condition is evident, with higher damping values in the vicinity of peak efficiency. Towards choke and stall conditions the corresponding damping values drop significantly with the lowest damping measured at near stall conditions. This is evident for all configurations with similar magnitudes. In case of the large gap mass flows lower than 11 kg/s can not be reached due to the onset of rotating stall. A similar finding with respect to the independence of evaluated damping towards investigated configurations is evident for both M2EO8 and M3EO8. While a slight dependency on the mass flow remains for M2 EO8, the damping for M3 is constant for the whole investigated operating range. Only for M2 a noticeable lower damping can be found for the large gap, staying within the global confidence interval.
Conclusions
Within this work different investigated configurations are presented and the influence on stationary aerodynamics is highlighted by analyzing the flow field at the compressor design point. While stationary measurements imply a drastic variation of flow conditions in the rotor, evaluated system damping remains unchanged. The relatively simple excitation and 1.5 stage setup in conjunction with a stochastically reliable database make the presented data a valuable use case for numerical damping prediction, thus expanding the usability of the Darmstadt open test case to the field of aeroelasticity.
Nomenclature
Abbreviations
ARiAS
Advances research into aeromechanical solutions
BLISK
blade integrated disk
CTR
close to resonance
EO
engine order
HCF
high cylce fatigue
HPC
high pressure compressor
IGV
inlet guide vane
M
mode
NC
near choke
NS
near stall
OTC
(Darmstadt) open test case
PE
peak efficiency
RE
rotor exit
RI
rotor inlet
SDOF
single degree of freedom
SE
stator exit
SI
stage inlet
TCD
transonic compressor darmstadt
TRL
technology readiness level
WG
wake generator
5HP
five hole probe
1F
first flap
1T
first torsion
2F
second flap (bending)