
Introduction
The design of turbine components of modern gas turbines underlies different optimization goals in aerodynamics, heat transfer, structural mechanics as well as noise emissions. Depending on their application, each of these fields are differently weighted by importance. The continuous drive to reduce the total operational costs of the machines is a common design intention for both stationary gas turbines as well as aircraft engines. A reduction in blade count is a viable option in order to lower the production and maintenance costs of the turbine components as well as achieving a weight reduction of the engine. In addition, the required cooling mass flows for the blades might be lowered due to a reduction of wetted surface which would result in an overall higher engine efficiency.
On the aerodynamic side, a reduction in the number of blades increases the blade loading which promotes the loss generation due to secondary flow structures and therefore complicates the preservation of high aerodynamic efficiency. Some previous work can be found which investigates the reduction in blade count on the generated losses. Gier and Ardey, (2001) performed both experiments and numerical simulations of an aircraft engine representative low-pressure turbine configuration with respect to a variation in the number of guide vanes. They found that the profile losses of the second guide vane increase considerably faster with the reduced number of vanes in combination with lowering the Reynolds number. The loss mechanism was attributed to the shift of the shear layer away from the blade wall by the occurrence of the suction side separation bubble. Another implication is provided by (Saha et al., 2015), indicating that the reduction in vane count of the first stage of a transonic nozzle guide vane reduces the amount of needed cooling air. The authors stated that no significant penalty on the vane performance was detected when reducing the number of vanes.
The effect of blade loading on the secondary flow generation has been studied by (Perdichizzi, 1990) and (Dossena et al., 2004). They reported that by increasing the blade loading the profile and secondary flow strength increases and deteriorates the performance of the subsequent blade rows. The secondary flow generation and their interaction between rotating and stationary blade rows has been discussed in detail by (Chaluvadi et al., 2001) and (Schneider et al., 2013). The authors showed by experiments and numerical investigations the convection of the stator secondary flow structures through the downstream rotor and highlighted the unsteady nature of the vortex dynamics.
A different consideration needs to be made in terms of turbine noise. The recent technology achievements in the aero-engine sector lowers the jet noise by higher bypass ratios as well as the contribution of fan noise due to the advances in the geared turbofan concept. The importance of turbine noise therefore substantially increased. In the past years, interesting work has been published focusing on turbine noise. A fundamental work is provided by (Strahle et al., 1976). Rebholz et al. (2016b) performed a combined study of noise emissions and aerodynamic performance assessment in a 1.5-stage low-pressure turbine representative turbine configuration. The work provides information on the benefit of using a rotor shroud trailing-edge cutback geometry in order to suppress non-synchronous low frequency oscillation. Knobloch et al. (2017) focused their work on the propagation of direct and indirect combustion noise through a transonic high-pressure turbine stage. By a modal decomposition of the acoustic field they found other excitation modes than the anticipated rotor-stator interaction. Faustmann et al. (2015) performed a study on the impact of axial spacing and a novel embedded design (additional splitter blades integrated in the nozzle guide vane) in a transonic turbine facility. They reported a considerable reduction in turbine tonal noise due to the increase of axial distance and the embedded design concept. The fundamental work by (Tyler and Sofrin, 1962) describes the noise generating and propagating mechanisms by means of spinning modes and modal decomposition for the acoustic field of axial flow compressors which is also applicable to turbine acoustic fields.
To the authors' knowledge, there is limited work published which relate the impact of a significant reduction in number of rotor blades and its impact on the turbine tonal noise level while improving at the same time the aerodynamic performance. The presented work therefore strives to highlight the underlying effects which drive the performance improvements and the turbine noise characteristics.
Experimental method
The experimental data presented in this work are gained from measurements in the research axial turbine facility “LISA” at the Laboratory for Energy Conversion (LEC) at ETH Zurich. A detailed description is presented by (Behr et al., 2006). The test rig was assembled with two one-and-a-half stage, high-pressure turbine representative configurations, both including an unshrouded rotor and non-axisymmetric end wall contouring at the hub for all three blade rows. The first stator (S1) is additionally equipped with contoured end walls at the tip. For the same stators, two rotors are installed with different blade counts.
Research turbine facility
The test rig shown in Figure 1 is a quasi-closed-loop facility. The turbine inlet pressure is generated by a radial compressor. A two-stage water-to-air heat exchanger controls the inlet total temperature to ±0.3 K. The mass flow is measured with a calibrated venturi nozzle. A 3 m long flow conditioning stretch provides a homogeneous flow field before the flow enters the turbine test section. Additionally, a flow contraction section accelerates the flow in order to reduce flow non-uniformities at the inlet of the test section. Through the 1.5-stages, the flow undergoes a sub-atmospheric expansion.
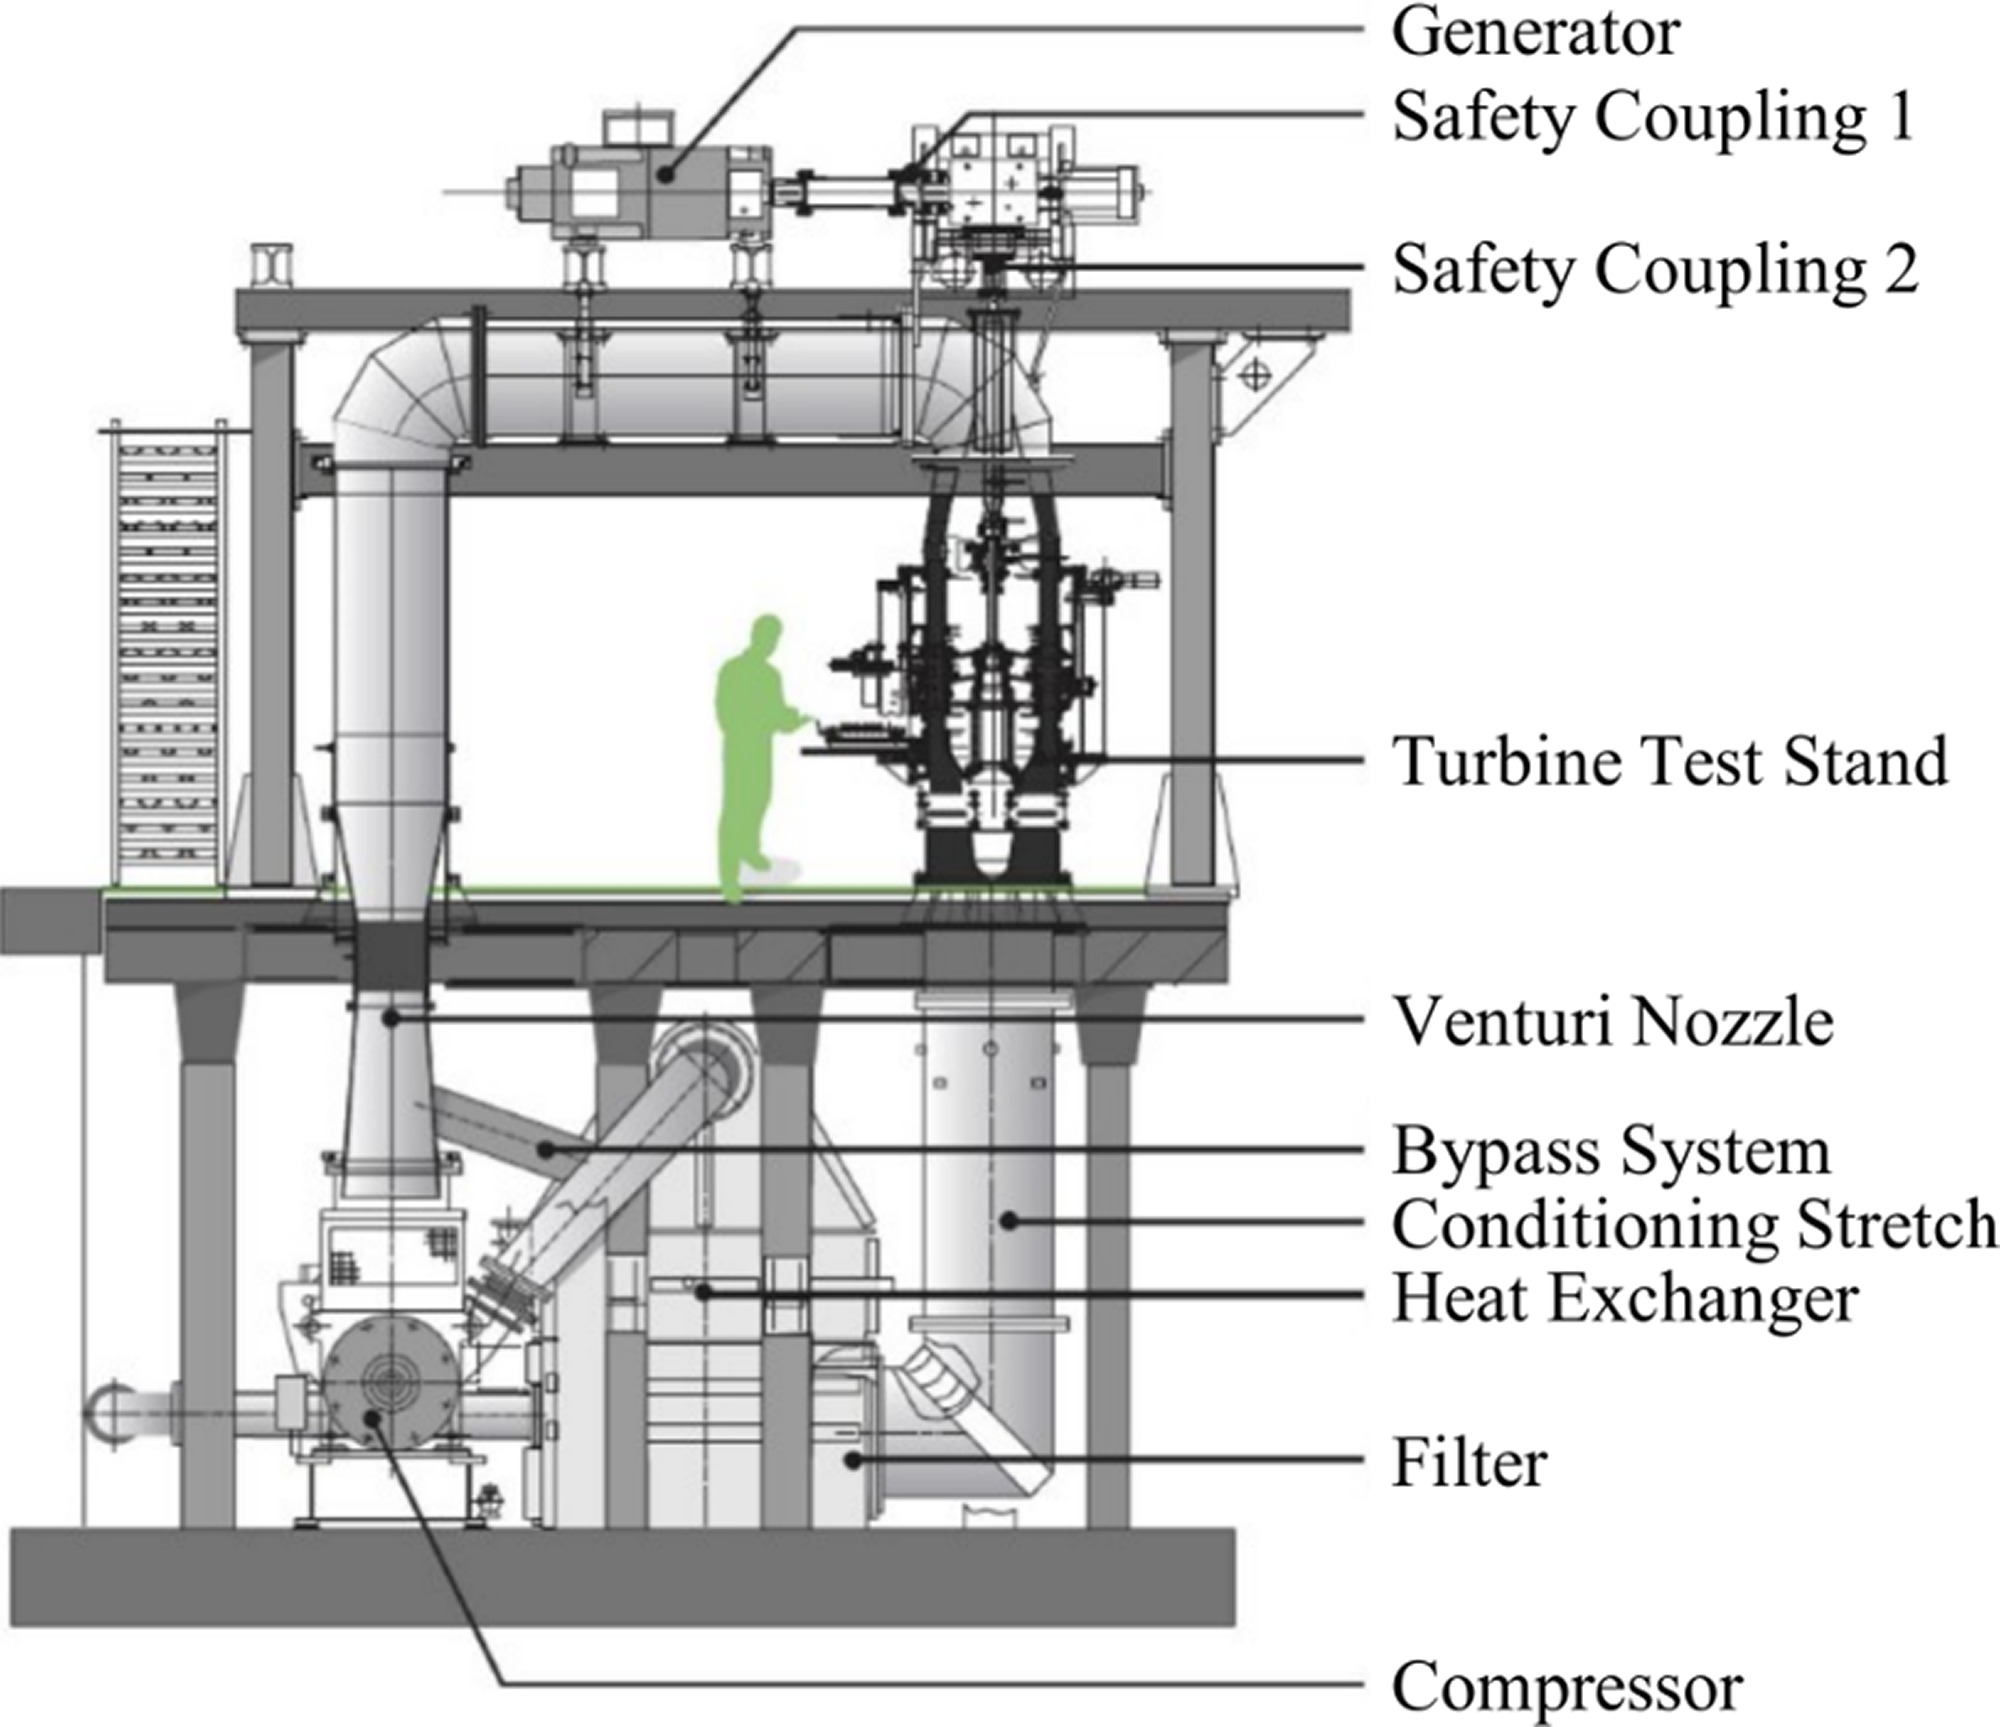
Due to the limited compressor pressure ratio of
Turbine operating conditions
The total-to-static pressure ratio across the 1.5-stage configuration is kept constant for all presented measurements at
Table 1.
Operating conditions and geometrical details.
Rotor designs: numerical optimization and geometrical details
In the current study two rotor blade geometries are compared. The two rotor airfoils are illustrated in Figure 2. The baseline rotor is equipped with 54 blades and end wall contouring (EWC) at the hub. This rotor has been optimized on five radial sections in terms of a profile optimization. The stacking axis remained unchanged. The new rotor with reduced blade count consists of 42 blades resulting in an increase of Zweifel coefficient from 1.0 to 1.3. A similar profile optimization on five radial sections has been conducted to generate this airfoil. In order to compensate for additional secondary flow losses, the airfoil has been equipped with a more advanced EWC as described in (Hänni et al., 2019). The optimization target was the 1.5-stage efficiency. At a constant capacity, the design with reduced blade count shows a drop in the 1.5-stage efficiency according to the predictions. Nevertheless, this penalty is assumed to be compensated by reduced cooling requirements in a real gas turbine. In contrast, the single stage efficiency could rather be increased by 0.15% based on the steady state CFD during optimization. The setup is based on a block-structured mesh generated with AutoGrid by Numeca. The domain includes the three blade rows as well as the rotor upstream cavity. The CFD simulations are conducted using TRACE, a code specifically developed for turbomachinery applications by the Institute of Propulsion Technology at DLR. Radial distributions of total quantities and static pressure from previous measurements serve as inlet and outlet boundary conditions. The purge air is specified by a mass flow boundary condition and turbulence is modelled with the shear stress transport model SST. The toolchain is run with AutoOpti by DLR, using a generic algorithm for the generation of designs and a surrogate model based on kriging. In total 89 design parameters were used for airfoil and end wall. The optimization required approximately 1500 members to converge. A transient simulation with a sector model for final validation purposes showed an improvement of 0.3% which is in agreement to the performed measurements.
Figure 2.
Tested rotor geometries (not to scale): baseline (left) and reduced blade count rotor (right).
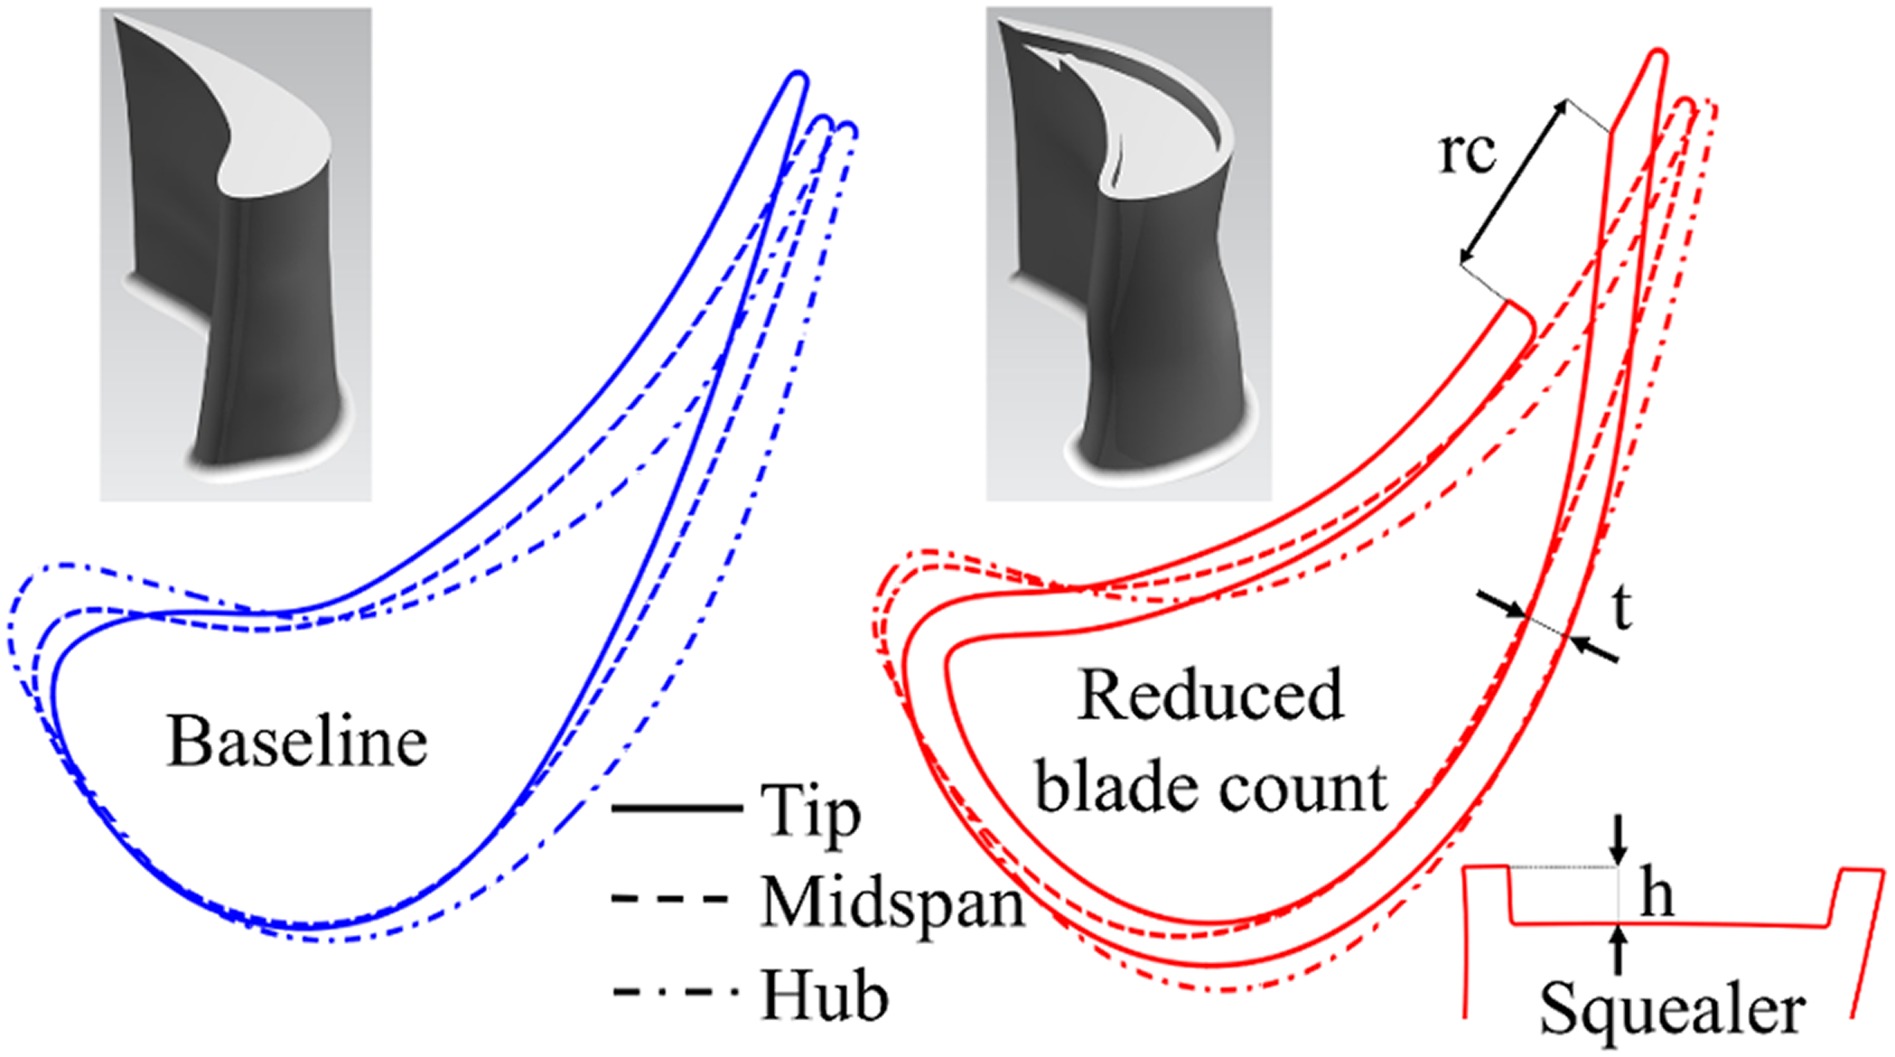
The baseline rotor features a flat tip geometry with a nominal tip gap of 1% of the blade span. The reduced blade count geometry includes a squealer tip geometry with the same nominal tip gap as the baseline. The squealer cavity depth h is 5% of the blade span. The squealer rim has a uniform thickness t which is 3.5% of the blade span. Furthermore, the squealer rim cut back
Measurement technology and measurement uncertainty
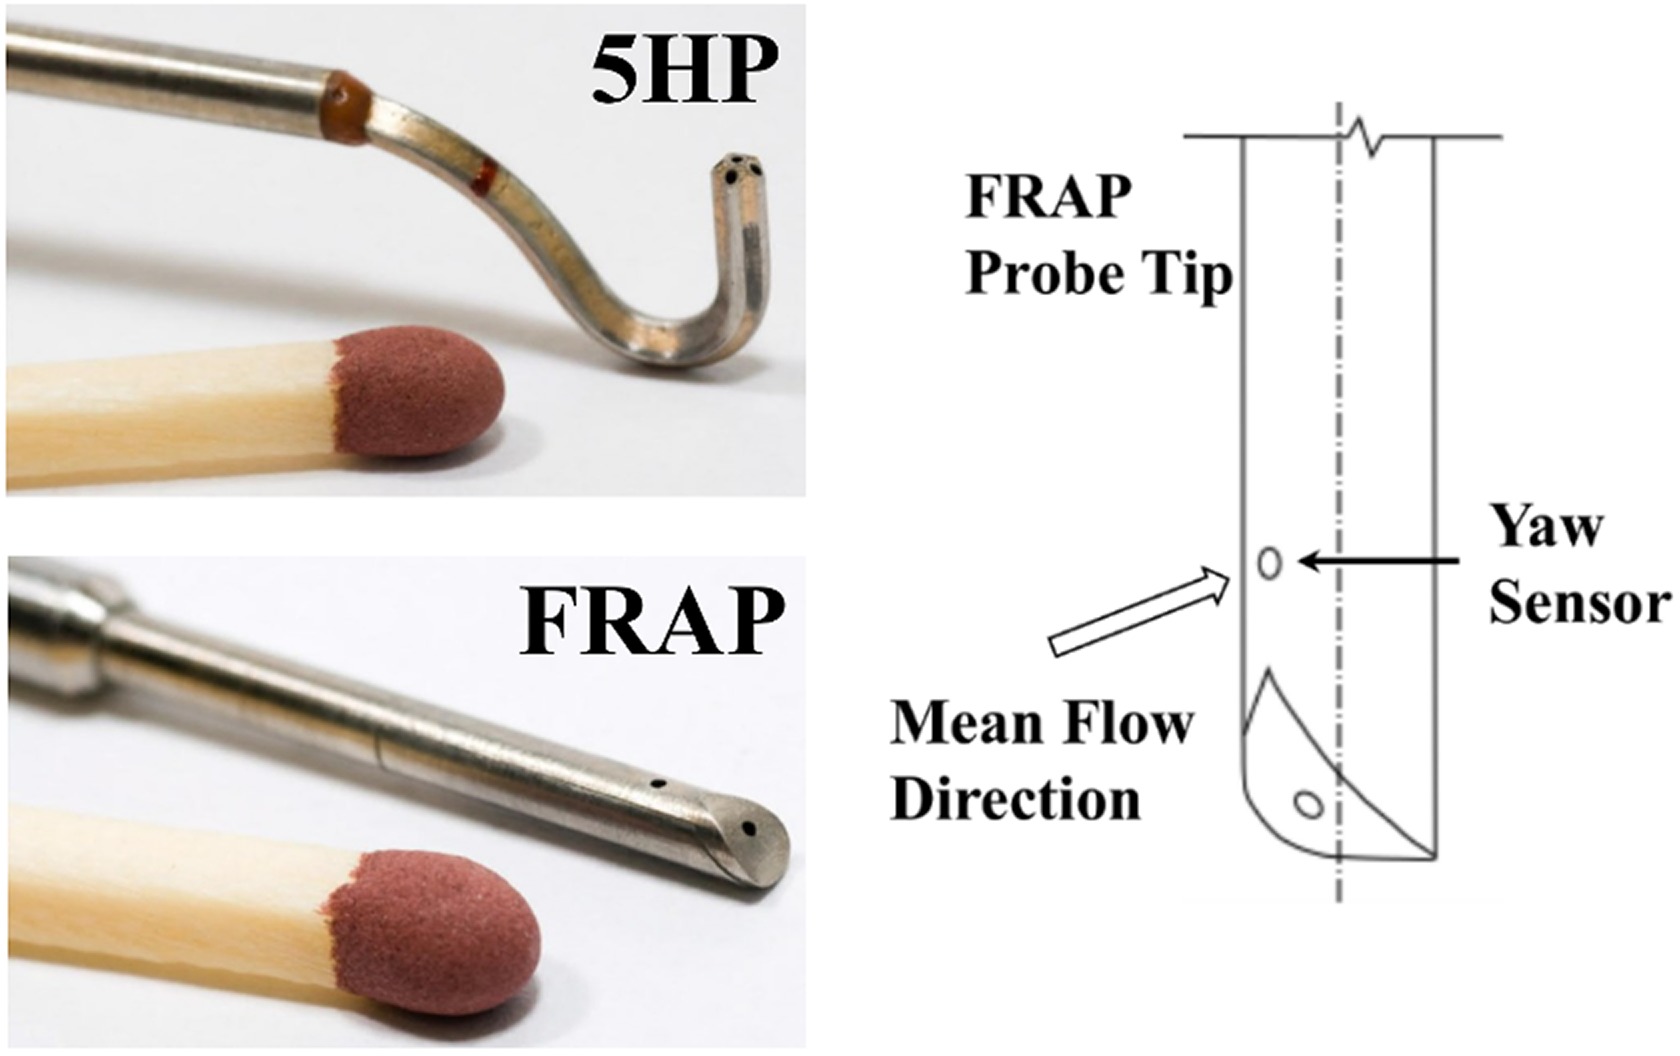
The time-averaged flow field has been measured with a miniature cobra-head pneumatic five-hole probe (5HP, Figure 3 top) with a probe tip diameter as small as 0.9 mm. In order to measure the unsteady flow field at rotor exit and stator 2 exit, the Fast Response Aerodynamic Probe (FRAP, Figure 3 bottom) is used. The probe technology has been developed in-house at LEC at ETH Zurich. Detailed information concerning the measurement technology are presented by (Kupferschmied et al., 2000) and (Pfau et al., 2003). The FRAP allows to measure total and static pressure as well as flow yaw and pitch angle in a frequency bandwidth up to 48 kHz. Based on pressure and flow angle information, the flow velocity components and further flow quantities are derived. In order to reduce the probe blockage effect, the FRAP has a 1.8 mm tip diameter and encapsulates two miniature silicon piezo-resistive pressure transducers. The 2-sensor FRAP is operated in a virtual 4-sensor mode in order to measure the 3-dimensional, time-resolved flow properties. The standard post-processing of the data is performed for three consecutive rotor pitches and phase-locked averaged 85 times. The data is acquired at a sampling rate of 200 kHz over a measurement time of 2 s which results in a frequency resolution of 0.5 Hz in the frequency domain. For the analysis in the frequency domain and the noise investigation, only the pressure signal from the yaw sensor in the probe position which is aligned to the mean flow direction is considered (represented in Figure 3, right). The acquired data therefore resembles the total pressure and contains the full frequency spectrum rather than the multiples of the engine order only, as in the phase-locked-averaged data.
Figure 3.
Aerodynamic probes: pneumatic 5-hole probe (top) and FRAP (bottom). Alignment of yaw sensor with mean flow direction for noise investigation (right).
The pressure fluctuation information have been calculated at each point of the measurement grid by subtracting the time-averaged value from the pressure signal. Subsequently, the signal is transformed into the frequency domain by applying the Fast Fourier Transformation (FFT) with the Hanning window as a windowing function. For the turbine tonal noise assessment, the amplitude of the dominant frequency content (rotor blade passing frequency BPF) is extracted by searching for the maximum pressure amplitude in the frequency range of ±1 Hz around the nominal, expected blade passing frequency.
The uncertainty calculation for the two probes is performed using the “Guide to the Expression of Uncertainty in Measurement (GUM)” (ISO, 1993). This is a commercially available software where the entire chain of uncertainty sources is included and calculated accordingly. Table 2 presents the expanded uncertainty of the 5HP and FRAP in absolute values for the flow angles and as percentage of the dynamic head for the total
Table 2.
Uncertainty bandwidth FRAP and 5HP.
| Yaw angle | Pitch angle | pt | ps | |
|---|---|---|---|---|
| FRAP | 0.62° | 0.64° | 2.8% | 3.7% |
| 5HP | 0.34° | 0.40° | 1.9% | 2.2% |
The aerodynamic performance is quantified by using a torque based total-to-total stage efficiency
The measurement uncertainty of the total-to-total stage efficiency is calculated using the “GUM,” including all the uncertainty sources. In Table 3, the standard uncertainties of each input quantity is presented with the corresponding uncertainty contribution. The rotor exit total pressure contributes 46% to the overall uncertainty, the main turbine mass flow measurement contributes to 30%, and the torque measurement contributes to 17%. The remaining input quantities only have a minor contribution of 7% to the overall efficiency. More details are provided by (Schuepbach, 2009).
Table 3.
Stage efficiency related uncertainties.
Based on that, the absolute standard measurement uncertainty of the total-to-total stage efficiency is calculated to be ±0.18%. The calculated relative standard uncertainty (for efficiency difference
Measurement planes
The probe traverse data were acquired downstream of the rotor “R” and downstream of the second stator “S2” (Figure 4). The spatial resolution of the measurement grid for both planes consist of 38 radial points and 41 equally distributed circumferential grid points. The measurement grid is refined in radial direction towards the end walls. The rotor exit plane “Rex” is located 13% of the baseline rotor axial chord

Results and discussion
This section presents the experimental results for the two turbine configurations. The basis of the analysis lies within the aerodynamic investigation which is linked in a second section to the noise characteristics. One aspect of combining the aerodynamic performance with the noise production is that in the presence of increased tonal noise the flow unsteadiness, e.g. induced by the blade passing, is enhanced. However, increased flow unsteadiness does not necessarily have to coincide with an efficiency drop, but points towards increased losses.
Aerodynamic performance and flow field analysis
The section first provides the aerodynamic performance of the two rotors by means of the measured total-to-total stage efficiency
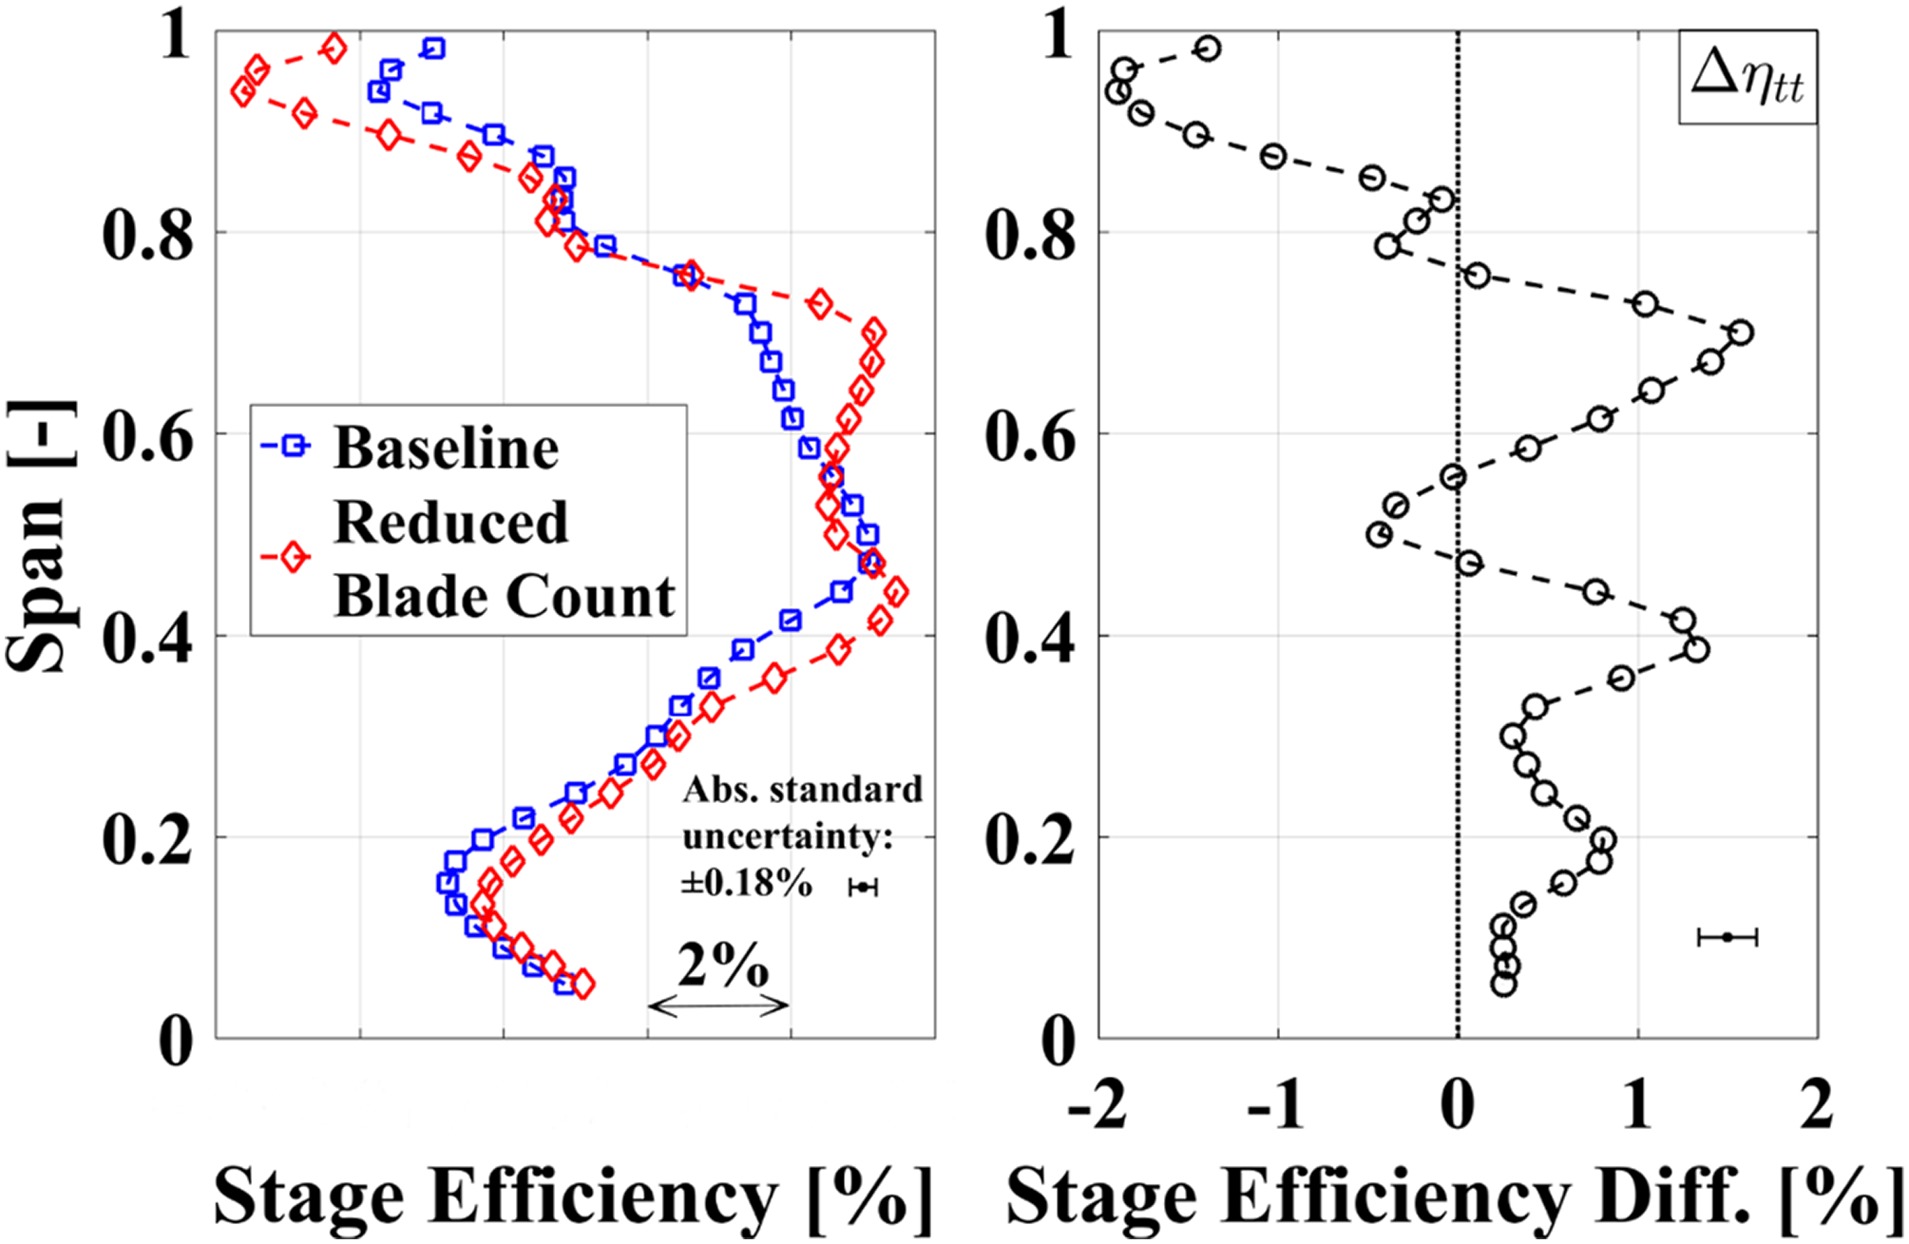
In Figure 5, the circumferentially and mass-averaged total-to-total stage efficiency profiles (absolute and differential) for both rotor geometries are depicted. The profiles provide a first indication on the main regions of improvement and penalties. Nevertheless, the analysis is further on supported with contour levels of other flow quantities that reveal the three dimensional character of the flow. Overall, the reduced blade count rotor presents an aerodynamic performance improvement on a large fraction of the span (hub to about 80% span). Specifically, at around 40% and 70% span, an increase in stage efficiency of up to 1.3% and 1.5% is measured. A pronounced performance reduction of up to 1.9% for the reduced blade count rotor is registered above 80% span. The overall integral total-to-total stage efficiency increase for the reduced blade count configuration compared to the baseline is determined to be
Figure 5.
Circumferentially mass-averaged total-to-total stage efficiency (5HP). Radial distribution (left) and difference (right).
The source of the performance increase of the reduced blade count rotor needs to be linked to the flow physics of the stage. Turbine efficiencies are typically linked to stage loading and flow coefficient. In Figure 6, the circumferentially and mass-averaged profiles of the stage loading and flow coefficient are illustrated. In order to explain the stage efficiency increase around 70% span, the stage loading and flow coefficient profiles reveal some evidence. At 60–80% span, the flow turning is moderately reduced by 3% for the reduced blade count rotor. The reduction in stage loading in this range of the span is induced by the reduction of the absolute flow yaw angle by up to 5°. This under-turning effect of the flow is typically provoked by the rotor tip passage vortex. The characteristics of the secondary flow structures at rotor exit are further detailed in the subsequent flow analysis. The flow coefficient, on the other hand, is locally enhanced by up to 10%.
Figure 6.
Circumferentially and mass-averaged stage loading (left) and flow coefficient (right) profiles measured with 5HP.
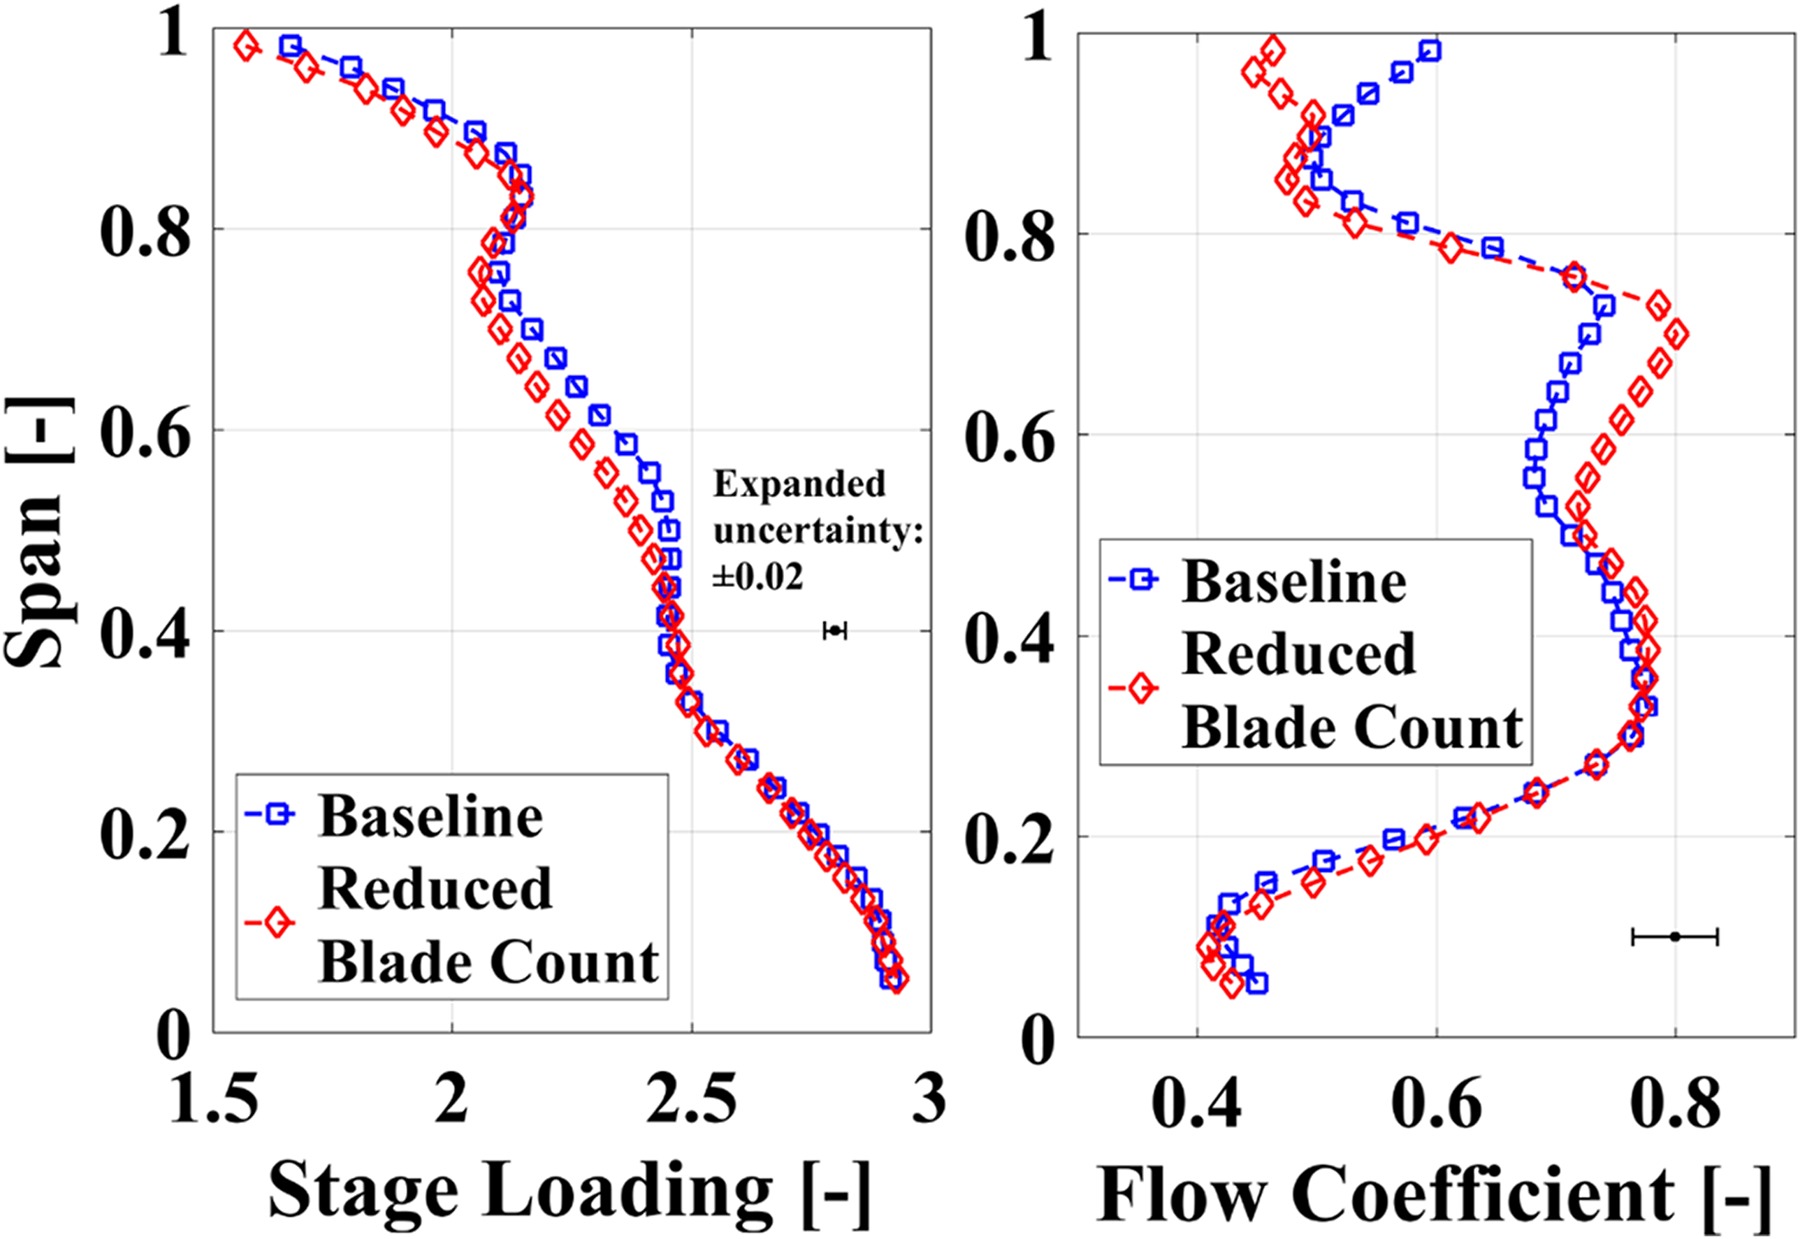
The predominance of the local flow coefficient increase (with a moderate reduction in stage loading) indicates that a larger amount of mass flow is turned at that specific span-wise position. Since the turbine capacity for both configurations is not significantly changed (changes are well within the measurement uncertainty), the increase in mass flow at 60–80% span is partly explained by a span-wise redistribution of mass flow. Figure 6 shows a local flow coefficient reduction of up to 22% in the near blade tip region (96% span) which suggests that part of the mass flow is redistributed from the tip towards 60–80% blade span. In conclusion, due to the redistribution of mass flow from the tip, a larger amount of flow can be turned more than in close vicinity to blade tip. This helps to sustain the rotor torque for the reduced blade count rotor. Considering the stage efficiency distribution in close vicinity to the tip, a reduction in performance for the reduced blade count rotor is measured. The lower mass flow at the tip in combination with lower turning reduces the work extraction in this region.
To complement the analysis, the impact of secondary flow structures on the rotor exit flow field is studied. Specifically, at around 40% span where the stage loading and flow coefficient is moderately changed for the two configurations, an aerodynamic loss quantification is required. In Figure 7 (left), the circumferentially and mass-averaged normalized relative total pressure is presented for both turbine configurations. The pressure information is normalized by the total inlet pressure of the turbine. The profiles indicate that the relative total pressure is increased by 1% around 40% span for the reduced blade count rotor. The flow field in this region is characterized by the presence of the hub secondary flow structures which is demonstrated in Figure 7 (middle and right). The figures illustrate the presence of low relative total pressure regions in the rotor relative frame of reference around 40% span and 25% rotor pitch (zone 1). In detail, the minimum relative total pressure in the loss core is marginally altered for the reduced blade count rotor (0.2% reduction). However, the pitch-wise fraction of low loss fluid (60–100% rotor pitch and 40% span) is increased by about 17%. The pitch-wise fraction of the hub secondary flow structure loss core is accordingly reduced at this span position.
Figure 7.
Normalized relative total pressure at rotor exit. Circumferentially and mass-averaged profiles in stator 2 frame of reference (left, 5HP), time-averaged contours in the rotor relative frame of reference for baseline (middle) and reduced blade count rotor (right) measured with FRAP.
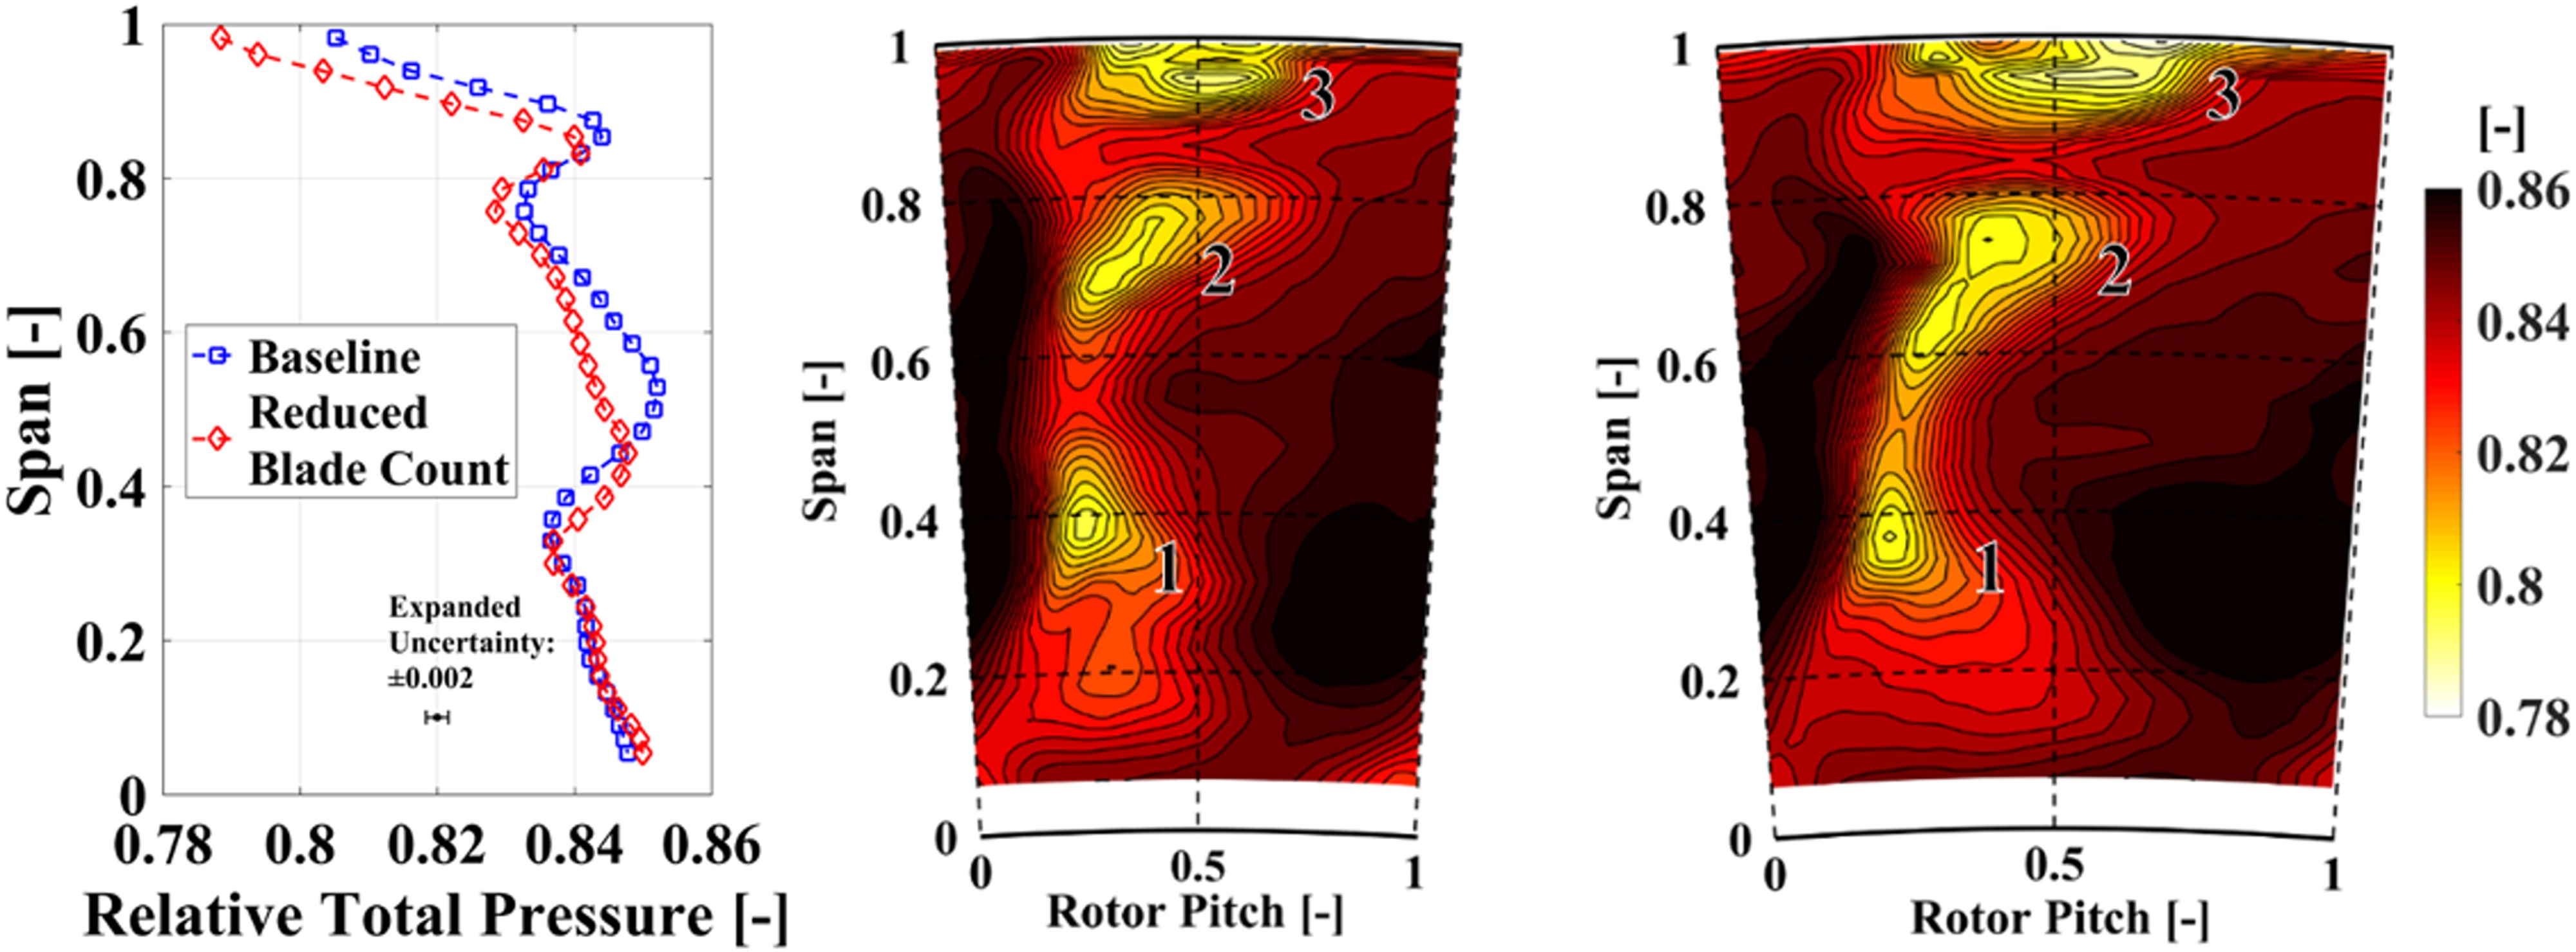
The lower relative total pressure at mid-span for the reduced blade count rotor is associated to the enhanced loss generation in the blade boundary layer. At 50% span diffusion occurs which provokes an adverse pressure gradient on the blade suction side. The blade count reduction leads to an increased blade loading (similar stage loading for less blades) with more mass flow per rotor passage which benefits the loss generation in the boundary layer and results in larger wake losses. This is demonstrated in the time-averaged contours in Figure 7, where at 25% rotor pitch and 50% blade span lower relative total pressure is found for the reduced blade count rotor. The zone 2 in Figure 7 is attributed to the tip passage vortex and tip trailing edge shed vortices which form at around 40% rotor pitch and 70% blade span a low relative total pressure region.
The clear distinction between the flow structures at this span-wise position is enabled by considering the stream-wise vorticity in the relative frame of reference which is provided in Figure 8. The positive stream-wise feature indicated with I is the signature of the rotor hub passage vortex. For the reduced blade count rotor the area of the vortex seems to be augmented in the passage. The combination of comparable vorticity levels with larger covered area suggests an increase in circulation and therefore strength of the vortex.
Figure 8.
Time-averaged stream-wise vorticity in rotor relative frame of reference for baseline (left) and reduced blade count rotor (right).
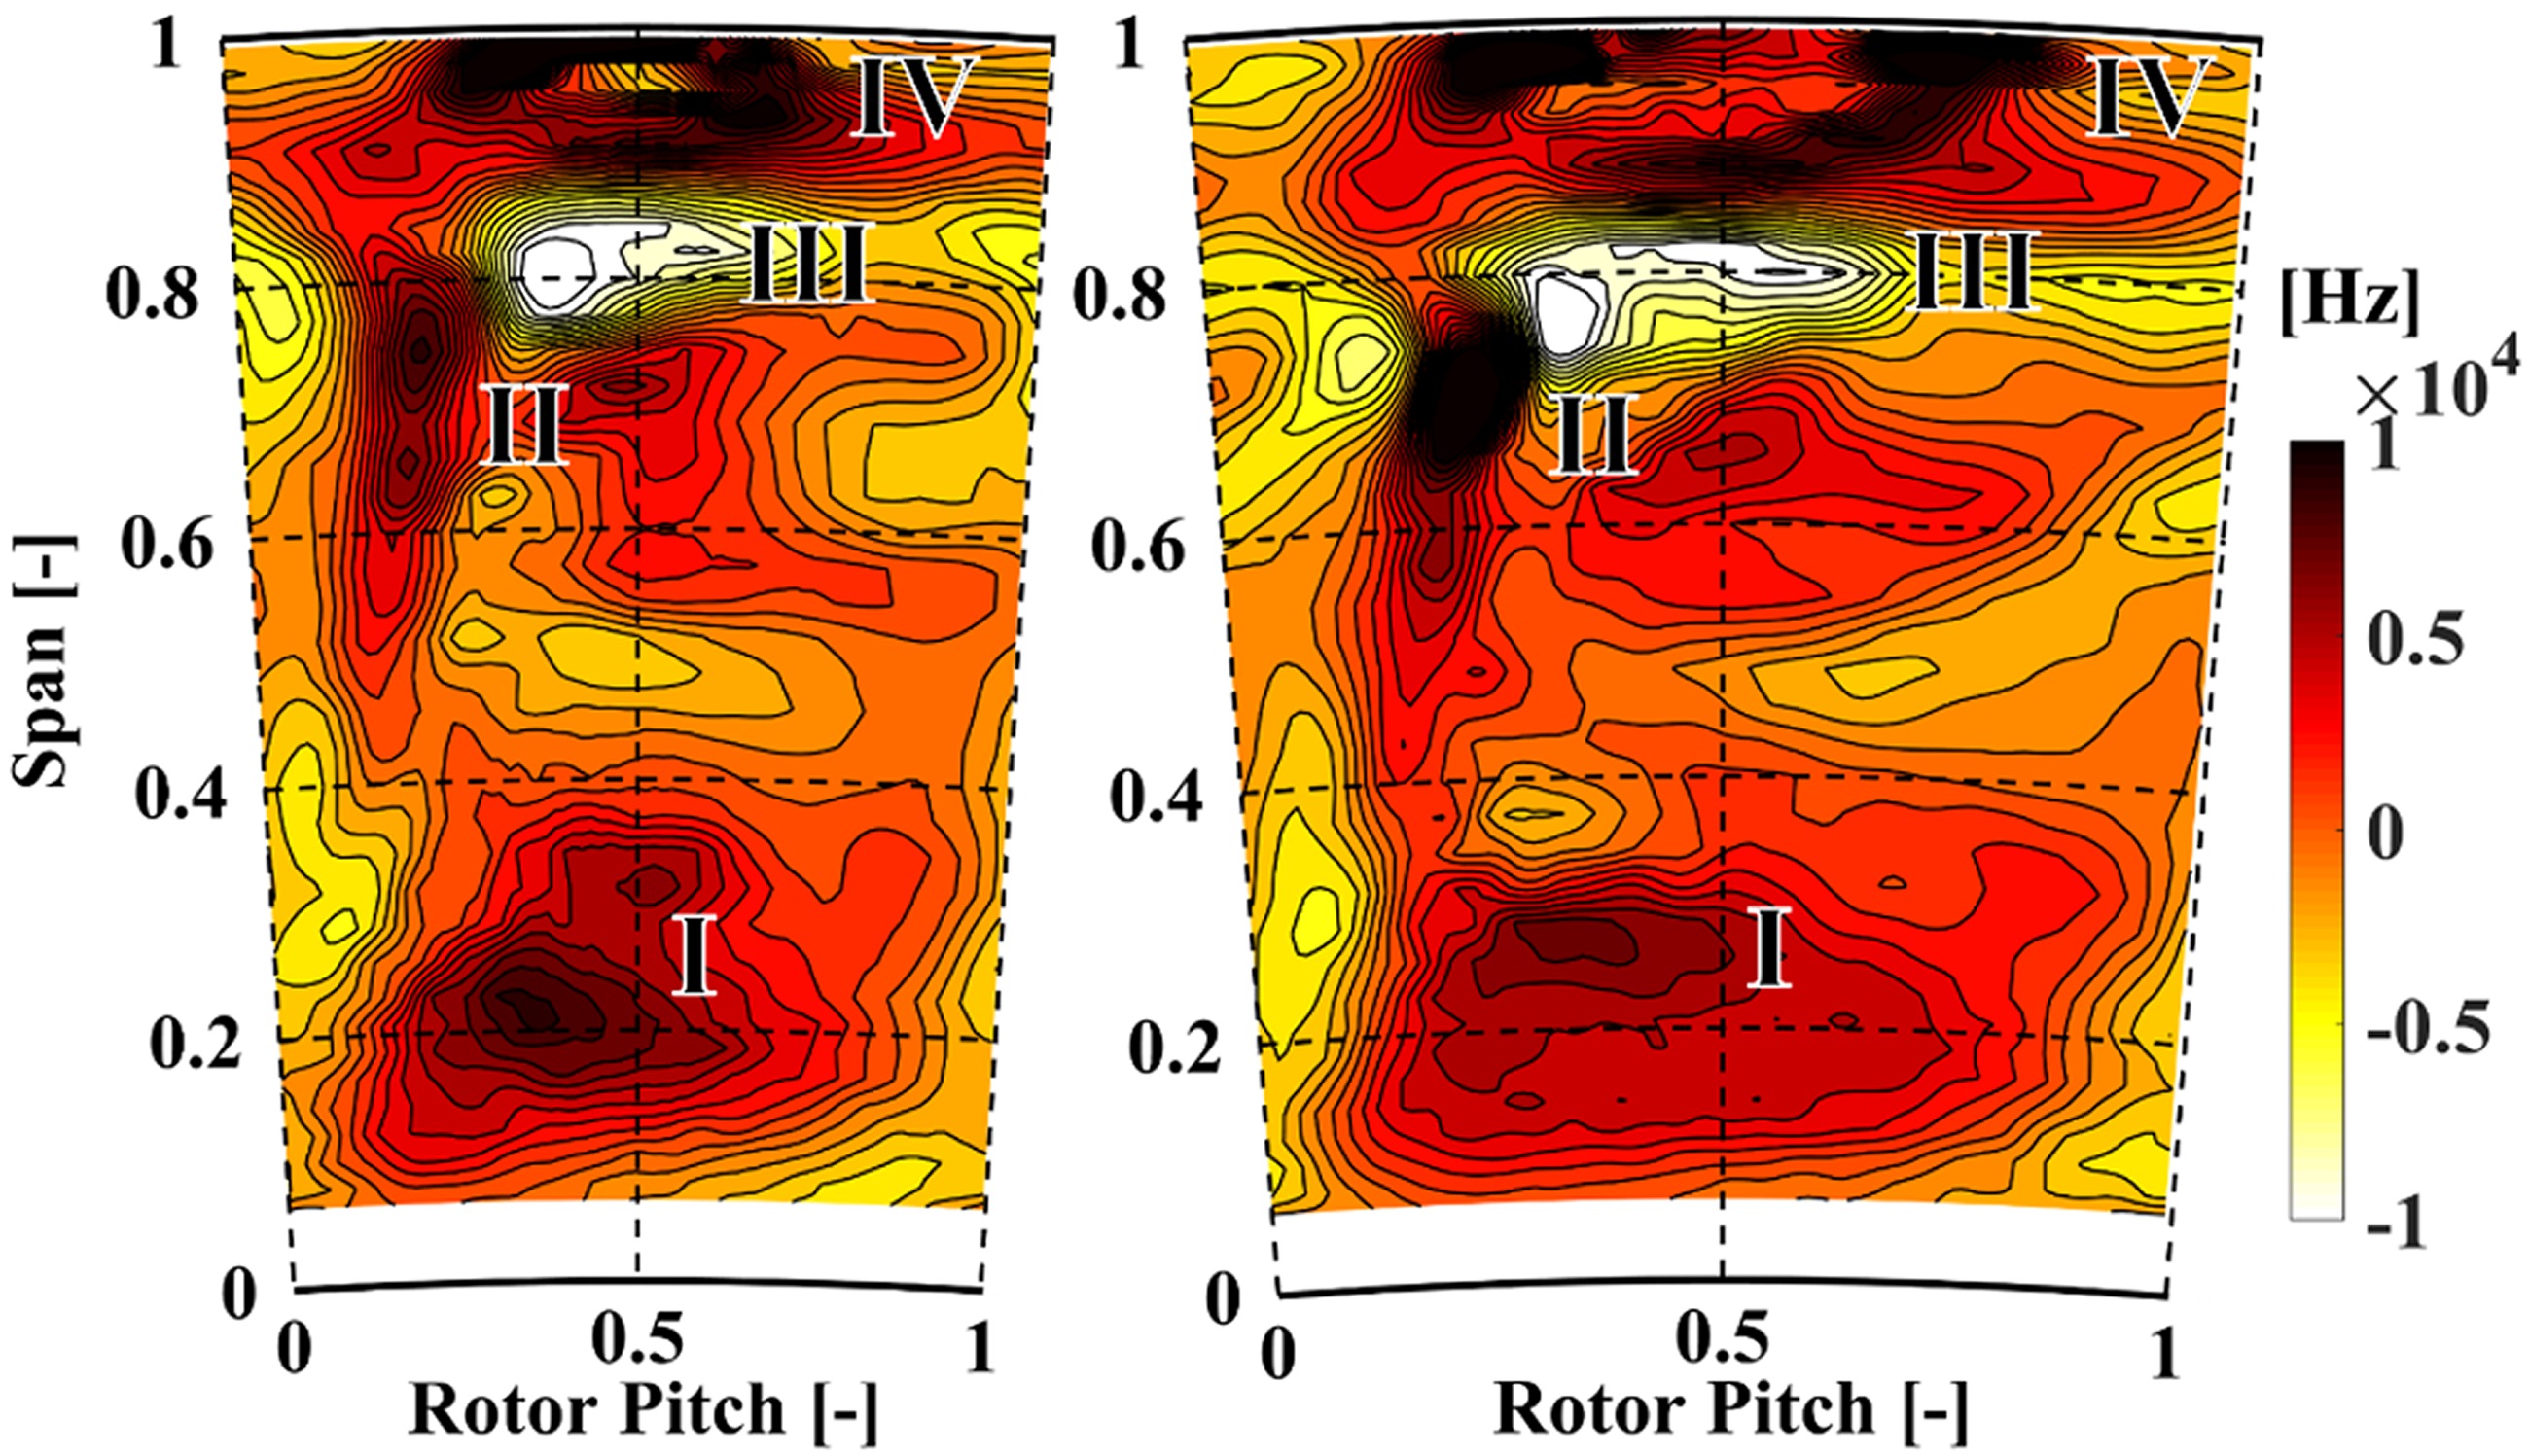
The positive stream-wise vorticity feature labelled with zone II is the signature of the tip trailing edge shed vortex whereas the tip passage vortex is characterized by pronounced negative stream-wise vorticity in zone III. Comparing the baseline and the reduced blade count rotor, the latter presents an enhanced positive stream-wise vorticity for the tip trailing edge shed vortex by up to 88%. The tip trailing edge shed vortex is associated to the radial outward migration of the rotor suction side boundary layer and is therefore driven by the blade loading which explains the higher levels for the reduced blade count rotor. The negative stream-wise vorticity levels for the tip passage vortex are comparable for both rotors, however the reduced blade count rotor tends to have a more stretched vortex in circumferential direction.
The stage efficiency penalty at the blade tip for the reduced blade count rotor is the result of the strong presence of the tip leakage vortices which are indicated by the high positive stream-wise vorticity in zone IV and is translated into the low relative total pressure region in zone 3 of Figure 7. Specifically, for the reduced blade count rotor, the signature of the tip leakage vortices seem to migrate radially downwards to about 80% span. In addition, two distinct high positive stream-wise vorticity zones are present (97% span) for the reduced blade count rotor. These zones have an up to 50% higher positive stream-wise vorticity than the ones of the baseline configuration. Since both rotor designs are unshrouded (with the same nominal tip gap), the tip leakage losses are mainly driven by the tip leakage flow over the blade tip which is unturned and tends to roll up stream-wise vortices, and secondly by the re-injection of the leakage flow into the main flow which provokes intensive mixing. The tip leakage flow is driven by the pressure difference between the blade pressure and suction side. Due to the significant reduction in blade count, the blade loading close to the tip increases accordingly which benefits the tip leakage mass flow and therefore the formation of the tip leakage vortices. The presence of a squealer tip geometry for the reduced blade count rotor is not able to compensate the consequences out of the blade loading increase at the tip.
In summary, the section shows the performance improvement of a reduced blade count rotor which is mainly attributed to a radial mass flow redistribution (and only moderate reduction in stage loading) in specific span-wise positions without provoking an overweight of secondary flow losses that outweighs the gained benefit. The presented aerodynamic results build a basis for the turbine noise investigation of both configurations.
Turbine noise investigation at rotor exit
The investigation of noise generating mechanisms in rotating machinery is typically linked to flow unsteadiness. Specifically, for relatively low speed and sub-sonic turbomachines, the unsteadiness induced by the interaction of rotors and stators (blade passing) are typically the predominant source. Therefore, the assessment of noise for the current turbine configurations is focused on the blade passing induced noise. Since, one of the drivers for pronounced blade passing induced noise is the axial distance between rotors and stators (Lowson, 1967), the investigation is performed first at rotor exit “Rex” where the axial distance between rotor and stator 2 is about half of the one between stator 1 and rotor (Figure 4).
Fast-response probe measurements using FRAP have been employed at the exit of the rotor. For each measurement point, a Fast Fourier Transformation has been calculated when the probe yaw sensor is aligned to the mean flow direction (Figure 3). Subsequently, the pressure amplitude of the rotor blade passing frequency (BPF) has been extracted and converted into a normalized pressure amplitude induced by the blade passing. The pressure amplitude is normalized by the respective turbine inlet total pressure. In Figure 9 (left), the pitch-wise mean of the normalized blade passing amplitude change of the reduced blade count rotor with respect to the baseline is presented. The results imply that the reduced blade count rotor configuration tends to have an increase in the pressure oscillations induced by the blade passing at specific span positions. Especially in the near hub region at around 10% blade span as well as at 58% span and 90% span an increase is detected.
Figure 9.
Change in blade passing pressure amplitude with respect to baseline at rotor exit (FRAP). Span-wise distribution (left), contour diagram in stator 2 frame of reference (right).
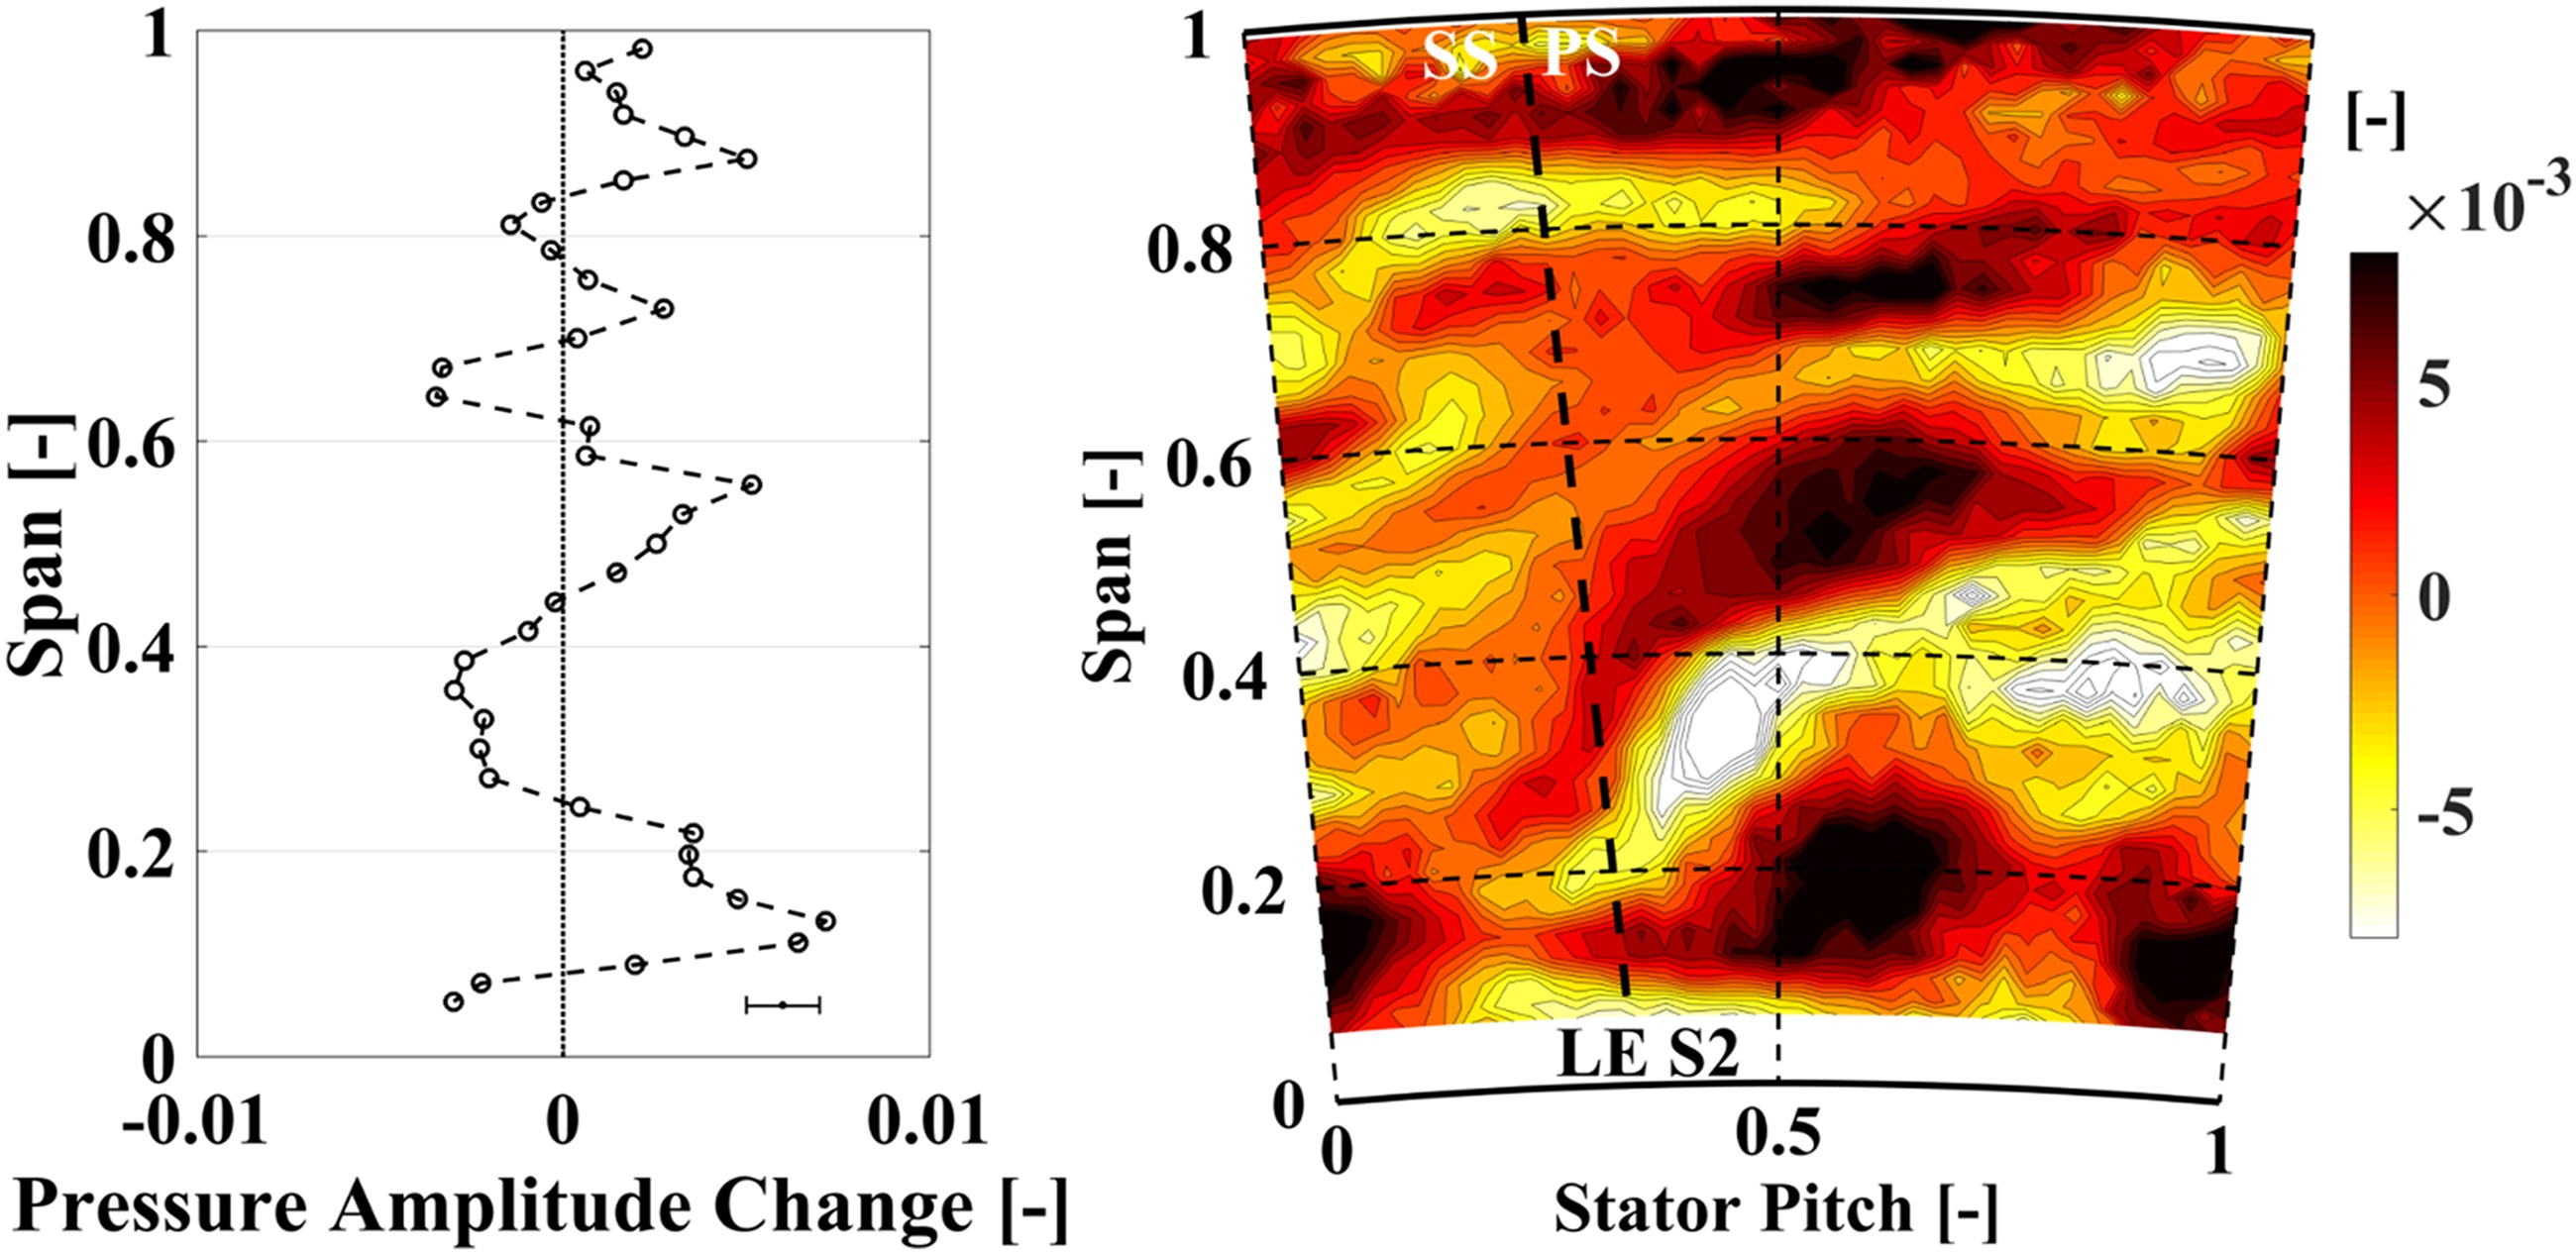
In order to correlate the blade passing pressure amplitude changes to the flow physics, Figure 9 (right) shows the contour diagram of the absolute differential normalized pressure amplitude for one stator pitch. Again, the difference is presented with respect to the baseline rotor. The dashed inclined line indicates the location of the second stator leading edge (LE S2). The map reveals the pitch-wise and radial location where the most pronounced increase in blade passing induced pressure amplitudes occurs. Two interesting zones are identified: one around 10–20% blade span (50–70% stator pitch) and one between 40–60% span (30–70% stator pitch). Both zones do not only show a radial extent, but are also pitch-wise stretched. This implies that these features are modulated by the passing of the rotor. Furthermore, both zones show their local maxima at a certain pitch-wise location (around 60% pitch) which do not coincide with the second stator leading edge location. The peak value of the absolute change for the zone close to the hub is 1.1% of the turbine inlet total pressure whereas the zone between 40–60% span presents an increase of 0.9% of the inlet total pressure. In close vicinity to the blade tip, an increased normalized pressure amplitude of up to 1% of the inlet total pressure is detected for the reduced blade count rotor at around 90% span and in pitch-wise direction at around 50% stator pitch.
As indicated in the rotor design section (Figure 2), the tip design of the reduced blade count rotor features a squealer tip geometry instead of a flat tip. Therefore, the contribution of the geometrical change to the noise production needs to be addressed. The tip clearance noise is separated into two mechanisms (Khorrami et al., 2002). Firstly, the unsteady interaction of the flow field in the vicinity of the tip with the tip surface which produces a broadband noise (rotor tip self-noise). Secondly, the downstream convection and interaction of the tip leakage vortex with the downstream stator which mainly contributes to the turbine tonal noise. Based on that, the main aspect to be considered for this study is the potential change or development of the tip leakage vortex. In a separate CFD study where the blade tip geometry is altered (flat tip against squealer tip, for reduced blade count configuration), the total pressure losses at rotor exit induced by the tip leakage vortex are found to be only slightly increased (0.1%) for the squealer tip which implies that the tip leakage vortex is not significantly strengthened. Based on these moderate changes, the contribution of the squealer tip geometry with respect to the flat tip (with the same blade count) on the tonal noise production is estimated to be low based on the predictions. However, an experimental assessment is still to be performed and could not be conducted in the time frame of this paper.
In order to understand the local changes in the blade passing induced pressure amplitude at rotor exit, the time-resolved flow field at rotor exit needs to be analyzed. One approach to further investigate the findings of Figure 9 is to link the stronger presence of the rotor-stator interaction to the modulation of the flow structures coming from the rotor (and from the upstream stator). In Figure 10, the time series of the stream-wise vorticity at rotor exit for the reduced blade count configuration is presented. The time scale is expressed as a fraction of the blade passing period T. To show the dynamics in more detail, the time series is limited to 40% of the blade passing period. The inclined dashed line shows the location of the downstream stator leading edge.
Figure 10.
Time series of stream-wise vorticity of the reduced blade count rotor at rotor exit in stator 2 frame of reference (FRAP).

The secondary flow structure system I, previously presented in Figure 8, is indicated with the dashed white line consisting of the hub and tip passage vortices as well as the tip leakage vortices. However, the pronounced increase in the blade passing pressure amplitude between 40–60% span in Figure 9 is associated to the vortex system highlighted by black dotted lines and indicated with II. This vortex system consists out of two vortices with opposite sense of rotation. The negative vorticity region which is located closer to the hub end wall is anticipated to be the remnant of the first stator hub passage vortex which is convected through the rotor passage on the suction side after being chopped by the rotor leading edge. The positive stream-wise vorticity zone in II is expected to be the first stator hub trailing edge shed vortex which again is convected through the rotor passage which has been in detail described by (Schneider et al., 2013).
As it has been shown in a previous study by (Chaluvadi et al., 2001), the remnant of the first stator hub passage vortex (which follows the suction side of the rotor) tends to radially migrate outwards over the rotor hub passage vortex. A similar behavior is found in the time sequence of the reduced blade count rotor flow field. As the rotor blade passing proceeds, the negative vorticity in zone II is continuously radially and pitch-wise displaced and with it the positive vorticity feature. At
For instance the rotor hub passage vortices as well as the rotor tip passage vortices undergo a similar increase in stream-wise vorticity as they swing around the potential field of the second stator which leads to the previously discussed increase in the blade passing pressure amplitude (Figure 9). When comparing the two turbine configurations, it is found that the baseline rotor exit flow field experiences similar changes in the stream-wise vorticity as described in the previous paragraphs. However, the peak negative and positive stream-wise vorticity of zone II is enhanced for the reduced blade count rotor by about 9% and 24%, respectively. In addition, the area covered by the two vortices has been calculated by means of iso-surfaces of stream-wise vorticity (2’000 Hz) in order to get a qualitative measure of circulation and therefore vortex strength. The circulation is found to be increased for the positive vorticity zone by about 40% and the negative one by 30%, respectively. The time-resolved changes in vortex strength for the reduced blade count rotor has been increased accordingly.
In this section an attempt is made to link the local increase in turbine tonal noise to the unsteady vortex dynamics of the 1.5-stage turbine configurations. Interestingly, the peak values in the blade passing induced pressure amplitude is predominantly provoked by the local vorticity fluctuations of the rotor passage vortices (including remnants of the first stator vortices) which are driven by the potential field interaction with the downstream stator. These periodic vorticity fluctuations inherently provoke local pressure fluctuations and therefore noise. By reducing the rotor blade count, the blade loading and therefore the secondary flow structure strength is prone to be enhanced, which promotes the local increase in tonal noise.
Turbine noise investigation at stator 2 exit
The previous section has revealed a noise generating mechanism at rotor exit. In order to assess the potential for these features to propagate through the second stator, the analysis is complemented by time-resolved probe measurements at the stator 2 exit.
The flow field of the reduced blade count rotor at the second stator exit is illustrated by means of the normalized time-averaged absolute total pressure for one stator 2 pitch in Figure 11 (left). The total pressure data are normalized by the turbine inlet total pressure. The dashed inclined line indicates the trailing edge of the second stator (TE S2). In the graph, two main regions of interest are identified. The dashed circle labelled with 1 covers the stator 2 hub passage vortex and the zone indicated with 2 is a region of accumulation of different flow structures including the ones from the upstream rotor. (Rebholz et al., 2016a) found that the rotor tip secondary flows are able to radially migrate towards mid-span when travelling through the downstream stator and accumulate close to the suction side of the stator vane. Furthermore, part of the reduced total pressure in zone 2 is provoked by the wake of the second stator and by the S2 tip secondary flow structures. In addition, it is found in the rotor exit flow field that the flow pitch angle of the rotor hub passage vortex is pointing towards the casing which indicates also the tendency for part of this flow structure to radially migrate towards mid-span and above. The second stator exit flow field is therefore affected by its own secondary flows and the ones from the upstream rotor.
Figure 11.
Time-averaged normalized total pressure at stator 2 exit for the reduced blade count rotor (left). Normalized BPF pressure amplitude measured with FRAP (right).
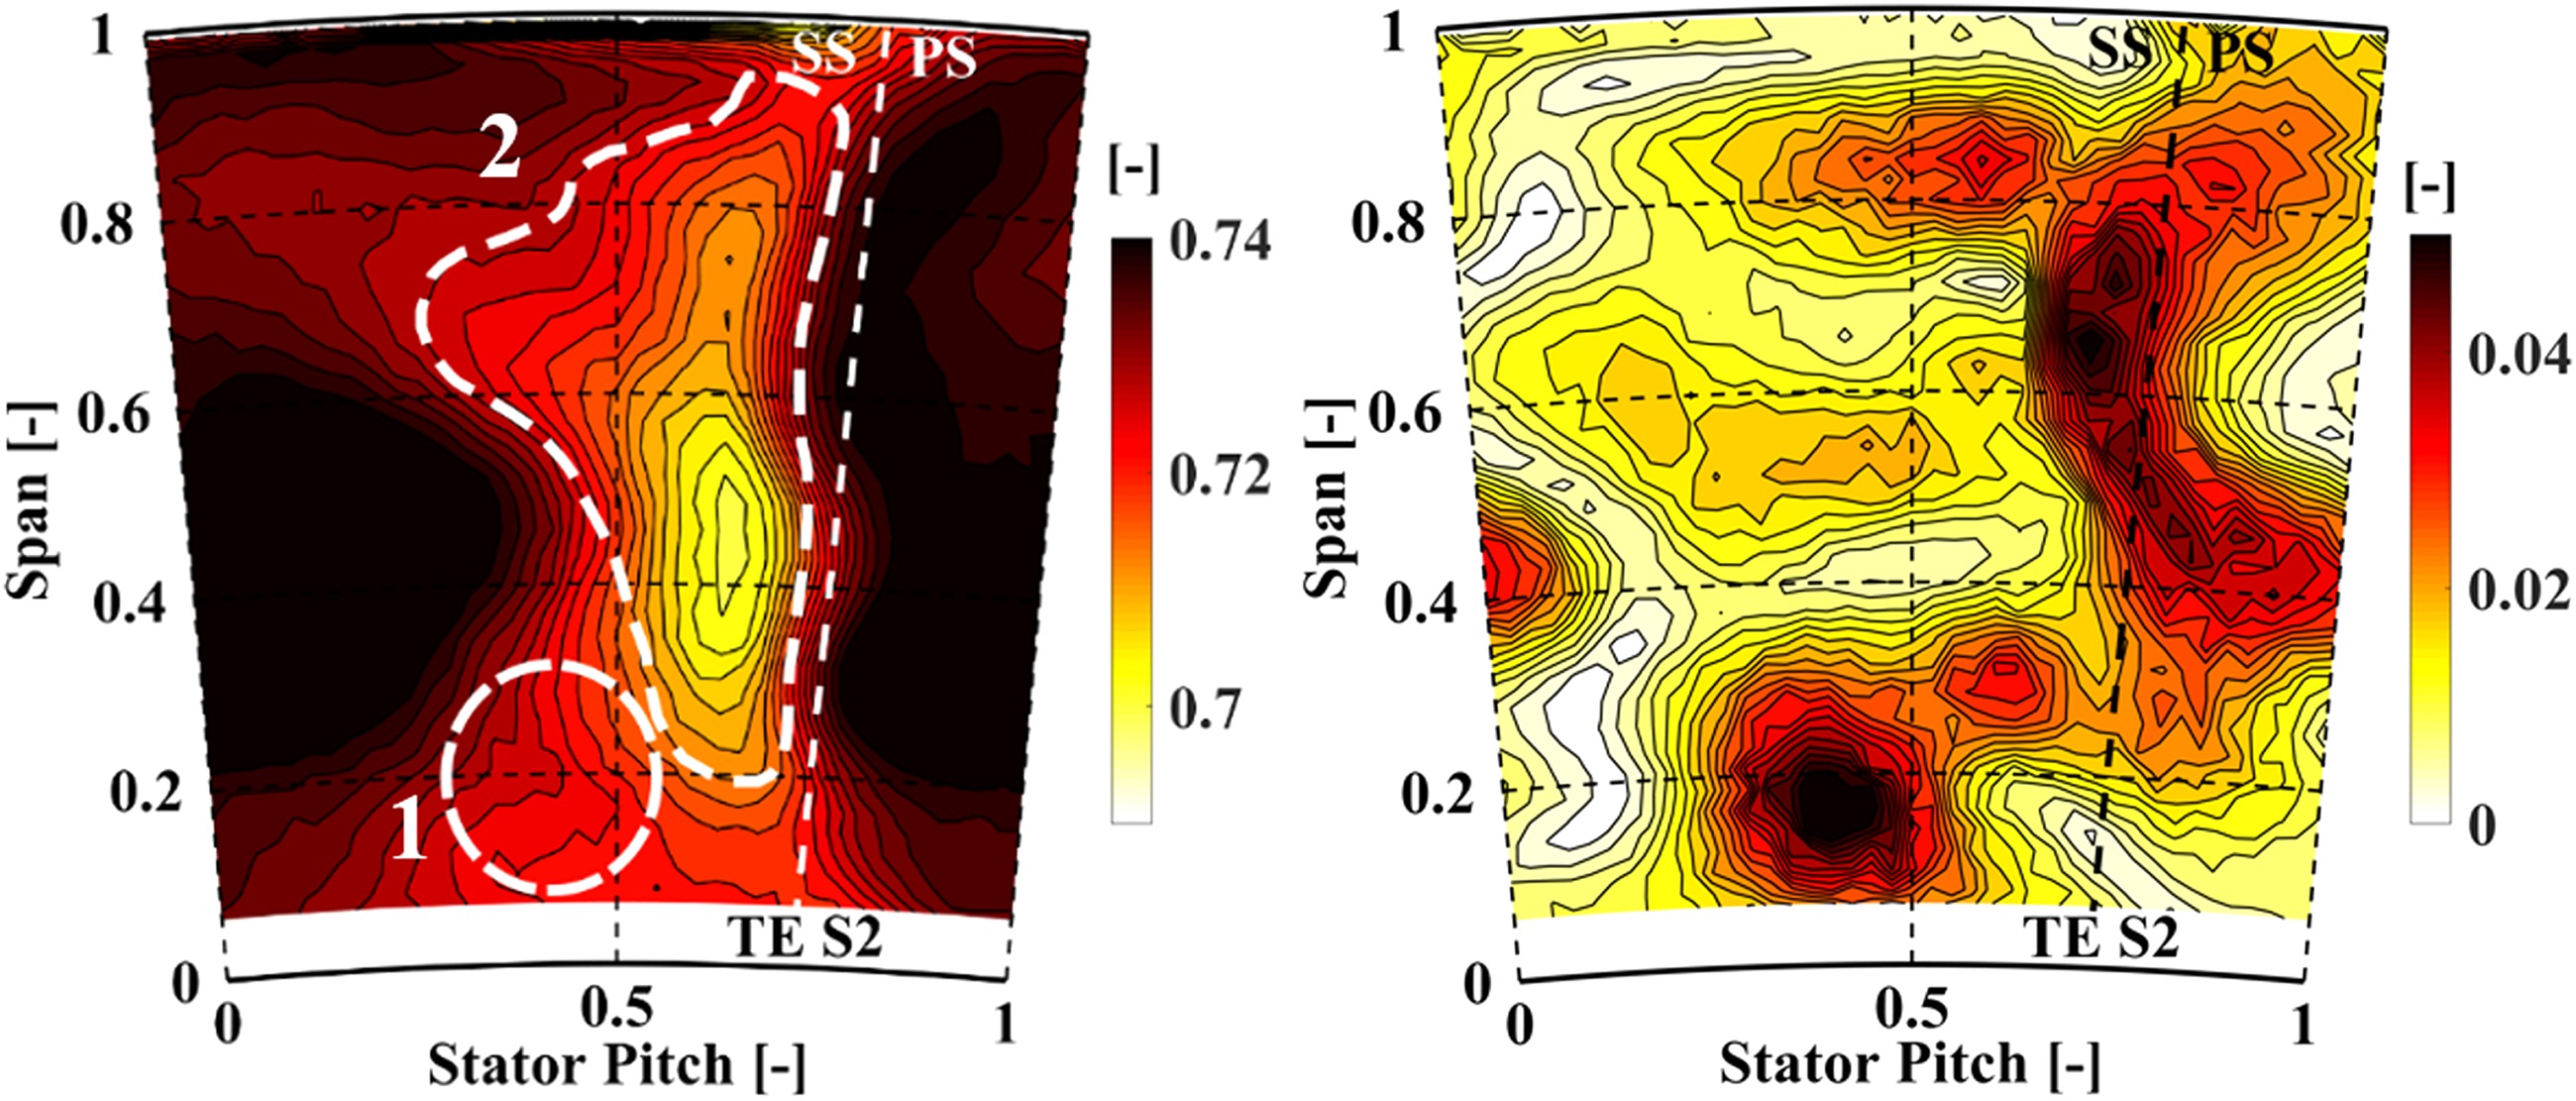
In Figure 11 (right), the normalized pressure amplitude of the BPF is shown for the reduced blade count rotor at stator 2 exit. The pressure information is normalized by the turbine inlet total pressure. In combination with the presented results of the normalized total pressure, one can better correlate the local changes of the pressure amplitude with the local appearance of the flow structures.
Overall, the whole flow field is characterized by a strong presence (1.5–2% of the total inlet pressure) of the blade passing related pressure fluctuations. The most pronounced increase is found in the hub secondary flow region (around 40% stator pitch and 15% span) as well as in close vicinity to the stator 2 trailing edge region which has been previously labelled with zone 2. Given the findings of the rotor exit assessment, the periodic strengthening of the secondary flow structures and the identified effect on the blade passing pressure amplitude also have an impact on the pressure amplitudes at the second stator exit. Due to the tendency for the accumulation of the rotor secondary flow structures around the mid-span region of the stator 2 exit and the potential interaction with the stator 2 originated flow structures, the blade passing related pressure amplitude might be even enhanced compared to the rotor exit.
Figure 12 (left) supports the statement by showing the pitch-wise averaged absolute change of the blade passing induced pressure amplitude over the second stator for the reduced blade count rotor. An absolute increase of up to 1.7% of the inlet total pressure is found at around 85% span and up to 1.4% in the mid-span region. The only reduction in the blade passing induced pressure amplitude occurs above 90% span (up to 1.5% of the inlet total pressure) which implies that the second stator tip end wall flow features (sometimes referred as corner vortex) do not considerably interact with the rotor blade passing. The consequences out of the reduction in blade count on the pressure intensity level with respect to the baseline configuration at the second stator exit is illustrated in Figure 12 (right). The radial profile of the pressure intensity change reveals the significant increase for the reduced blade count configuration over the whole span. The peak pressure intensity change of 13 dB is located at around 85% span whereas even at mid-span and close to the hub, changes up to 10 dB are detected.
Figure 12.
Blade passing pressure amplitude change over second stator for the reduced blade count rotor (left). Span-wise pressure intensity increase for the blade passing frequency of the reduced blade count rotor relative to the baseline at stator 2 exit (right) measured with FRAP.
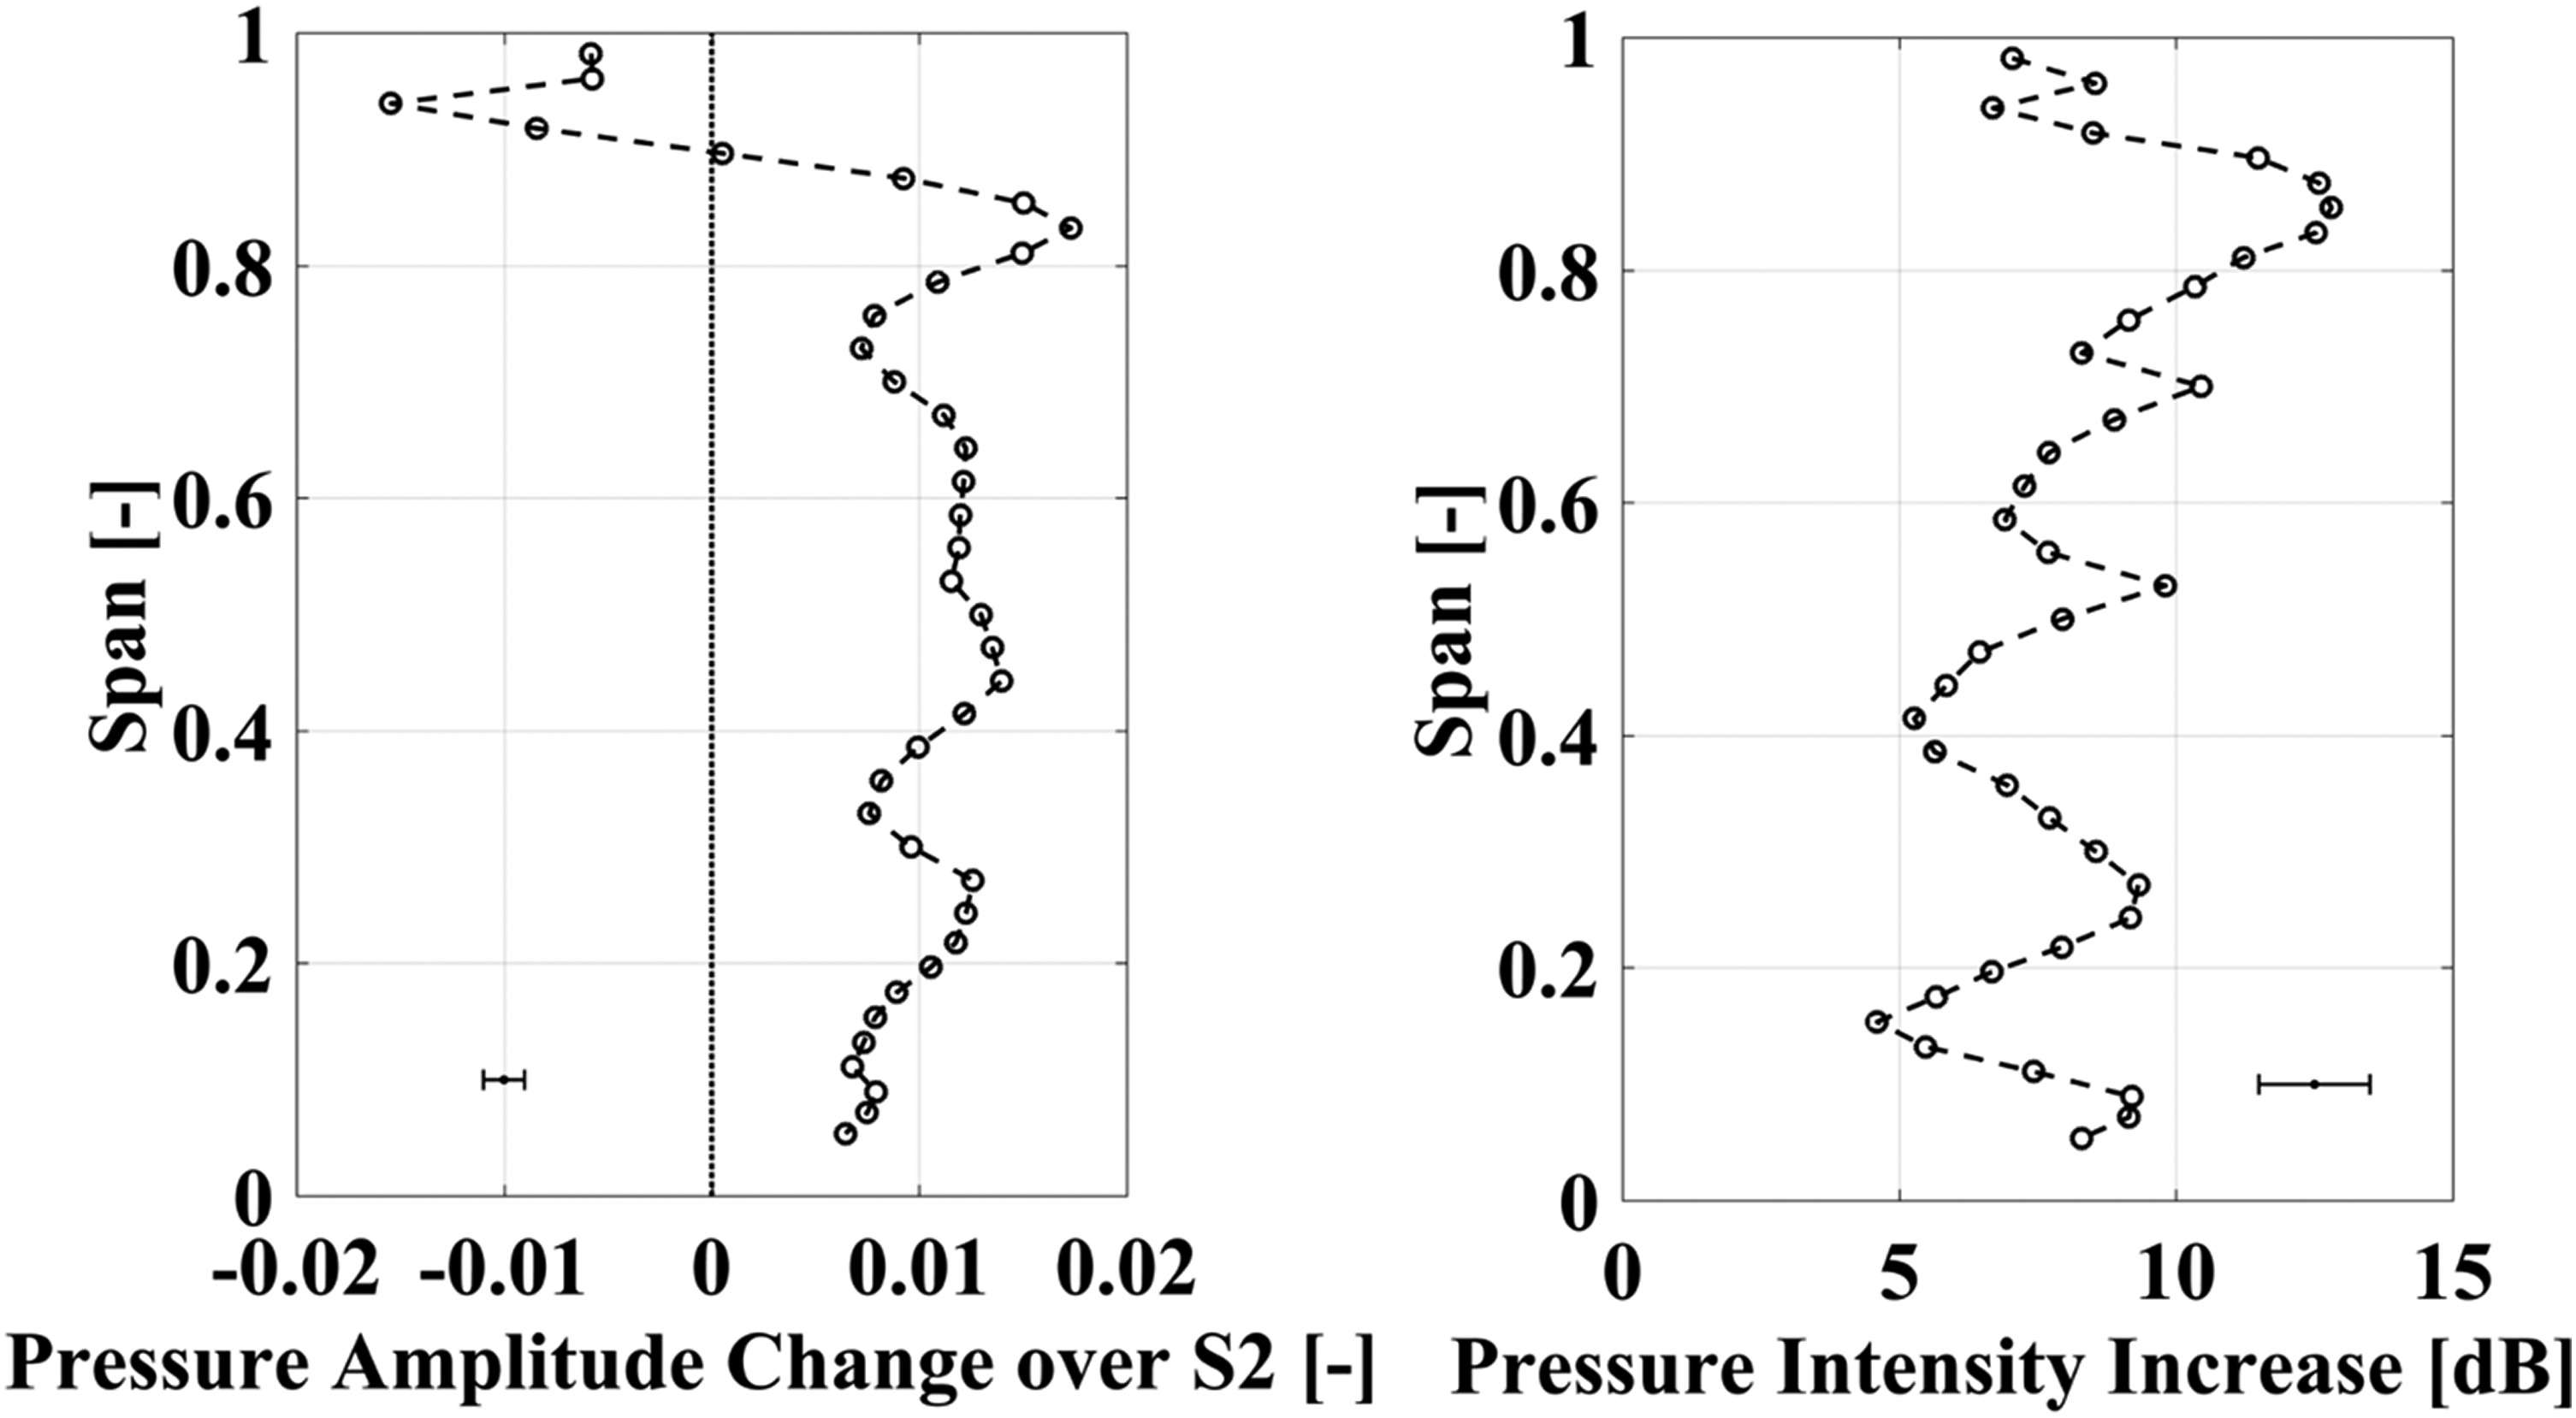
Given the trend that over the whole span a higher blade passing induced noise is measured for the reduced blade count rotor, allows the following aspects to be mentioned: the rotor secondary flow structures are convected into the second stator passage where they periodically (with blade passing) interact and accumulate with the stator 2 originated flow structures. The periodic strengthening of the rotor secondary flow structures at rotor exit, which is found to be even increased for the reduced blade count rotor, is one of the sources for the higher tonal noise at stator 2 exit. In addition, the pronounced span-wise increase in the blade passing pressure amplitude over the second stator for the reduced blade count rotor as shown in Figure 12 (left), also suggests that the whole second stator flow field interacts strongly with the upstream rotor. In summary, this tells the reader that not only the flow structures coming from the rotor but the second stator flow field itself, which interacts with the rotor, drives the tonal noise level of the turbine configuration.
Conclusions
Based on the presented results, the following conclusions are drawn:
The potential aerodynamic performance penalty due to the rotor blade count reduction can be overcome by a span-wise mass flow redistribution from the tip towards blade mid-span in combination with a moderate change in flow turning. The strengthening of the rotor secondary flow structures is still found to be inherently driven by the blade loading, but is outweighed by the benefit gained from the radial redistribution of the work extraction.
The turbine tonal noise at rotor exit is found to be strongly coupled to the secondary flow structure modulation by the rotor blade passing. The periodic vortex strengthening due to the stream-wise acceleration of the rotor secondary flows around the potential field of the downstream stator is one of the drivers for the increase in sound pressure level at rotor exit. The combination of higher blade loading, which enhances the rotor secondary flow strength, and keeping the same axial distance to the downstream stator as for a higher blade count rotor, is detrimentally affecting the turbine tonal noise of the reduced blade count rotor configuration. Therefore, if noise is of primary concern, a significant reduction in rotor blade count should not come along with the sustainment of the axial gap between rotor and stator.
The blade passing induced noise is found to be considerably increased over the second stator passage. This implies that not only the downstream effect of the convected rotor flow structures need to be considered, but also the second stator originated flow features which interact with the upstream rotor need to be budgeted in the acoustic design of the turbine.
Overall, the improvement in aerodynamic performance by 0.4% for a 22% reduction in number of rotor blades stays in conflict with an up to 13 dB higher turbine noise level with respect to a rotor with higher blade count.
Nomenclature
Variables
axial chord (rotor) [m]
specific heat for constant pressure [J/(kg*K)]
squealer cavity depth [m]
rim seal purge flow injection rate [%]
mass flow [kg/s]
torque [Nm]
rotational speed [rpm]
pressure [Pa]
rim cut back squealer [m]
squealer rim thickness [m]
temperature/blade passing period [K]/[s]
ratio of specific heats [−]
efficiency [−]
pressure ratio [−]
rotational speed [rad/s]