
Introduction
The increase of blade aspect ratio in a multistage compressor creates additional axial space and thus increases design flexibility (e.g. the possibility to integrate more stages in the same axial space). An overview of the effect of aspect ratio on aerodynamic and mechanical behaviour of the compressor can be found in Wennerstrom (1989) and Wisler (1985). The authors name mostly negative ramifications of an increased aspect ratio. Especially the decrease in surge margin and the greater sensitivity to forced response and flutter are emphasized as a motivation for the development of wide chord blades over the last decades. The drop in surge margin can be explained by the larger relative clearance and was first mentioned by Smith (2002). According to Srinivasan (1997) the resonance frequency of high aspect ratio blades is lower. This leads to a higher number of possible resonances with existing excitation frequencies. According to Cumpsty (1990) the greater susceptibility to blade flutter is in agreement with empirical correlations between the occurrence of stall flutter and a characteristic critical reduced frequency. While this explains the design trend to wide chord blades in the past, the before mentioned effects could be strongly extenuated by present-day design features as e.g. blade designs to reduce clearance sensitivity - see Schmidt et al. (2017) - and intentional mistuning to reduce flutter and forced response sensitivity – see Schönenborn et al. (2012).
The question remains, how compressor efficiency is affected by aspect ratio. In this case the literature gives ambiguous answers. For an increase in aspect ratio, measurements from Britsch et al. (1979) and Fahmi (1967) show a reduced efficiency, while in Fligg (1966) no change in efficiency can be observed and in Smith (1970) an increase in efficiency is stated. A collection of empirical secondary loss correlations by Grieb (2009) shows a similar picture. The dependency of secondary loss on aspect ratio varies strongly among different correlations. This situation of conflicting results in literature is also stated by McKenzie (1997). A recent study of To and Miller (2015) has addressed this problem and gives a good overview of the optimum aspect ratio for maximum compressor efficiency in a compressor with repeating stages.
However a uniform increase of the aspect ratio of all stages in a multistage compressor - as assumed in this study - is not always a valid approximation. The question arises how compressor efficiency is affected, when the aspect ratio of one stage or a single blade row is changed. In this case the incoming endwall boundary layer of the modified blade row would not be affected by the change in aspect ratio. Compared to the repeating stage assumption (where the inlet boundary layer would shrink in proportion to the blade chord length) this would yield in higher secondary loss. This paper aims at finding a quantitative estimation of overall loss for both the change in aspect ratio of a single blade row and the uniform change of all blade rows in a multistage compressor.
Methodology
This work is divided into three parts. In the first part, the expected dependency of blade loss mechanisms on aspect ratio from the analytical theory is presented. The second part covers 3D CFD simulations for a linear cascade. From these simulations, a correlation for the change in secondary loss is derived. In the third part an engine-like HPC stage is simulated with the same CFD setup and compared to cascade results and analytical theory.
All 3D-CFD simulations were performed with the RANS solver TRACE. The solver is based on a cell-centred finite volume approach developed by DLR and MTU Aero Engines AG. The convective fluxes are discretized using the MUSCL-extrapolation and Roes's TVD-upwind scheme (Roe, 1981), leading to a second order accuracy in space. The simulations were performed steady state and fully turbulent. The k-ω model was used with the stagnation point anomaly fix by Kato and Launder (1993).
The meshes of all configurations are structured and have been generated with Autogrid 5. To resolve the viscous sublayer, a Low Reynolds approach has been applied and thus the average non-dimensional wall distance
In between the blade rows a mixing plane approach has been applied. Thus only one blade passage per row has been modelled with periodic boundary conditions in circumferential direction. The radial distribution of total pressure, total temperature and flow angle at the inlet plane and the radial average static pressure at the outlet plane have been forced.
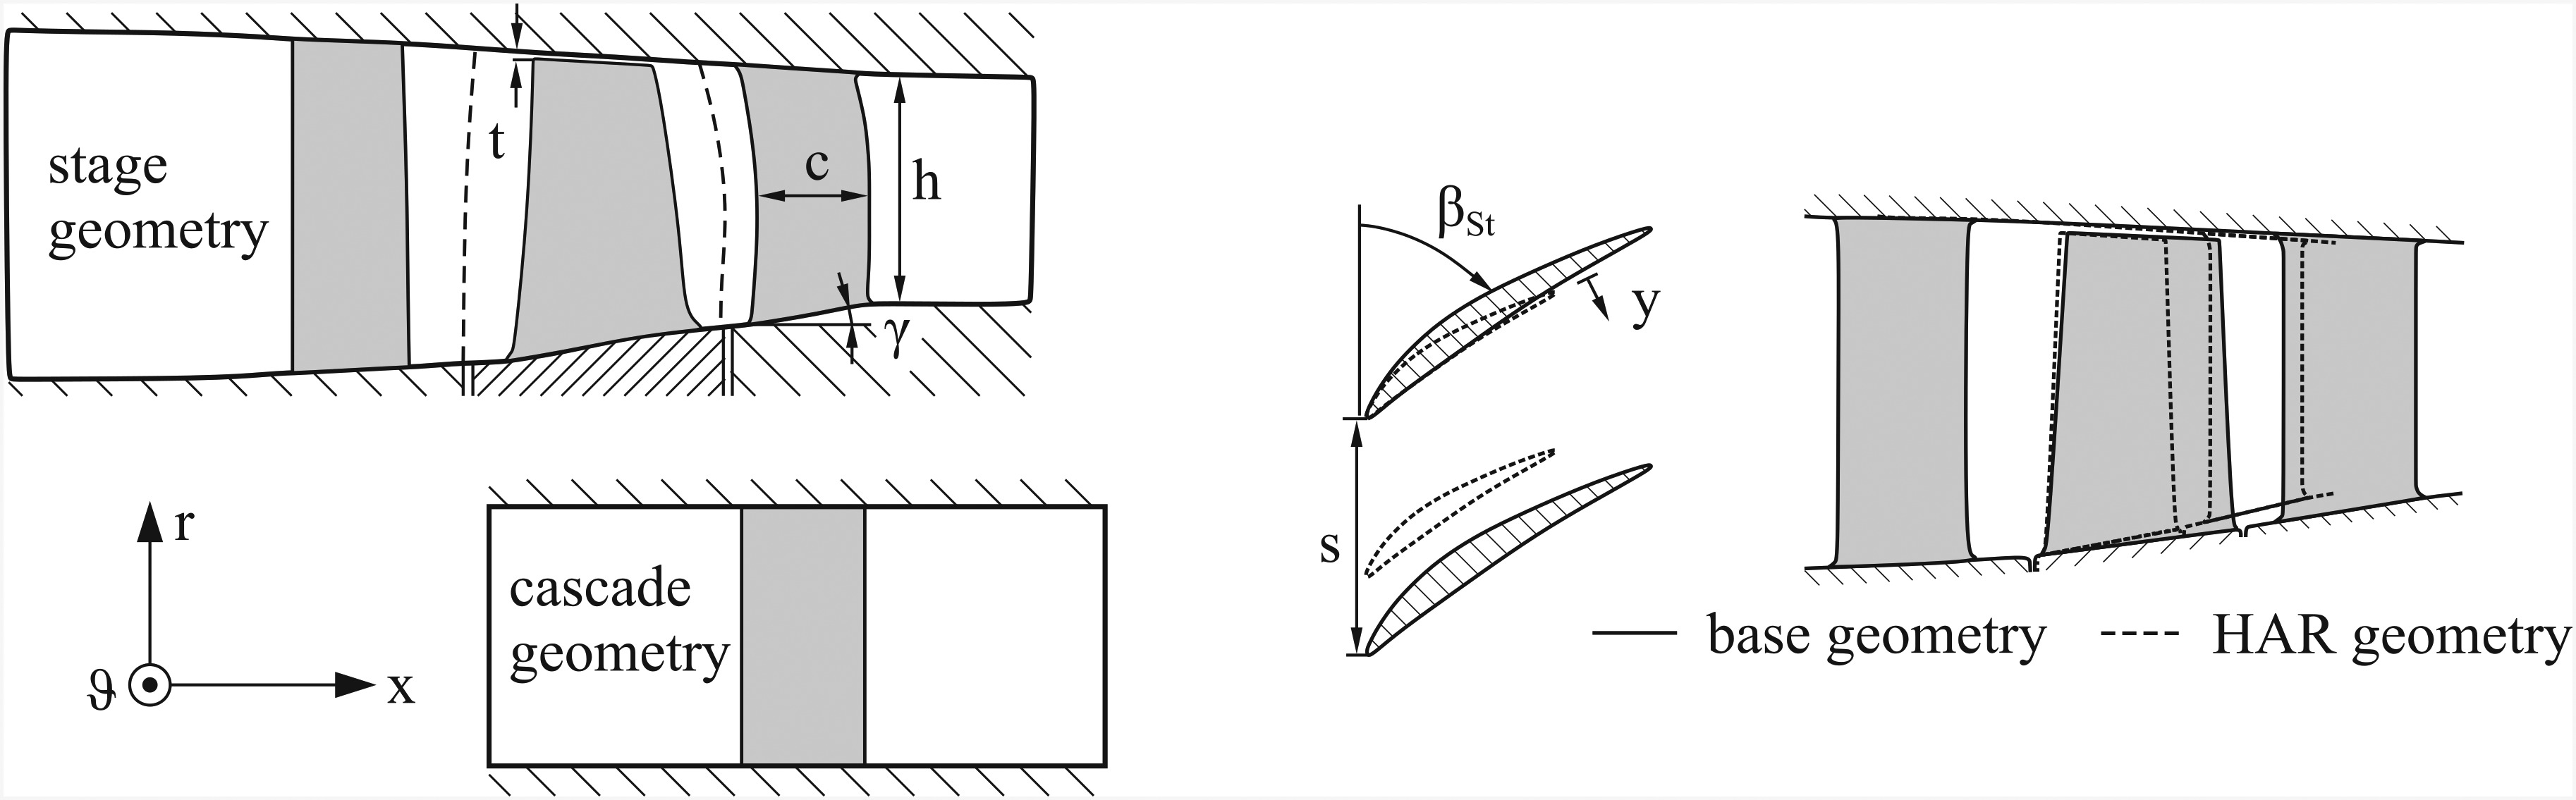
The left part of Figure 1 shows the two base geometries analysed in this paper. In part II of the results section, a linear cascade derived from the stator of the depicted compressor stage is examined. The aim of this study is to analyse the aerodynamic impact of a change in aspect ratio without effects due to blade row interactions or 3D blade design. Inlet total temperature and pressure as well as the flow angle of this cascade feature a constant radial profile. The inlet Mach number is reduced to 0.3 in order to realize a constant hub and tip radius (as shown in Figure 1). In part III the whole stage is analysed to investigate, whether the cascade results can be transferred. Table 1 summarizes the most important parameters of stage geometry and operating point.
Table 1.
Overview of compressor stage parameters.
Profile-, secondary and clearance loss of each blade row are evaluated separately as
with
Profile loss is defined as loss at midspan (in all computations a distinct midspan region could be observed). Secondary loss is defined as the remaining loss at the endwalls less clearance loss. The latter is calculated via the difference between a simulation with and without clearance. Circumferentially and radially averaged profiles are calculated via a mass average of total pressure, total temperature and all velocity components. All other quantities are derived from the before mentioned.
Aspect ratio is increased by a one-to-one scaling of the blade profiles, reducing chord length c and maintaining blade height h, relative thickness and solidity
Prior to this study the methodology of changing aspect ratio has been assessed intensively. The approach to keep blade height constant and change blade chord is the widely agreed technical relevant application for a change in aspect ratio. However the blade thickness has been handled differently by numerous authors. Smith (1970) and Watzlawik (1991) have compared blades with the same relative thickness distribution and thus identical dimensionless cascade geometry. To and Miller (2015) have kept the absolute profile thickness constant. This is a conservative approach with respect to static blade stress but it might overestimate the inevitable increase in profile loss by far. Together MTU and RWTH Aachen identified a constant absolute leading and trailing edge thickness as a realistic scenario in order to approximately maintain the same maximum static and dynamic blade stress levels and manufacturing tolerances. In contrast, the maximum blade thickness distribution is maintained – according to the approach of Smith (1970) and Watzlawik (1991).
Following the same line of reasoning, the fillet radii between blade and endwall need to be kept constant. In order to maintain the same meridional velocity distribution, the row inlet and outlet cross sections and thus the hub and tip radii need to remain constant too. Due to the reduced blade chord, this leads to an increased endwall slope angle
Results and discussion
Part I - Analytical theory
Prior to the numerical analysis an analytical theory for the change of the most relevant loss components due to a change in aspect ratio is presented.
Profile loss
Approximating the blade as a flat plate and following Denton's approach (Denton 1993), we can express the profile loss due to friction on the blade surfaces as
With the dissipation coefficient
the profile loss coefficient can be derived as
The parameters
This only holds true, if the non-dimensional cascade geometry remains constant. Hence, this approach does not account for a change of relative leading- and trailing edge thickness. Denton (1993) states for laminar flow, that
According to Schlichting (2006), the momentum thickness
Combining Equations (7) and (8), we can derive a relation between the average dissipation coefficient and the blade chord Reynolds number as
From Equation (5) we can finally derive the dependency
for laminar flow. For turbulent flow no such analytical solution exists. According to To and Miller the loss coefficient for turbulent flow over a flat plates varies with
This means that for an increase in aspect ratio, profile loss increases accordingly. Considering blade geometry and loading, the exponent of
with
Clearance loss
According to Storer and Cumpsty (1994) clearance loss in incompressible flow can be approximated by
When aspect ratio is altered, all parameters occurring in this equation such as clearance t, solidity
Secondary loss
For a simplified case corresponding to an incompressible linear cascade, Mellor and Wood (1971) derive the following integral boundary layer equation:
This corresponds to the von Kármán momentum integral with the additional occurrence of blade forces. The so called “blade force deficit” is defined as
It represents a measure for the difference in blade force (represented through the pressure difference between pressure and suction side
In axial compressors the axial velocity component often varies only slightly between row inlet and outlet. The change in axial velocity is thus neglected for the following analysis and Equation (14) can be reduced to
The endwall shear stress usually shows as a weak dependency on axial length or rather Reynolds number as an approximation of Schlichting (2006) for turbulent pipe flow
reveals. The shear stress is therefore approximated as constant between row inlet and outlet. Regarding the blade force deficit, the parameters
which is independent from aspect ratio. This gives
In Equation (19) an approximately constant shape factor H is assumed between row inlet and outlet, as supported by the numerical results in this study and flat plate theory according to Schlichting (2006) respectively. Further, the dependency between momentum and displacement thickness is approximated by the 1/7 power law according to the Blasius-solution (Blasius, 1908) for turbulent pipe flow. In the next step, Equation (16) is integrated in axial direction from row inlet i to outlet
Herein the average momentum thickness for the integral term on the right-hand side was approximated by a linear average, assuming an approximately linear increase of boundary layer thickness between inlet and outlet.
If we consider the definition of stagger angle
This suggests a linear relation between inlet and outlet momentum- and thus boundary layer thickness. Endwall boundary layer thickness and secondary loss are usually closely coupled – especially, when the blade loading remains constant. For this reason, secondary loss is expected to vary proportionally to momentum or rather boundary layer thickness. This theory of boundary layer growth incorporates many simplifications, thus a numerical verification for the cascade geometry is presented in part II.
Part II – Numerical results for a linear cascade
In the next part of this investigation the aspect ratio of a linear stator cascade (as described above) is altered in a CFD simulation. Profile and secondary loss are examined separately and compared to analytical theory. Aspect ratio is varied from 1.0 to 4.0 with 2.0 being the base configuration. The relative inlet endwall displacement thickness
Due to an increase in aspect ratio, realized according to the above mentioned methodology, the following effects on profile loss occur:
Increased loss due to lower Reynolds number
Increased loss due to thicker relative leading- and trailing edges
The following effects on secondary loss occur:
Decreased loss due to thinner endwall boundary layer
Increased loss due to larger endwall slope
Increased or decreased loss due to larger relative fillet radius
Loss mechanisms with minor impact
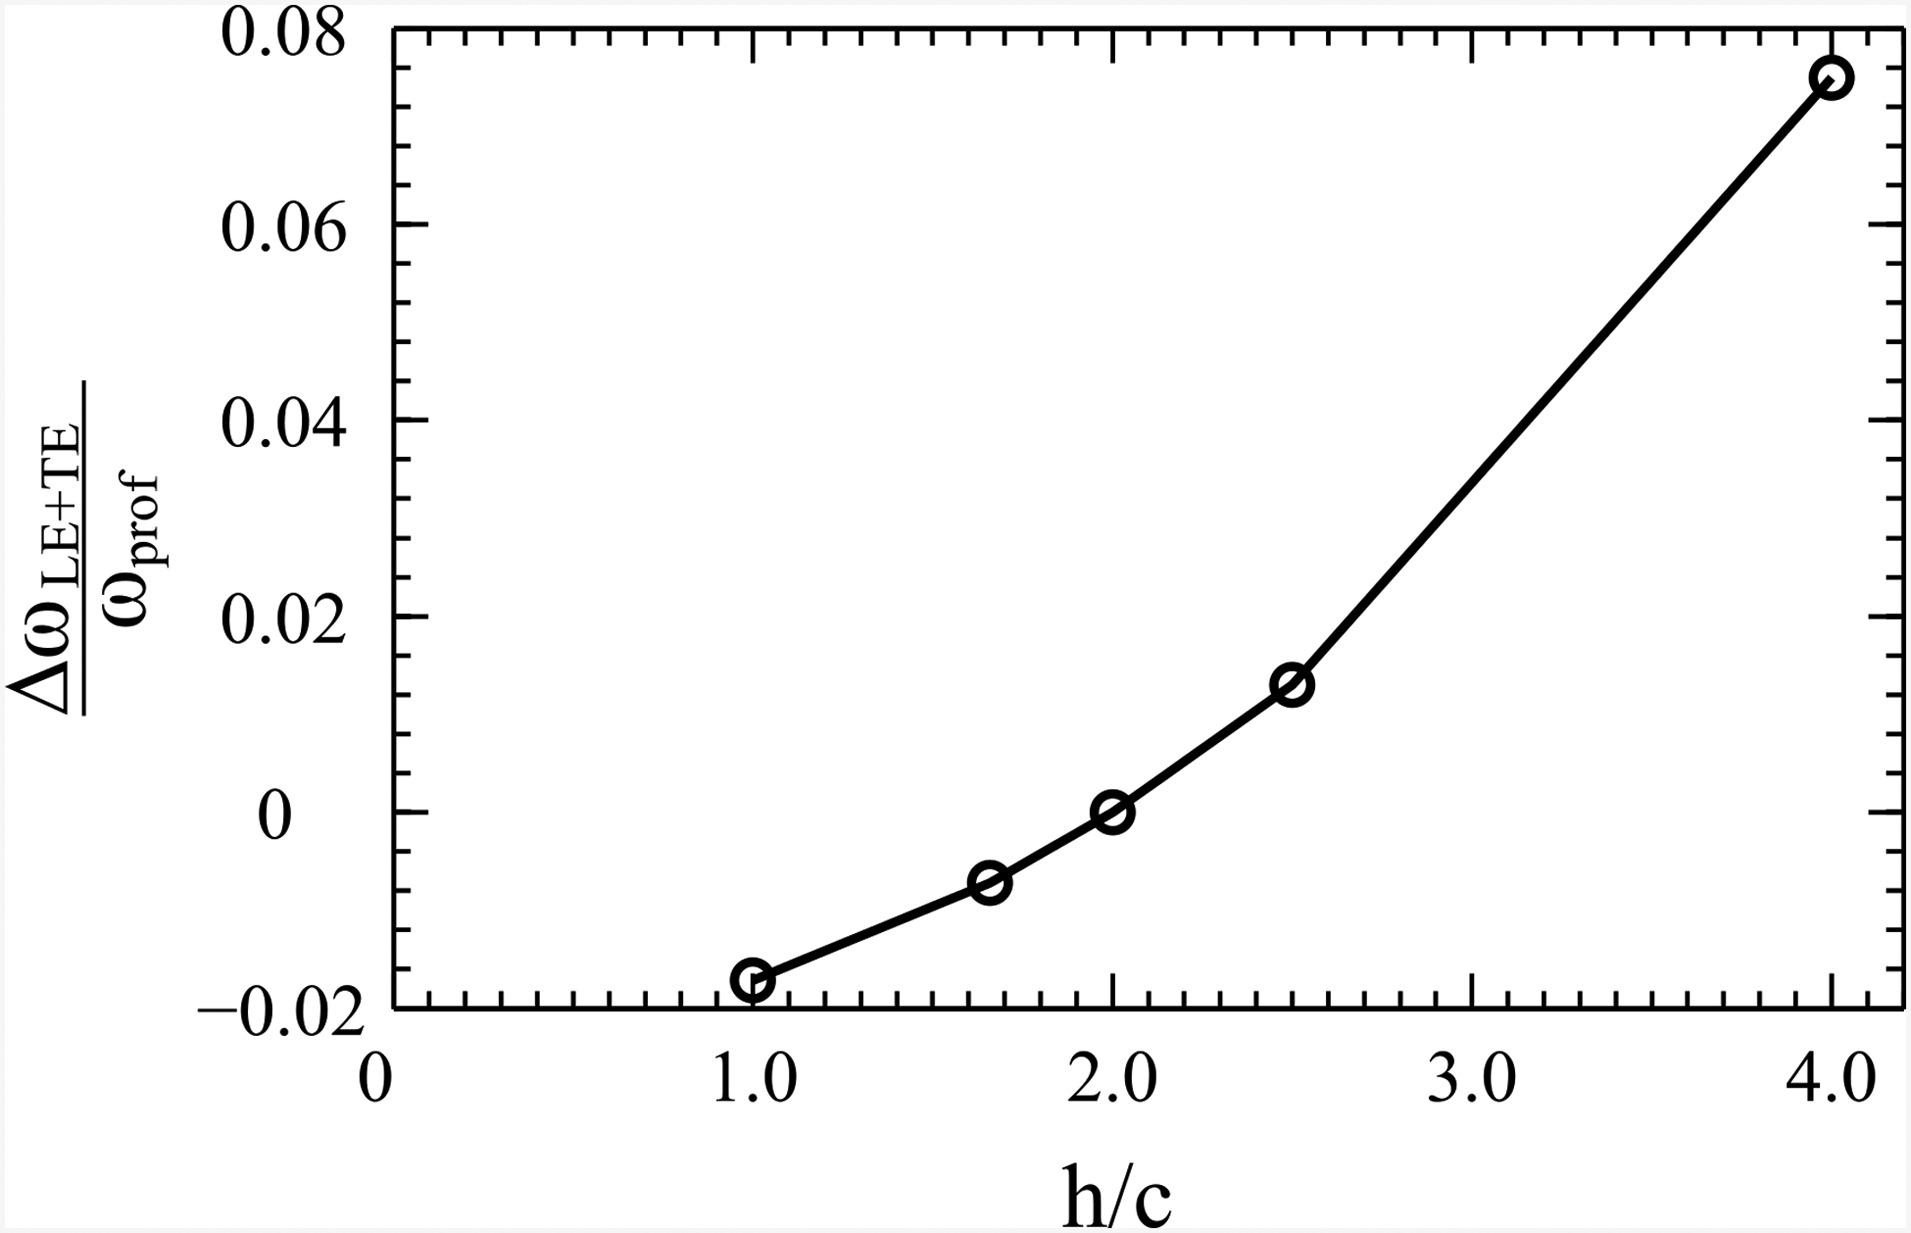
The loss increase due to a larger relative leading edge thickness can be explained by a larger portion of the chord being subjected to the higher velocities of the leading edge flow region. At the trailing edge higher mixing loss occurs due to a larger trailing edge thickness compared to the blade spacing. To investigate the effect, aspect ratio (and thus chord length) was changed, while leading and trailing edge thickness was kept constant.
The resulting change in profile loss (compared to the base configuration) as a function of aspect ratio is depicted in Figure 2. For the considered geometry, the effect of increased relative leading and trailing edge thickness on profile loss is up to 40% compared to the effect of the change in Reynolds number. As this effect strongly depends on the individual profile geometry, a general correlation cannot be derived.
A numerical investigation of the effect of increased endwall slope on secondary loss can be found in Peters (2019). A detailed description of the results cannot be given in this paper as the change in secondary loss strongly depends on endwall design. However, a general conclusion from the investigation is that a stronger endwall slope leads to a weaker reduction of secondary loss when changing the blade aspect ratio. The effect of endwall slope on secondary loss is found to be about 20% to 40% of the effect of a thinner endwall boundary layer that will be discussed later in this paragraph. For a high accuracy computation of secondary loss the effect of endwall slope is not negligible. However, in order to quantitatively determine its impact, 3D CFD simulations of the exact geometry seem inevitable.
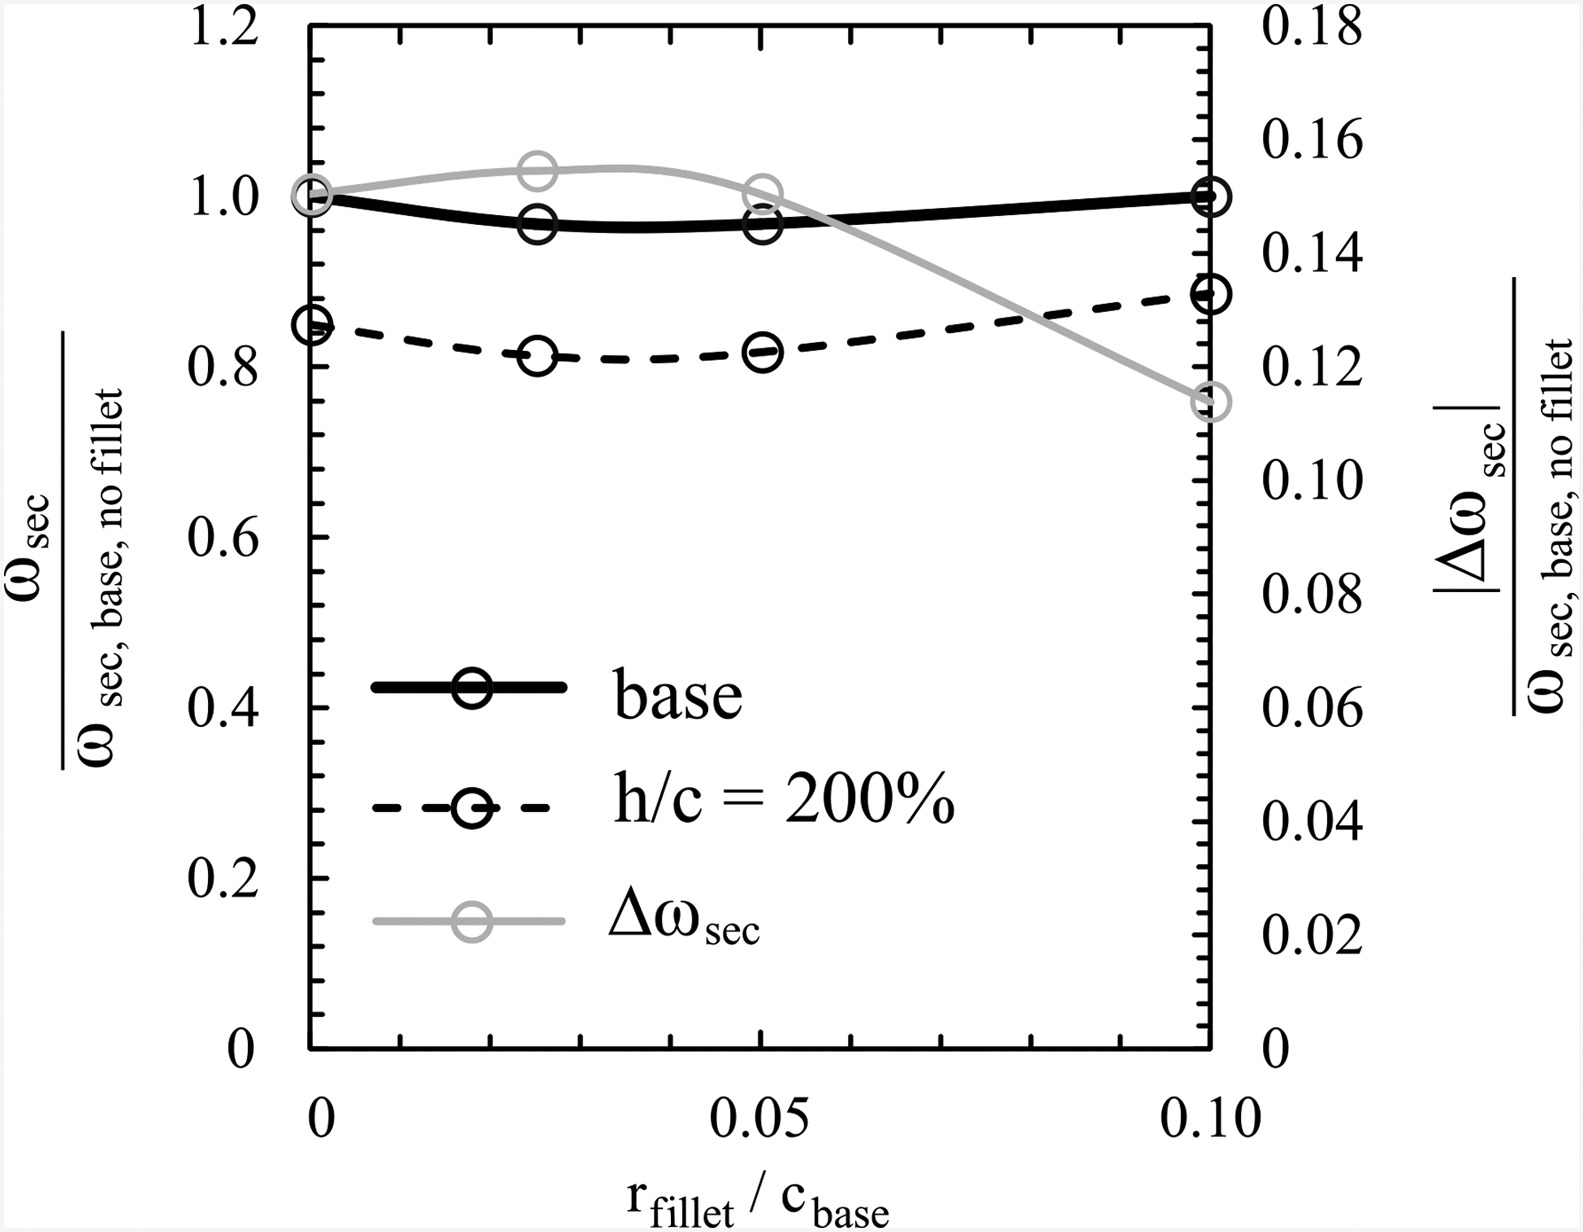
According to Meyer et al. (2012) the effect of an increased relative fillet radius (ratio of fillet radius to chord length) has a beneficial effect for small fillet radii (due to a suppressed corner stall) and a detrimental effect for large fillet radii (due to higher local trailing edge loss). To investigate this effect for the problem at hand, the aspect ratio was doubled from 2.0 to 4.0 for four base configurations with different fillet radii from 0 to 10% chord length. When aspect ratio was increased, the fillet radius remained constant, leading to an increased relative fillet radius
The results can be observed in Figure 3. Up to a fillet radius of 5% chord length, the decrease in secondary loss due to an increase in aspect ratio is slightly higher compared to a configuration without fillet radius. For 10% chord length however, the change in secondary loss due to an increase in aspect ratio drops from 15% to 12%. As fillet radii for HPC front stages are usually smaller than 10% chord length, this shows, that the effect of fillet radius can be neglected, if one is interested in the effects of first order.
For all three above mentioned loss mechanisms a detailed description of methodology and results can be found in Peters (2019). In this paper however only the most dominant and at the same time generally relevant effects will be examined in detail: the effect of Reynolds number on profile loss and the effect of a thinner endwall boundary layer on secondary loss.
Reynolds number effect
The change in profile loss was found to be almost independent from endwall boundary layer thickness. This can be explained by the fact, that the midspan region is approximately independent from the endwall regions as long as aspect ratio does not fall below a value of ∼1.0 - see Schmidt et al. (2017) and To and Miller (2015). Thus only the results for
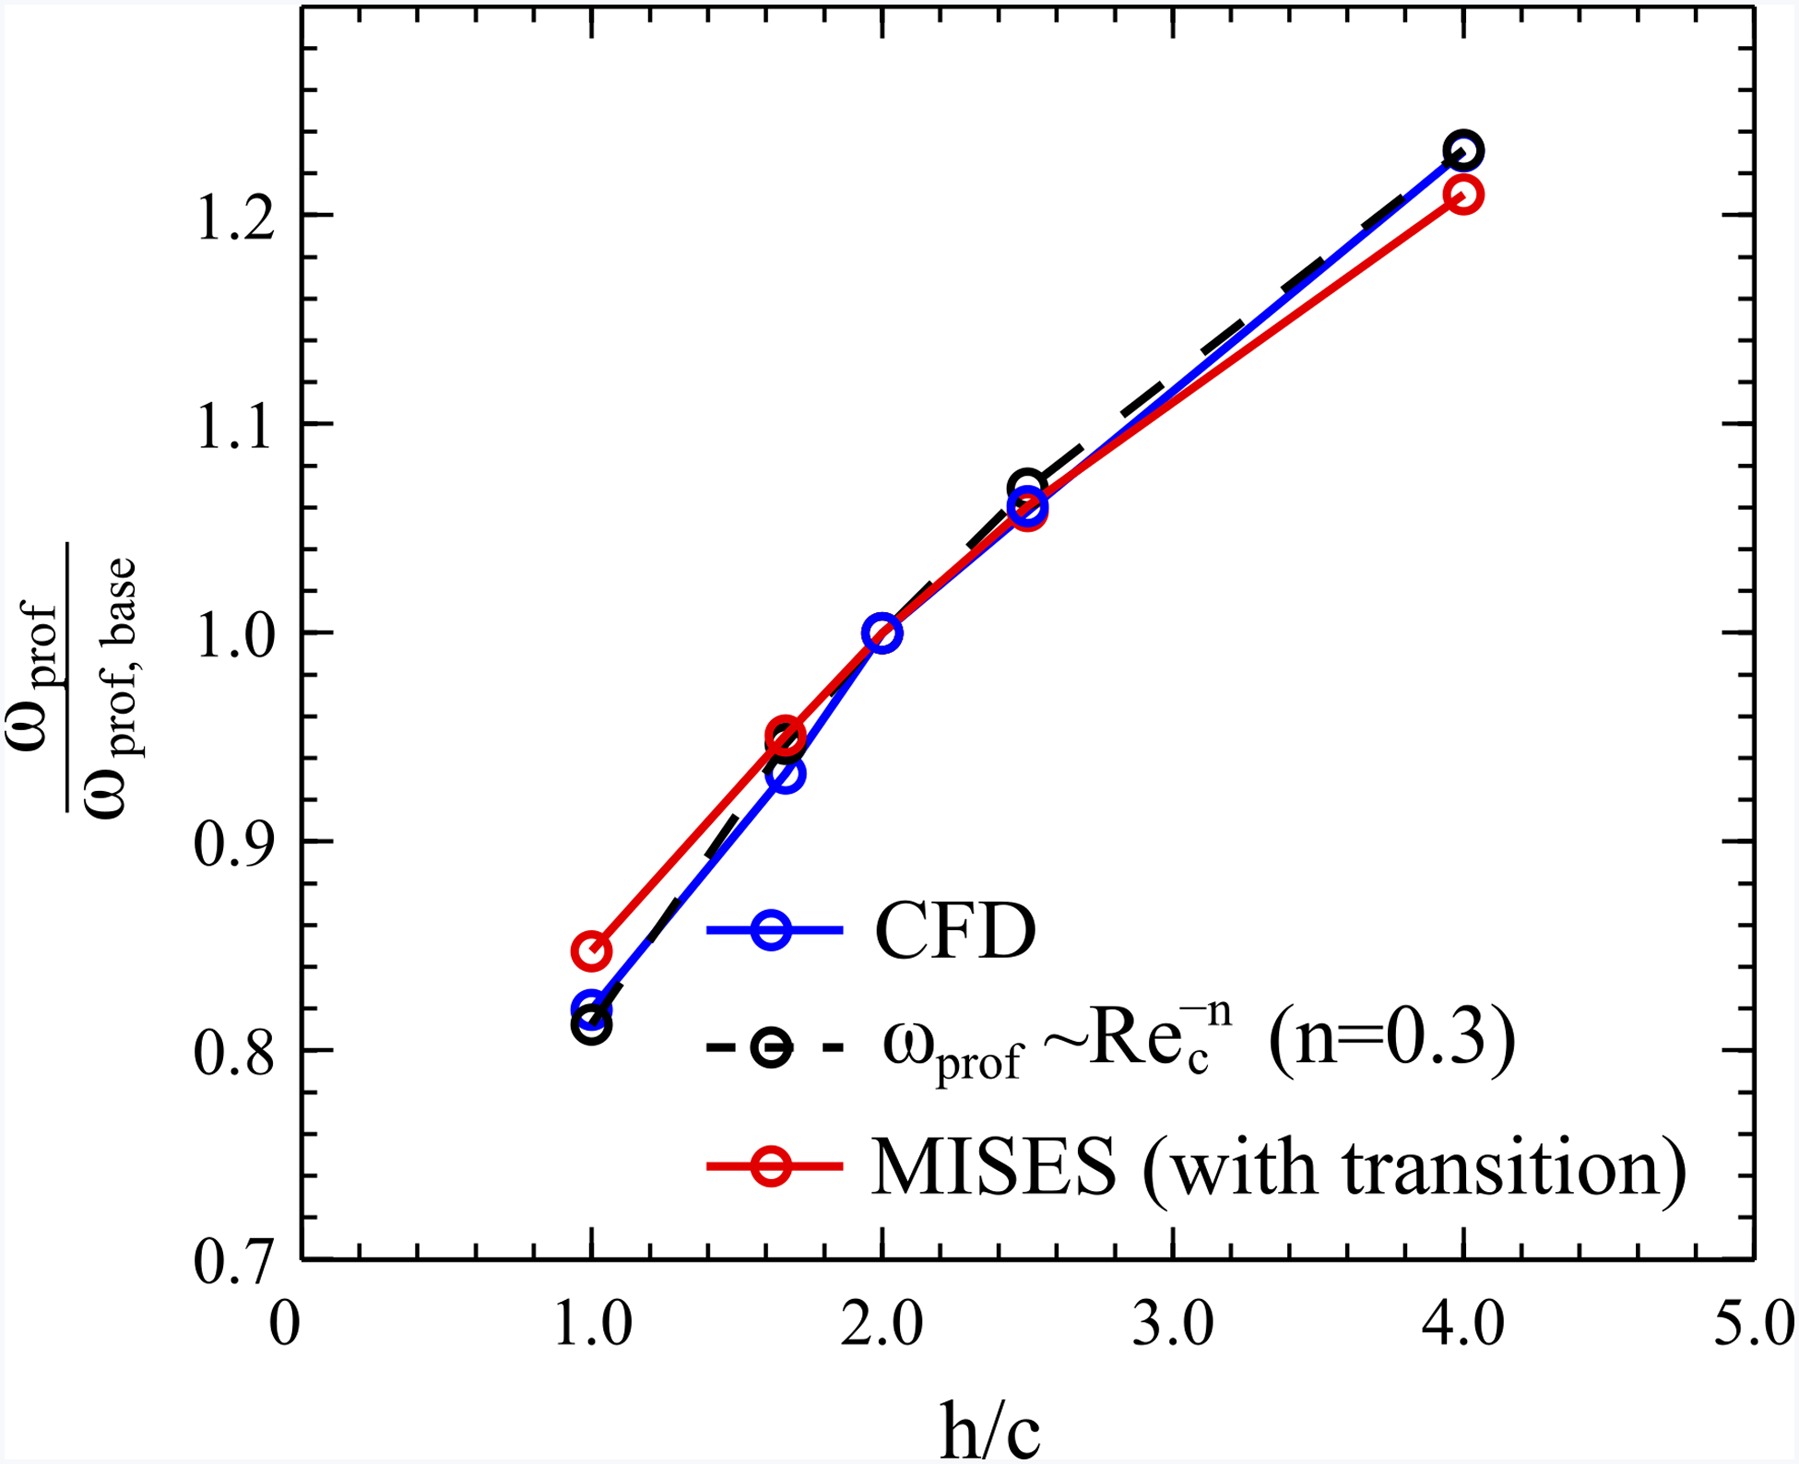
We can observe good agreement between MISES, 3D CFD and analytical theory, if the coefficient
Considering the airfoil as a flat plate, the increased profile loss for a shorter chord length can be explained as follows. For the low and high aspect ratio plate, the wetted area is the same (as plate length decreases but plate number increases accordingly due to constant solidity). The skin friction coefficient (scaling with
Effect of thinner endwall boundary layer
The last herein discussed loss component is the variation in secondary loss due to a thinner endwall boundary layer. As the chord length is the characteristic length for the endwall boundary layer, it is evident, that its thickness and thus secondary loss will decrease, when chord length is reduced. However, when deriving a quantitative correlation for the change in secondary loss, the question how to treat the incoming boundary layer thickness as an input variable arises. In contrast to the before mentioned parameters, two ways of handling the incoming boundary layer seem technically relevant.
The first approach would be to keep the ratio of inlet boundary layer thickness-to-chord length constant when increasing aspect ratio. This corresponds to a repeating stage concept as e.g. applied in To and Miller (2015). In a repeating stage compressor, it is assumed that after about the 4th compressor stage, the endwall boundary layer shows no more significant growth for the downstream stages. As (for sufficiently large aspect ratios) the chord length is the most relevant length scale for this problem, it is reasonable to assume, that this “equilibrium” boundary layer thickness scales with the average chord length of the compressor. So the approach of a constant relative boundary layer thickness approximates a multistage compressor with a uniform change in aspect ratio for all stages. The works of Watzlawik (1991) and To and Miller (2015) are based on this approach and show that secondary loss varies inversely with aspect ratio.
However the uniform change of aspect ratio in a multistage compressor does not seem to be the only technical relevant case. In many cases a change of only one blade row or a non-uniform change of aspect ratio seems more beneficial due to the different aerodynamic properties of the different compressor stages. Another case to investigate could thus be a single blade row. If this blade row is the only row to change, the absolute thickness of the inlet boundary layer would necessarily remain constant (as all upstream geometries also remain unchanged). In the following investigation, this approach is called the single row approach. In contrast to the repeating stage approach the ratio of boundary layer-to-blade height instead of the ratio of boundary layer-to-blade chord is kept constant. To the author's best knowledge, a similar approach is not yet available in the literature. In the following paragraph, both approaches are investigated numerically.
For the repeating stage approach, the cascade incoming relative displacement thickness is fixed at

The curve for the repeating stage approach perfectly fits the correlation
which is well known from the work of Watzlawik (1991) and To and Miller (2015). For the single row approach however, a significantly weaker dependency of secondary loss on aspect ratio is visible.
Figure 6 shows the radial loss distribution for both cases for the maximum aspect ratio compared to the base configuration. Both curves feature the same increase in profile loss due to an increase in Reynolds number. However the secondary loss region for the repeating stage approach is smaller compared to the single row approach, while the base configuration clearly has the largest secondary loss region.
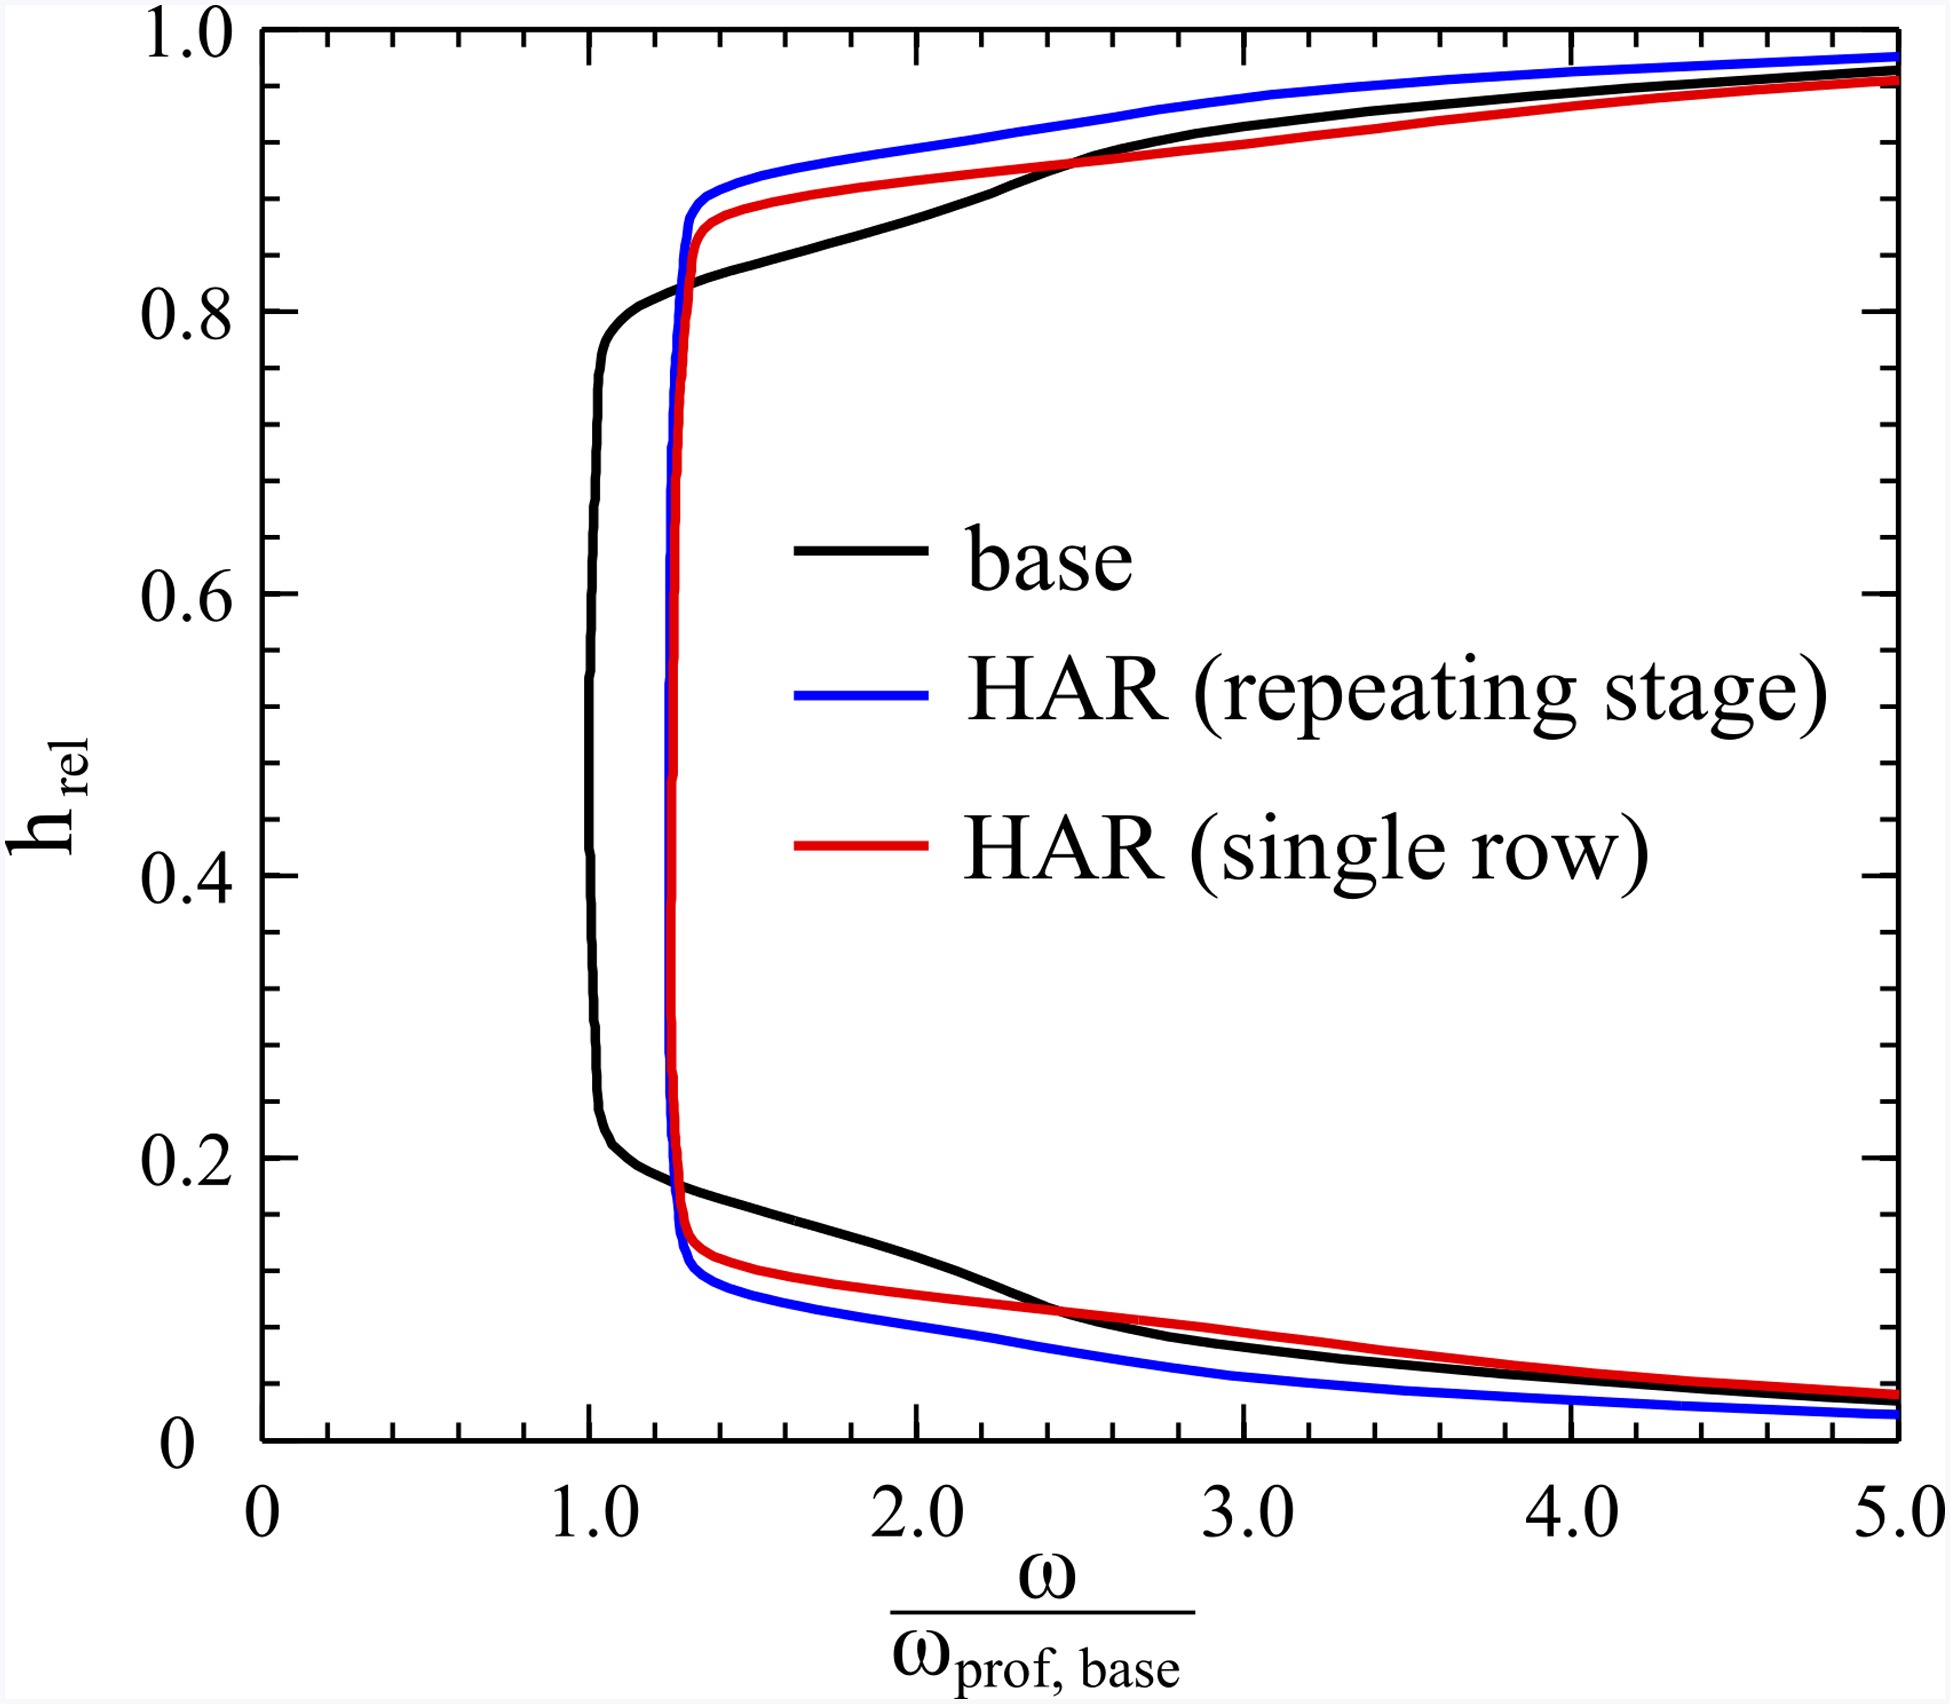
As the size of the secondary loss region scales with boundary layer thickness, these patterns can be explained. For the single row approach the same inlet boundary layer thickness is applied as for the base configuration. However the shorter blade chord leads to a smaller growth in boundary layer and thus the outlet and average thickness is smaller than that of the base configuration. Compared to the single row approach, the repeating stage approach additionally features a thinner inlet boundary layer, which once again reduces the average boundary layer thickness and thus secondary loss.
In order to quantitatively describe this effect, two relations need to be determined: (a) the relation between inlet and outlet boundary layer thickness and (b) the dependency of secondary loss on boundary layer thickness. Considering the first problem, a simultaneous variation of normalized inlet displacement thickness

The relation between inlet and outlet boundary layer thickness is independent from aspect ratio, which seems realistic, as boundary layer growth should be independent from blade height for sufficiently large aspect ratios. In addition, the relation is linear, which is not immediately evident. However this linear dependency has already been derived in Equation (21). For a fixed non-dimensional geometry and the assumptions already made, all parameters in this equation are independent from aspect ratio and can thus be handled as constants except for the inlet and outlet momentum thickness
with the constants A and B. The dependency between boundary layer thickness and secondary loss is evaluated in Figure 8. For this assessment the same calculations as in Figure 7 were considered. The figure shows, that for the considered cascade simulations, secondary loss seems to be almost proportional to displacement thickness to blade height ratio at row outlet. The slight offset between both curves in Figure 8 can be explained by the effect of Reynolds number on secondary loss. This effect is neglected as its impact on secondary loss is one order of magnitude smaller than the effect of boundary layer thickness.

The relation also seems to be independent from inlet boundary layer thickness yielding
Together with Equation (23) the relation
can be derived. Experimental investigations on turbine cascades (Shammaa, 1978) support this linear dependency between inlet boundary layer thickness and secondary loss.
For the special case of the repeating stage approach
For the geometry in this investigation, the constants A and B can be determined via Figure 7. Then Equation (26) can be evaluated for arbitrary values of boundary layer thickness and aspect ratio. The results are shown in Figure 9.

A strong dependency of secondary loss on incoming boundary layer thickness can be observed. For an incoming boundary layer thickness of zero, an increase in aspect ratio of 100% leads to a reduction in secondary loss of 50% (corresponding to the repeating stage approach). The same increase in aspect ratio reduces secondary loss by only 12% if
Considering the significant difference between both approaches, the question arises which approach to use best in what situation. The repeating stage approach neglects the fact, that the first compressor stages experience an inlet boundary layer that does not scale with the chord length, while it gives a good approximation for the rear stages. In reality, the first stages will have higher secondary loss, which leads to an underestimation of the total secondary loss. The single row approach gives a good approximation for the row considered, but it neglects downstream effects, such as the reduction of the next row's inlet boundary layer leading to an overestimation of secondary loss.
So, on the one hand a conservative estimation can be made using both approaches to obtain a minimum and maximum value for the possible change in secondary loss. On the other hand, depending on the situation, the better fitting approach can be selected. For a multistage compressor with a similar change in aspect ratio for all blades and vanes, the repeating stage approach would be suitable. If a single stage compressor is considered or a change in aspect ratio of a single blade row or stage in a multistage compressor, the single row approach should be preferred.
Part III: Numerical results for a compressor stage
So far the single row approach has been derived from analytical theory and numerical simulations based on a linear cascade geometry. Thus a transfer of the results to compressor stages with 3D blade design and rotor stator interaction is not necessarily possible. For this reason, both approaches are compared to CFD simulations of the compressor stage described above. The CFD setup of this stage has been validated against corresponding test rig data - see Peters (2019). CFD overestimates the absolute loss level of the test data. Eliminating a constant offset between CFD and measurement data, a difference in efficiency in the range of approximately 0.1% to 0.2% remains over the whole compressor map (from 80% to 100% rotational speed), which is in the order of magnitude of the relative measurement accuracy. Thus, the 3D CFD results of relative changes of secondary loss due to aspect ratio variations are regarded as trustworthy.
In this investigation, the aspect ratio of the rotor and stator row is increased separately by 100% relative to the corresponding base geometry. The change in secondary loss relative to the base geometry is then calculated and compared to both analytical approaches. For the single row approach, the boundary layer displacement thickness is determined from the CFD results at the row inlet plane based on the circumferentially averaged velocity profile. The integral results of this investigation for the hub and tip region of each row are depicted in Figure 10.
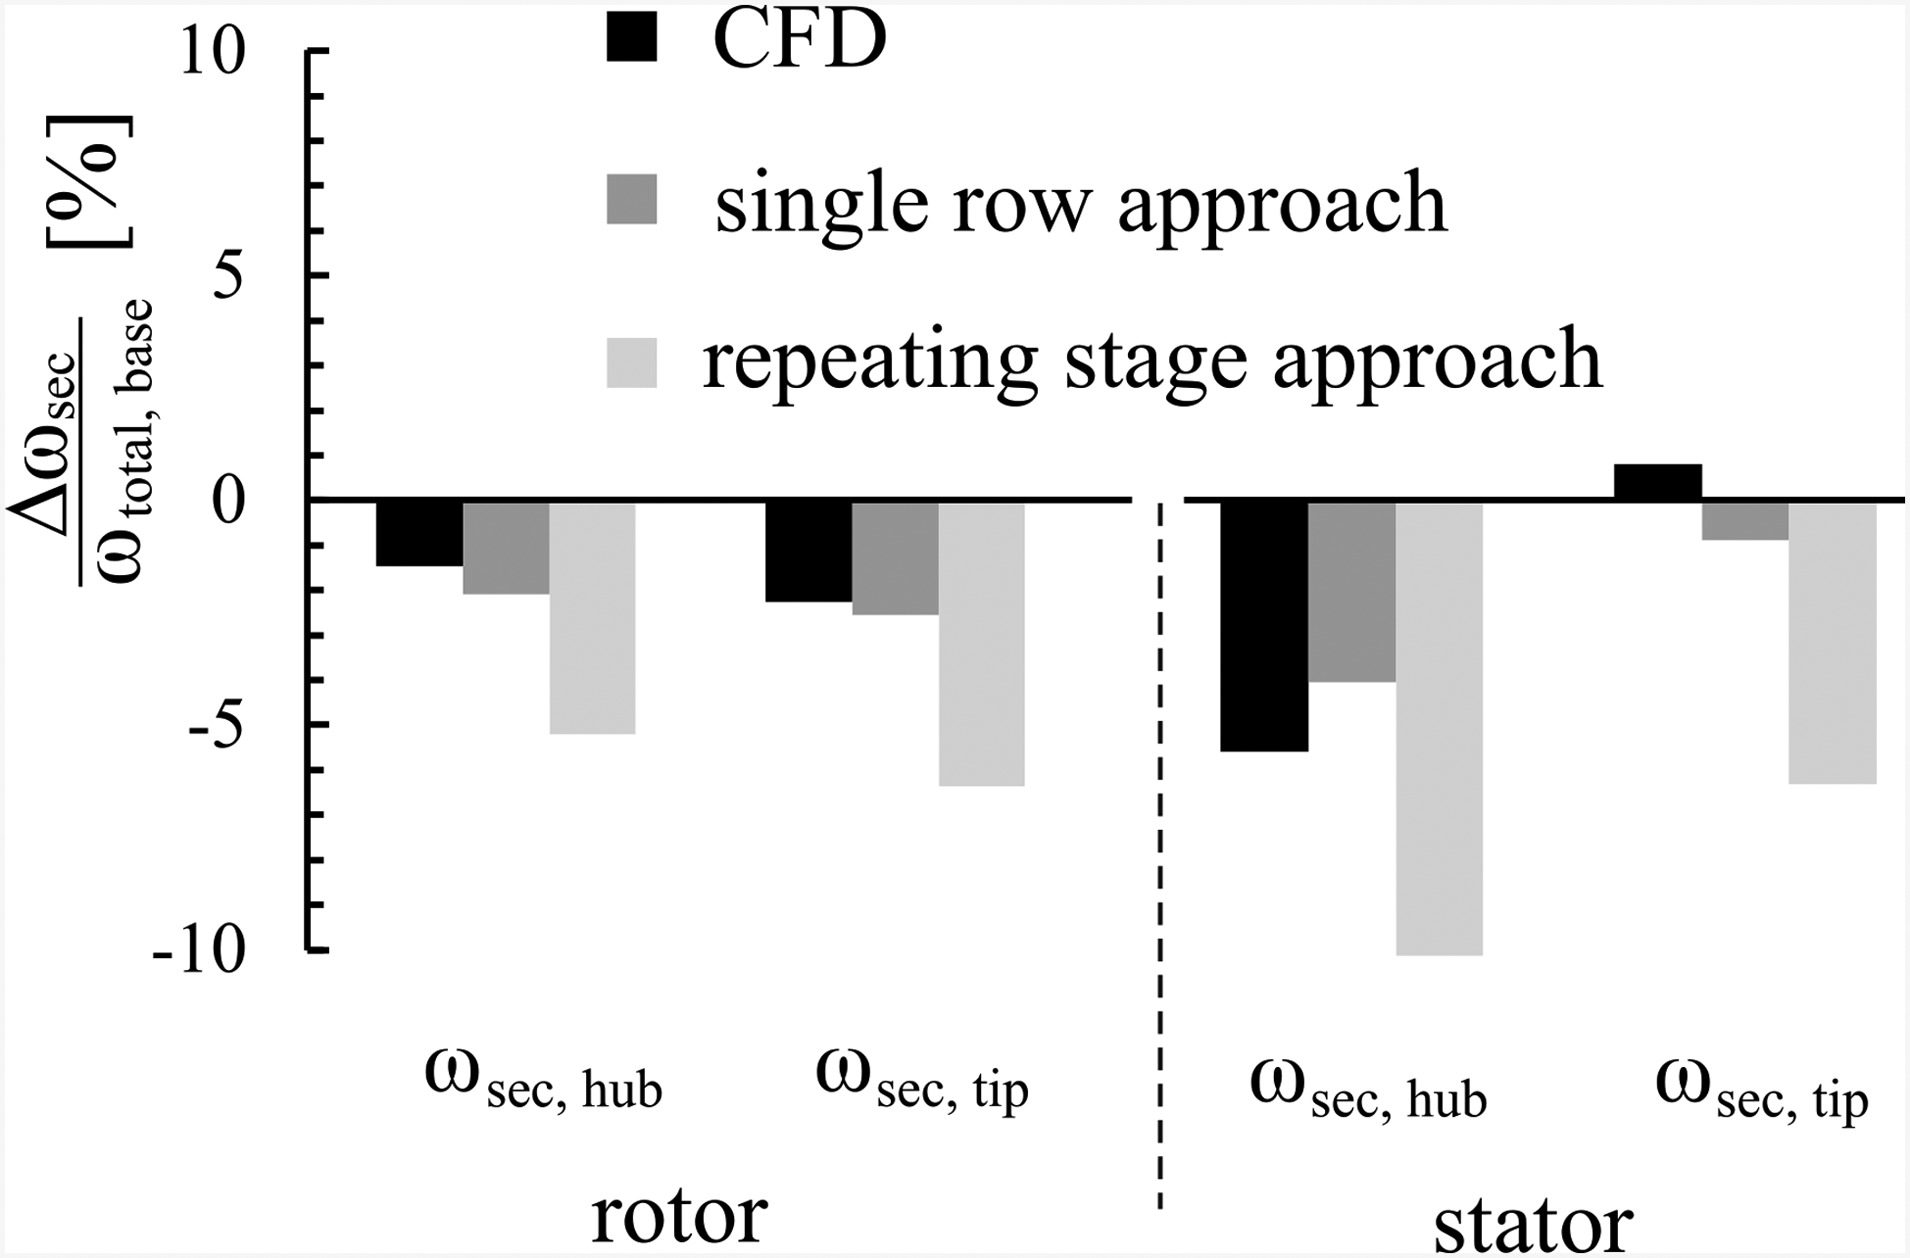
In general, the repeating stage approach shows significantly higher changes in secondary loss compared to CFD. This is not surprising, as the approach is not suitable for a change in aspect ratio of only one blade row. For the rotor, the single stage approach shows better agreement with the CFD results for both hub and tip section. However the change in secondary loss is also overestimated. This could be explained by fillet radius and endwall slope effects that are not incorporated in the approaches. The stator results cannot be explained so easily. While a similar trend can be observed at the hub, both approaches show a reduction in secondary loss at the tip but 3D CFD predicts an increase.
The radial loss distribution for the high aspect ratio stator and the corresponding base geometry is shown in Figure 11. While the secondary loss region at the hub shows the pattern already known from cascade simulations, the region at the tips shows higher loss for an increase in aspect ratio, while the radial extent of the loss region remains almost unchanged.

The tip region of the stator is dominated by wake mixing of the rotor tip clearance vortex. According to experimental investigations of Howard et al. (1994) and Dring and Joslyn (1986), the wake is reenergized by fluid from the pressure side of the stator passage flowing into the low pressure wake region. The total amount of exchanged high energy fluid is larger for a longer stator chord. As the rotor wake has the same depth for the base and the high aspect ratio stator, the latter can realize a weaker re-energisation of the rotor wake due to its shorter chord. The rotor wake remains deeper and thus secondary flow is stronger and secondary loss greater. Since the wake quantities are circumferentially averaged at the mixing plane position, the steady state simulations in this paper can only qualitatively capture this process.
While both analytical approaches cannot at all predict this effect, the single row approach reveals a (negative) impact in secondary loss close to 0 as the deep rotor wake leads to a large displacement thickness at the tip. In total for the stator the deviation to CFD is 16% for the single row and 240% for the repeating stage approach.
Conclusions
The most important loss mechanisms occurring at a variation of compressor blade aspect ratio have been reviewed. 3D CFD calculations of a compressor cascade have been performed in order to quantitatively determine the effect of each mechanism. Two dominating effects were discovered: the change of profile loss due to a variation in Reynolds number and the change of secondary loss due to a variation in endwall boundary layer thickness. The Reynolds number effect can be derived from existing analytical theory. 2D MISES and 3D CFD results show good agreement with this theory. The boundary layer effect strongly depends on the considered situation in which aspect ratio is to be varied. A uniform increase in aspect ratio in a multistage compressor leads to a greater reduction of secondary loss than the same change in aspect ratio of a single blade row. In literature only the first approach is usually used to estimate the effect of an aspect ratio change on compressor performance. In this paper a new approach for a single blade row is developed based on analytical theory and CFD results of a compressor cascade. While some 3D effects with relatively low quantitative impact cannot be captured, the model shows reasonably good agreement to CFD simulations of a compressor stage featuring a 3D blade design. For estimating high aspect ratio performance potential in the future, the single row approach can complement the repeating stage approach in order to estimate the range of a possible change in secondary loss more accurately. It delivers a more accurate estimation of the change in secondary loss compared to the repeating stage approach, when only a single blade row (in a multi or single stage environment) is considered.
Nomenclature
Greek letters
stagger angle
endwall slope angle
displacement thickness
angle between clearance flow and free stream
momentum thickness
circumferential coordinate
isentropic exponent
fluid density
solidity
shear stress
flow coefficient
enthalpie coefficient
loss coefficient (1)
Roman letters
blade chord length
dissipation coefficient (4)
blade force deficit (15)
enthalpy
blade height
relative height
shape factor
LE, TE
leading edge, trailing edge
blade number
pressure
Reynolds number
entropy
blade spacing
tip clearance
temperature
circumferential speed
free stream velocity
axial, normal-to-wall, radial coordinate