
Introduction
Over the past years, various design approaches have been developed to increase the efficiency and reduce losses due to secondary flows in turbomachines. According to (Sharma and Butler, 1987), up to 30%–50% of the total aerodynamic losses can be attributed to secondary flow losses. (Langston, 2001) provides a condensed review about secondary flows in turbomachines.
Endwall contouring is a promising approach for reducing and controlling the cross passage flow due to the pressure gradient. Studies by (Harvey et al., 1999) showed that the usage of non-axisymmetric endwall contouring is a powerful tool for reducing secondary flows with comparable effects to the lean and skew of blades. Cascade measurements confirmed a reduction of secondary losses by 30% (Hartland et al., 1999). Efficiency increases of 1.0% and 0.4% were also reported by (Schuepbach et al., 2008) and (Snedden et al., 2009), respectively.
For high-pressure turbines, the presence of cavity leakage flows for cooling the rotor disk and preventing hot gas ingestion is both omnipresent and required. Measurements by (Jenny et al., 2013) showed that the presence of purge flow increases the unsteadiness, and increases the rotor hub passage losses by 4% for each percent of purge flow injected. The beneficial effect of endwall contouring was also confirmed by (Regina et al., 2014). However, they found that endwall contouring increases the sensitivity of stage efficiency to purge flow injection, and eventually the beneficial impact is lost. Similar results were reported by (Schuepbach et al., 2010), where a reduction of 1.2% in efficiency per percent of purge injection was found.
The effect of purge flow and endwall contouring on heat transfer is mainly investigated in linear cascades. (Thrift et al., 2012) showed that a slot angle of 45° increases cooling effectiveness (compared to 90°) due to a different formation of the horseshoe vortex. An overall averaged reduction in Nusselt number for the endwall, both with and without purge flow, was reported by (Roy et al., 2017) for a contoured endwall due to secondary flow control. Further, (Lynch et al., 2010) reported a 3.1% reduction of averaged heat transfer for endwall contouring. However, a local increase was observed around the blade leading edge region (where the horseshoe vortex forms), and a decrease was observed at the suction side of the blade. The same authors reported that increased purge flow rates increased the heat transfer on the suction side due to strengthening of the vortical flow structures. An area-averaged increase of 8% was reported for heat transfer, and a 27% increase in cooling effectiveness.
Heat transfer measurements in rotating facilities are not widely available in open literature. Time resolved data was presented (among others) by (Dunn et al., 1984) and (Abhari et al., 1992) using thin film heat flux gauges. Endwall heat transfer measurements in a rotating facility were first presented by (Blair, 1992). Recently, (Lazzi Gazzini et al., 2017b) presented high-resolution heat transfer measurements using high-speed infrared thermography on the rotor endwall, taken in the same facility as used for this study. They found that the purge flow influences the Nusselt number distribution on the suction side of the rotor passage, up to approximately 30% axial extent. However, the measured differences were within the measurement uncertainty.
Previous studies have focused on endwall contouring within the rotor passage or purge flow injection separately. This work investigates an endwall design that is extending into the cavity; hence, strongly interacting with the purge flow. High resolution experimental data is presented from measurements in a rotating facility.
Methodology
Research facility and operating conditions
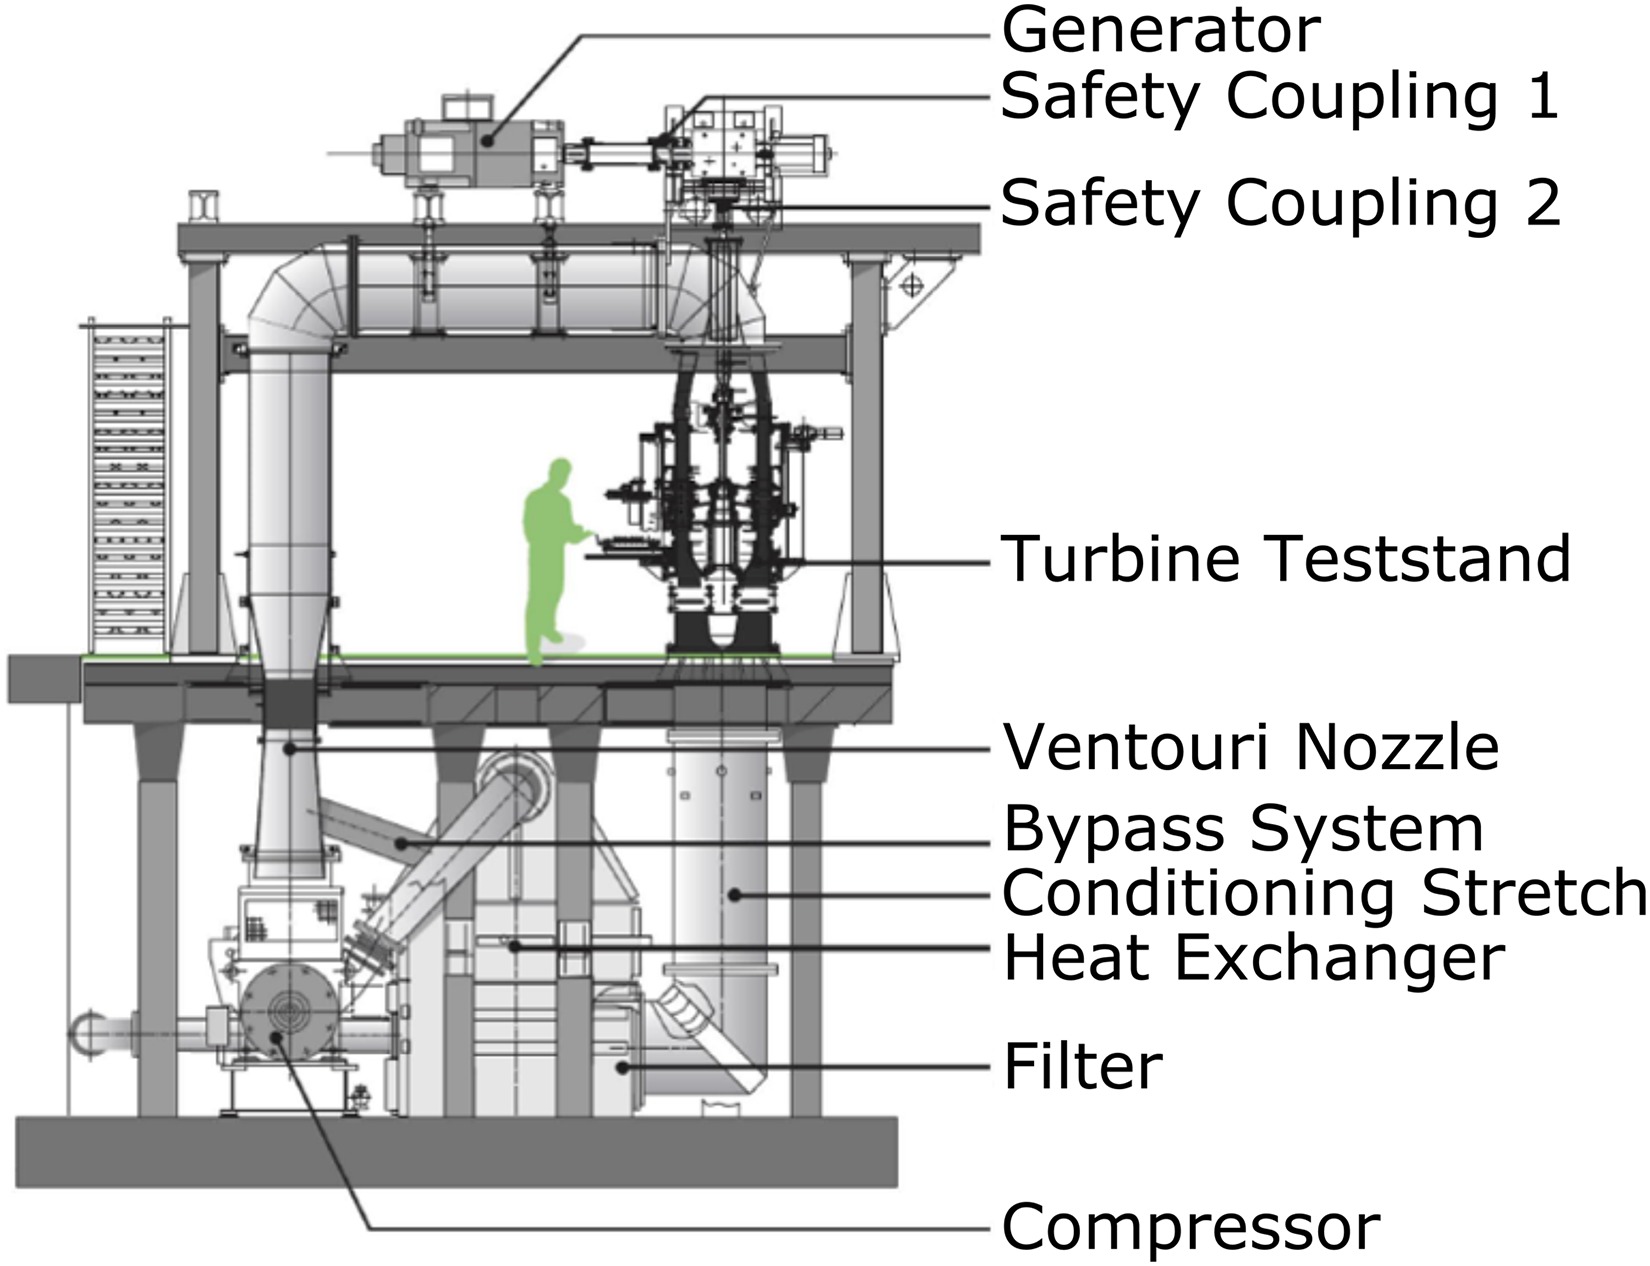
The data presented in this paper is based on experiments conducted in the axial turbine research facility LISA of the Laboratory for Energy Conversion (LEC) at ETH Zurich, as depicted in Figure 1. The test rig is a low-temperature, moderate-speed, continuously running rotating facility with non-dimensional parameter matching of real engine conditions. A radial compressor drives the air in the quasi-closed loop trough a two-stage water to air heat exchanger and a flow conditioning stretch before the test section. The turbine inlet total temperature is controlled within an accuracy of ±0.4 K. After the turbine section, the loop is open to the atmosphere, and the flow is then fed back through a calibrated Venturi nozzle for mass flow measurements to the compressor. The turbine shaft is connected to a reduction gearbox and a DC generator, breaking the turbine and controlling the rotational speed within an accuracy of ±0.02% (±0.5 rpm). The generated power is then fed back to the power grid. Because the air loop is open to the atmosphere, two rows of subsequent de-swirling vanes are installed to recover the static pressure back to ambient levels. A more detailed description of the rig and test section is given by (Behr et al., 2006).
The investigated turbine configuration is a 1.5-stage, high-pressure turbine representative design. All blade rows and endwalls are 3D optimised geometries for reduced aerodynamic losses. The blade count for stator 1, the rotor, and stator 2 are 36, 42, and 36, respectively.
Compressor air from the main loop is bypassed and used as cavity purge flow in the rotor upstream cavity. The air is extracted before the flow stretch, and injected through 10 tubes in the first stator vanes into the cavity below. The purge flow injection rate (IR) from the cavity into the main annulus is defined as follows:
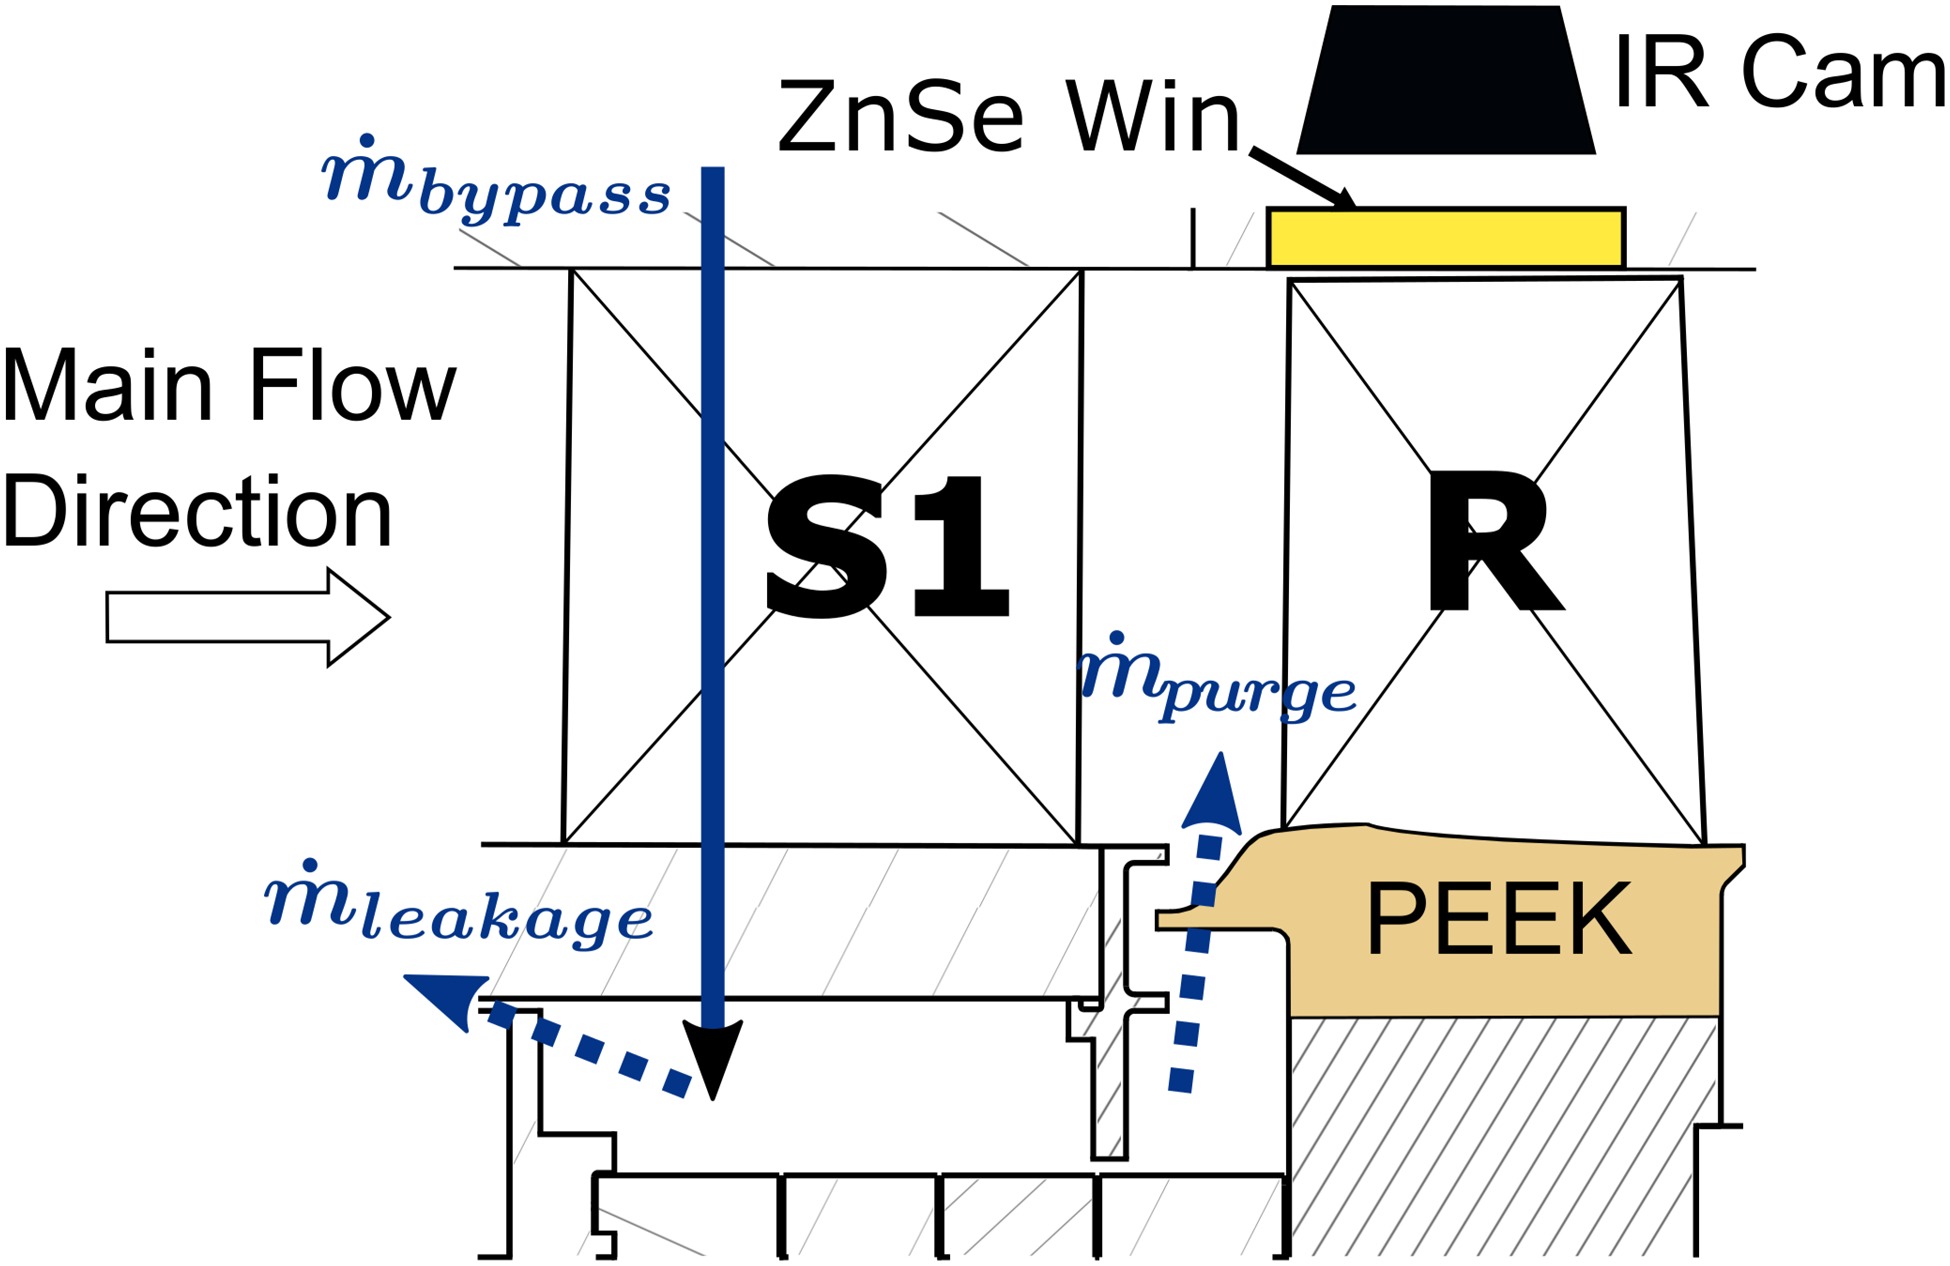
The purge air is calculated from the mass flow balance of extracted bypass flow and cavity sealing leakage flow through the drum, normalised by the total turbine mass flow (Figure 2). Both mass flow rates are measured with calibrated standard nozzles.
Figure 2.
Schematic cut of first stage with purge flow injection path and optical access to the rotor endwall.
For this study, the turbine was operated at the constant design pressure ratio of
Table 1.
Rig operation conditions.
Rotor endwall and cavity sealing geometry
The rotor upstream cavity sealing is an overlapping angle-wing type with 2.1%

The non-axisymmetric rotor hub endwall contouring is extended upstream into the rotor sealing arm arrangement. The contouring starts at −23%
Design intention of rotor endwall
The design of the rotor endwall contouring is based on a CFD optimisation cycle, which only uses the 1.5-stage aerodynamic efficiency as an optimisation target, with mass flow as a constrain. The design steps were as follows:
(1) The geometry was created using CAESES by Friendship Systems. The design of the non-axisymmetric endwall required only four parameters. Hill and trough were both specified in terms of amplitude, axial position, axial extent, and circumferential propagation relative to the camber line of the aerofoil. The endwall was optimised together with the aerofoil by adding these additional parameters to the converged optimisation setup of the blade.
(2) A block-structured mesh was generated with AutoGrid by Numeca. The domain included three blade rows and the rotor upstream cavity. To save computational cost, only the rotor blade row was re-meshed during the design optimisation. A butterfly topology was used to generate a fillet radius between the aerofoils and the non-axisymmetric endwall. The main gas path was modified such that it dipped into the cavity for two reasons: (a) The radius at the platform leading edge can be modelled correctly and (b) the non-conformal interface between cavity and rotor blade (RS-Interface) is shifted upstream, allowing for an extension of the endwall contouring (EWC) into the cavity (Figure 3a).
(3) The steady CFD simulations were conducted using TRACE, a code specifically developed for turbomachinery applications by the Institute of Propulsion Technology at DLR. Radial distributions of total quantities and static pressure from previous measurements served as inlet and outlet boundary conditions. The purge air was specified by a mass flow boundary condition of 0.8% of the main flow, and turbulence was modelled with the shear stress transport model (SST).
This toolchain was run with AutoOpti by DLR, using a generic algorithm for the generation of designs and a surrogate model based on kriging. In total, 89 design parameters were used for the aerofoil and endwall. The optimisation required approximately 1,500 members to converge. More details about the optimisation algorithm are given in (Aulich and Siller, 2011).
A difference in efficiency of 0.3 percentage points in 1.5-stage efficiency compared to flat endwall was achieved in the optimisation. However, as the aerofoil and endwall were optimised in combination, it was difficult to isolate the effect of the EWC itself. Compared to a flat endwall, a more uniform mass distribution of the purge over the circumference was observed. Further, the cross-passage migration of the pressure side horseshoe leg shifted downstream, and the passage vortex and suction side horseshoe vortex leg remain separated. This resulted in two small pressure loss cores, compared to one big loss core without contouring.
Experimental setup
Heat transfer measurements in the facility were performed with an infrared based technique described by (Lazzi Gazzini et al., 2017b) and (Laveau et al., 2014). A Flir IR SC7300L camera was used to record the temperature of the rotor endwall through infrared transparent Zinc-Selenide (ZnSe) windows installed in the rotor casing (Figure 2). The camera was mounted on a traversing system, allowing vertical adjustments and different camera angles using various angle shims to extend the optical coverage through the window.
A quasi iso-energetic setup was used to create controlled boundary conditions at the region of interest. Therefore, a custom-made thin film surface heating insert was manufactured and installed on the rotor. The insert was manufactured from PEEK (Polyether-ether-ketone), a thermally low conductive, high strength, base substrate, replicating the exact endwall geometry. Pt100 temperature sensors were installed in the insert 1.5 mm below the surface to account for conduction losses. The surface was coated with an 1.4 µm thick layer of Nickel using a direct chemical deposition technique on the PEEK, and pulsed laser ablation was used to create a serpentine like heating track with a uniform width of 1.9 mm. The heating track on the endwall is depicted in Figure 4a, also indicating the achieved heated area in red. The inherent need for track turns resulted in unheated areas close to the blade fillet, which were therefore excluded in the post-processing. For improved infrared signature and reduction of reflections, all rotor surfaces were painted with Nextel black velvet high emissivity paint (
Figure 4.
Endwall heating track design with indicated heated area (a) and energy balance of the setup (b).

Nonuniformities in heat flux creation were corrected during post-processing with the non-uniformity factor
The temperature sensor data acquisition and control of the heaters was accomplished with a rotating data acquisition system mounted on the rotor disk, controlled over a wireless connection (Mansour et al., 2015). The electrical power for the heating platforms (and for the rotor on-board data acquisition system) was transferred to the rotating system via a two-channel slip-ring. The heater supply current was measured and recorded externally.
Image processing
Measurements were performed for a specific stator 1 to rotor relative position. A shaft mounted optical triggering system was used to trigger the infrared camera acquisitions, and images were recorded with a sensor integration time of 10 µs to reduce the blurring due to platform movement. For extended optical coverage of the endwall, three different camera tilting angles were used (−4.5°, +4.5°, and +15°), and a sequence of 1,000 individually triggered images were recorded for each position. All frames of an image sequence were registered with respect to a reference, and only images within a ±1 pixel shift were considered for post-processing. Three different platform power levels, with an averaged produced heat flux between 3.3 and 9.2 kW/m², were used for the calculation of heat transfer quantities.
Silver infrared reference markers were used on the endwall to project the two dimensional image data on the three dimensional endwall geometry by geometrical transformation.
Heat transfer calculation
The convective heat flux is calculated from the overall energy balance (Equation 3) on the heater surface, schematically depicted in Figure 4b.
The electric heat flux is produced by Joule heating (Equation 4) and directly calculated from the supply voltage and current and corrected for local non-uniformity by the factor
The conduction losses were calculated for every heat flux step, and averaged over the passage for the energy balance.
For each heating step, the convective heat flux and wall temperature were obtained. A least square linear fitting was used to calculate the local heat transfer coefficient h and adiabatic wall temperature
Numerical setup
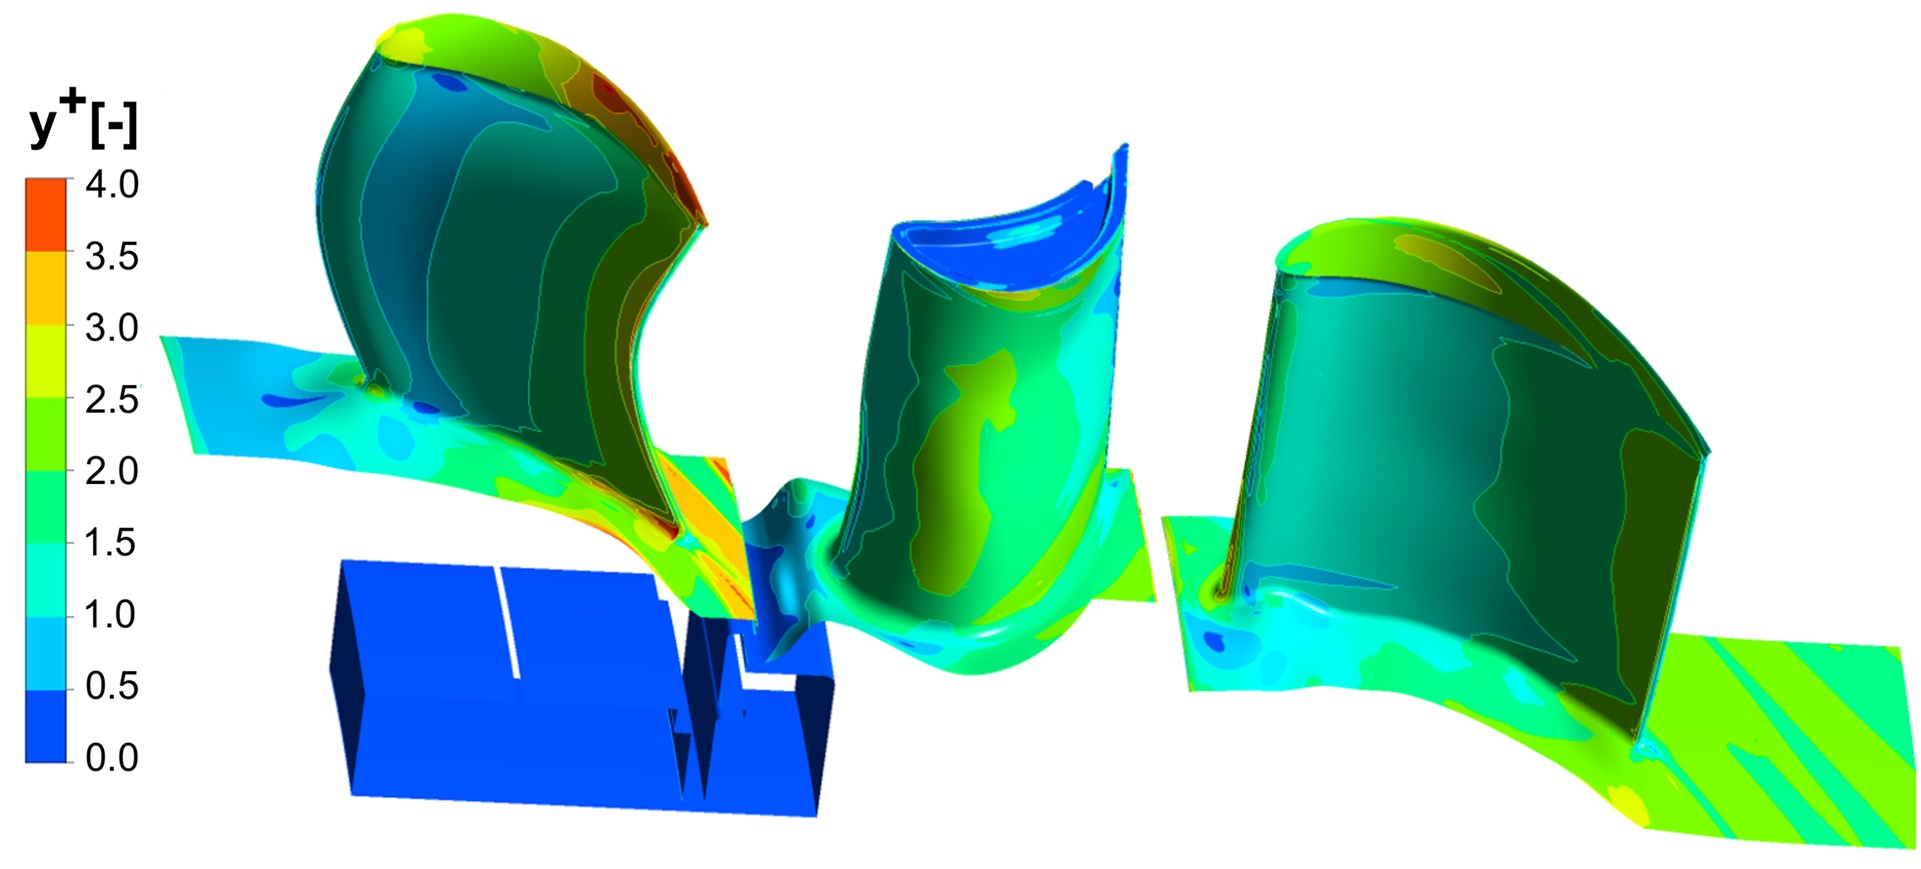
A multi-block structured mesh was generated for the 1.5 stage configuration (including cavities). The mesh consisted of approximately 11.6 million nodes, which provided a high-quality boundary layer resolution. The distribution of the non-dimensional wall distance
The numerical investigation was performed with the commercial solver ANSYS CFX version 17.0. Steady state computations were conducted using the high-resolution advection scheme and the total energy equation, including viscous work terms for compressible flow. Computations were performed with the SST turbulence model with the γ-θ transition model and mixing plane for the stator-rotor interface.
The surface roughness from the experiments was modelled using the roughness model supplied in CFX. Details about the model are described by (Lutum et al., 2015). Local roughness quantities were derived by profilometer measurements along the blade endwall. From this investigation, an equivalent sand grain roughness level of 20 µm was determined and applied for the current predictions. The spatial discretisation was quasi-second-order for all investigated cases.
Inlet profiles for total pressure, total temperature, and turbulence quantities were obtained from corresponding experiments. The purge flow boundary conditions were specified by a mass flow rate of IR = 0.8% and total temperature of 328 K. Numerical heat transfer results were determined from a set of computations consisting of an adiabatic and heat flux calculation for the same operating conditions.
Results and discussion
Distributions of heat transfer quantities are shown for the three different purge flow injection ratios, as defined in Table 1. The presented results were smoothed (to reduce noise and clarify the data) by using 30 passes of Tecplot 360 smoothing with a relaxation factor of 0.5.
The local heat transfer coefficient is represented as Nusselt number, as defined in Equation 8:
where
All flow reference quantities are mid-span circumferentially mass-averaged values at the rotor inlet. Values were taken from experimental probe measurements with the LEC in-house manufactured fast response aerodynamic probe (FRAP), performed during the same measurement campaign. More details on the FRAP probe and measurement techniques can be found in (Kupferschmied et al., 2000) and (Pfau et al., 2003).
Measurement uncertainty
The measurement uncertainty evaluation was performed by successively perturbing the input parameters in the post-processing routine as sequential perturbation, as described by (Moffat, 1988). The local distribution of the Nusselt number and non-dimensional adiabatic wall temperature uncertainty for the design case are presented in Figure 6.
Figure 6.
Uncertainty distributions of relative Nusselt number (a) and absolute adiabatic wall temperature (b).
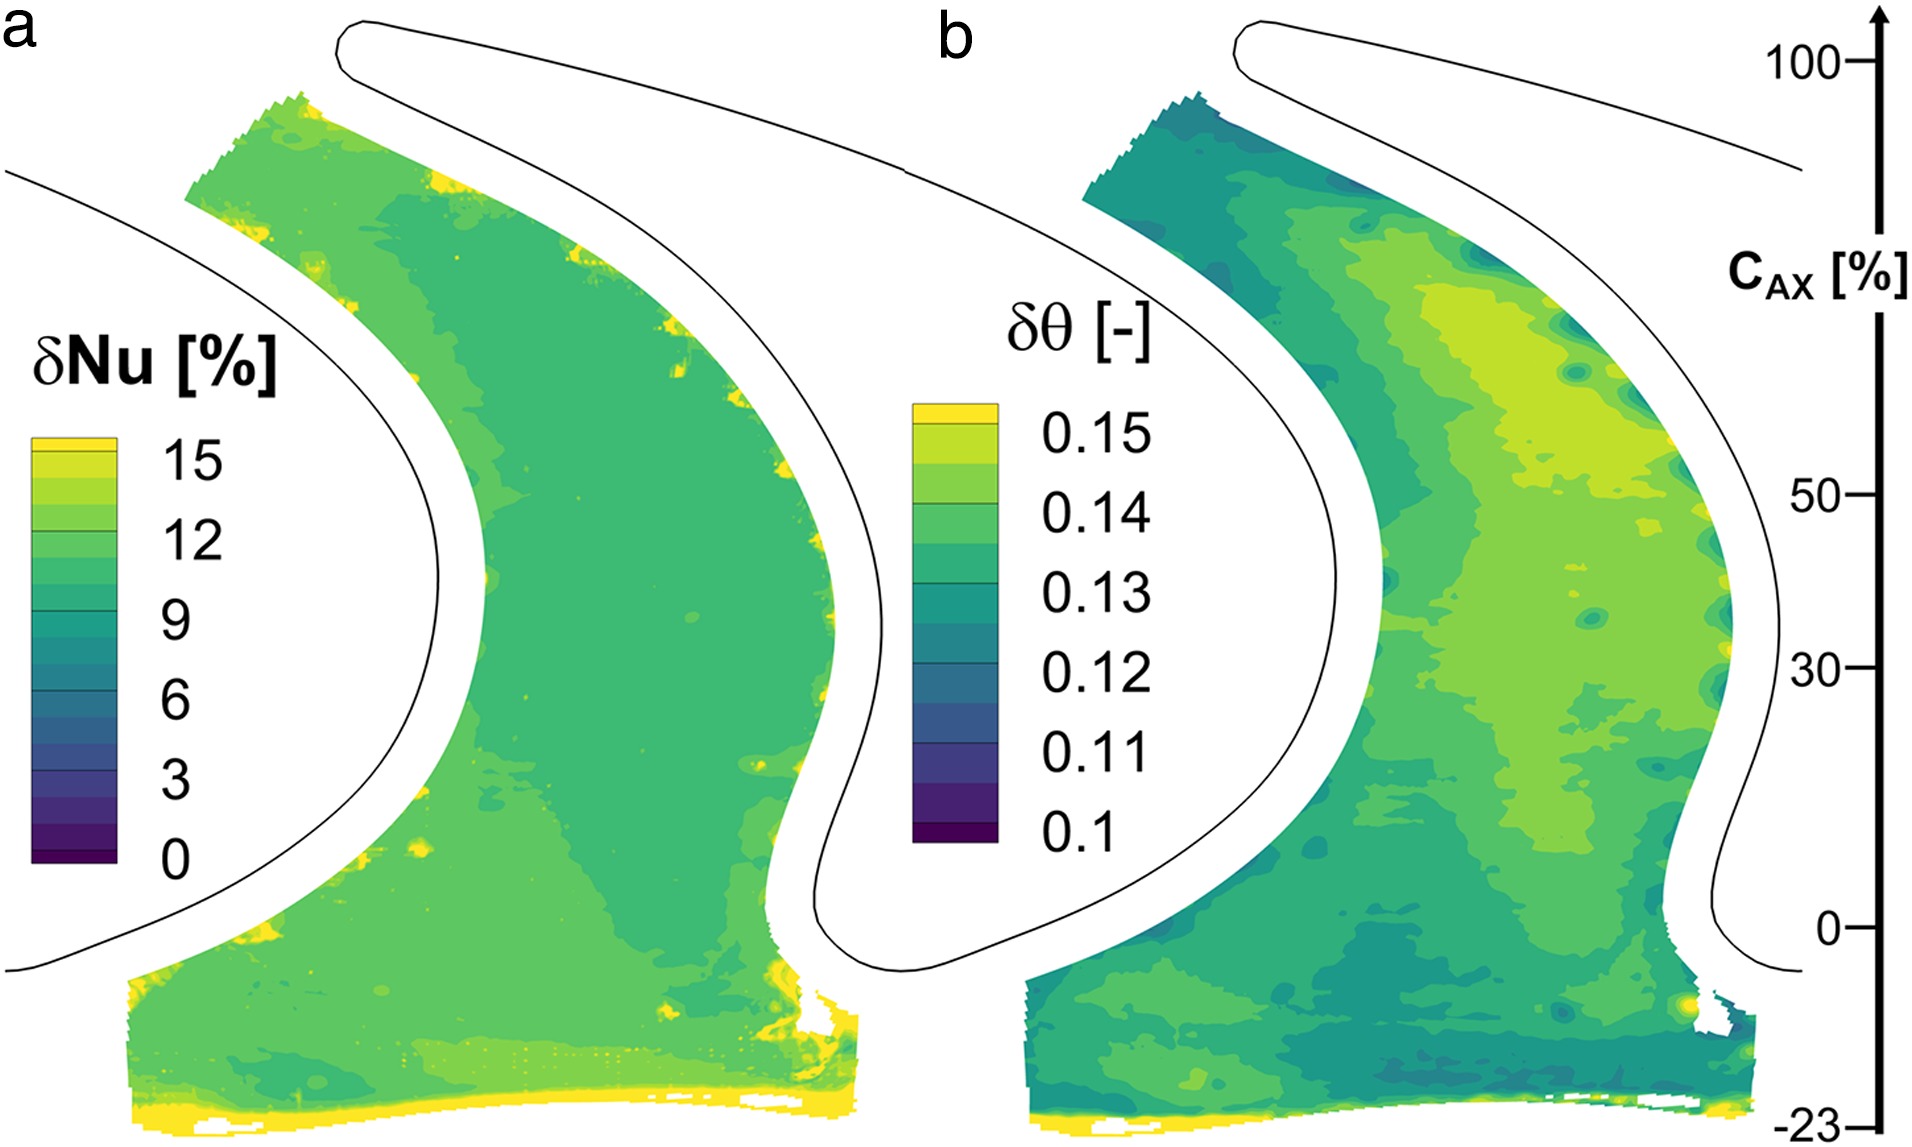
For the measurements presented, the platform averaged relative uncertainty was reported to be ±12.0% for the Nusselt number, and an absolute uncertainty of ±0.14 [-] for the non-dimensional adiabatic wall temperature. The main contributors to the Nusselt number uncertainty were the conductive losses (67.9%), the surface temperature (27.2%), and non-uniformity scaling factor
Endwall heat transfer for design point operation
Figure 7 shows the Nusselt number and adiabatic wall temperature distribution on the hub endwall for the design purge condition IR = 0.8%.
Figure 7.
Nusselt number (a) and adiabatic wall temperature (b) distributions for design purge flow rate (IR 0.8%).
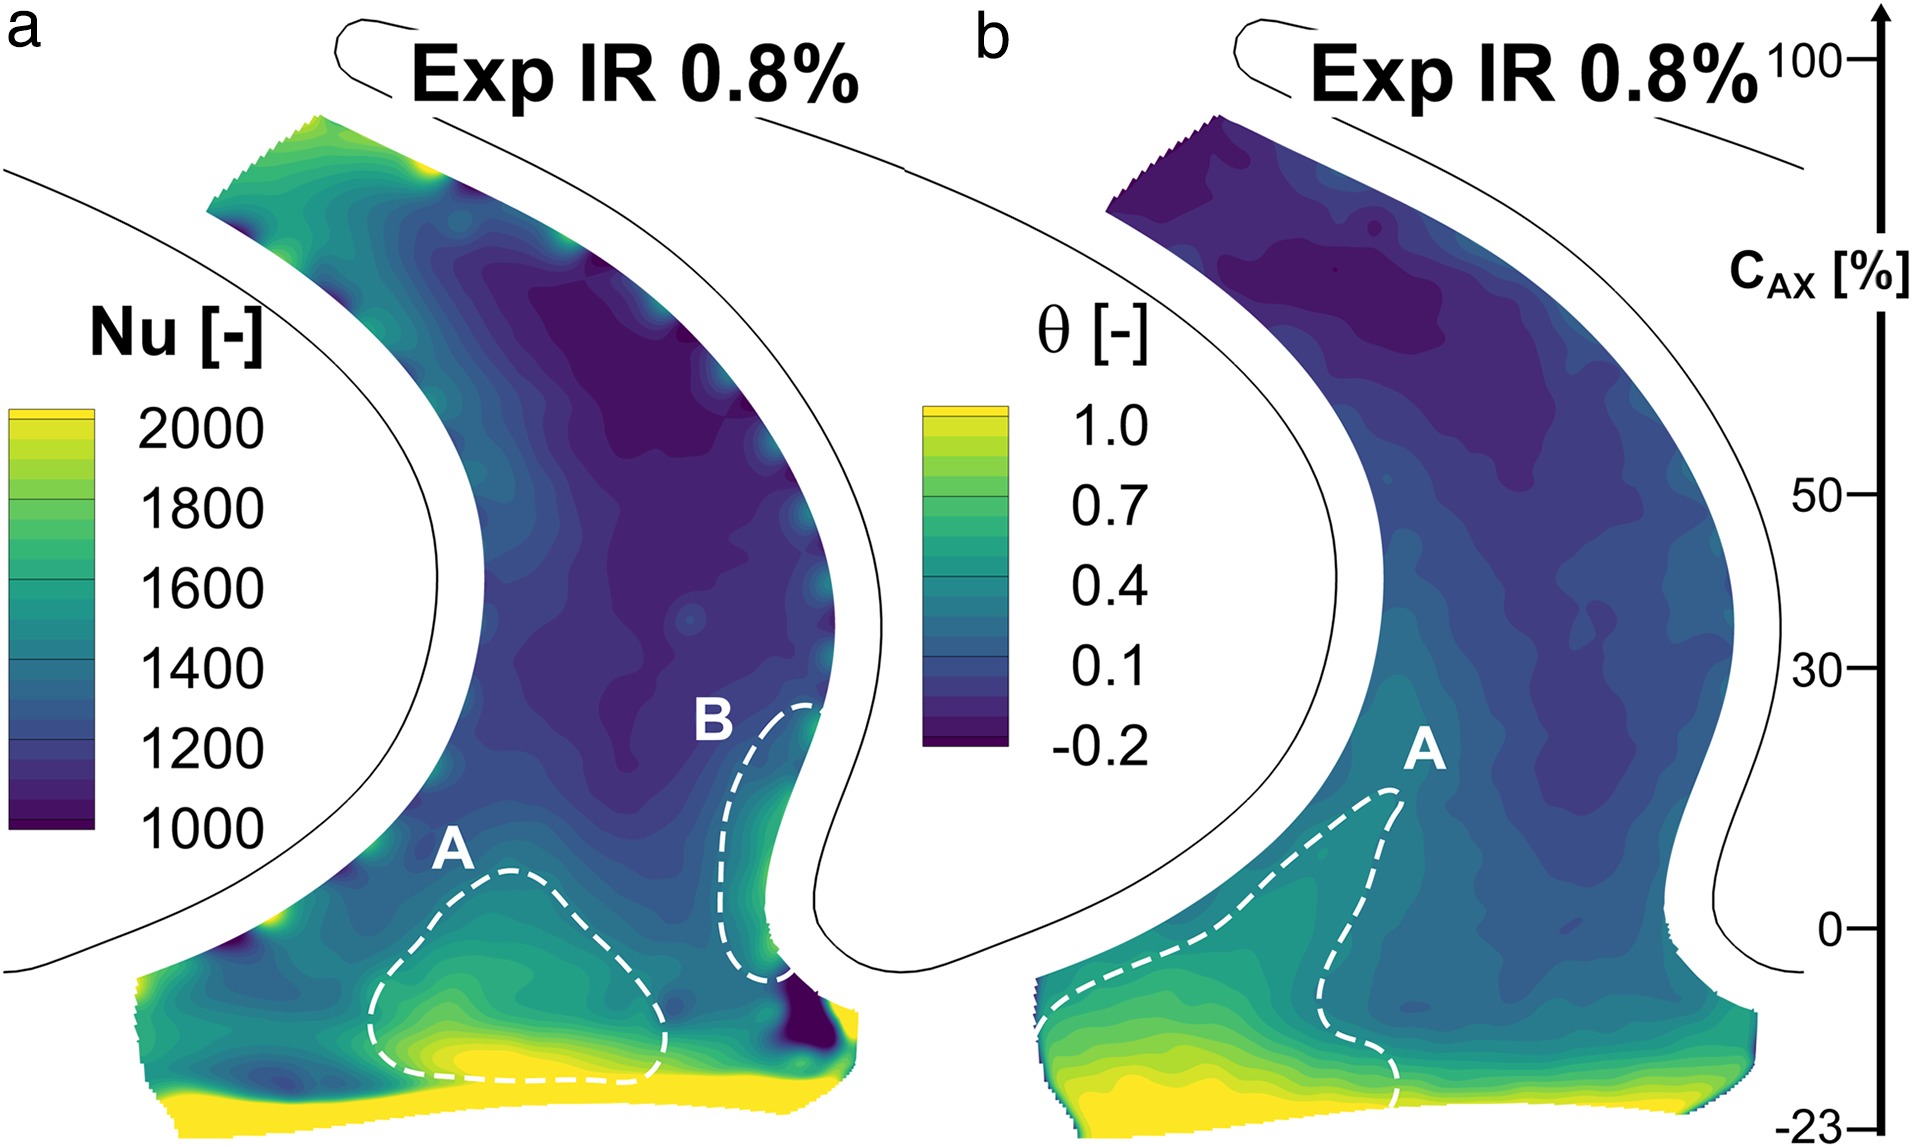
The small band of very high heat transfer at the beginning of the heated platform was consistent with results reported previously with a similar measurement setup (Lazzi Gazzini et al., 2017b; Laveau et al., 2013), and arose from the start of the thermal boundary layer. A wedge like region of increased heat transfer followed at the mid-passage position, extending to approximately 10%
The adiabatic wall temperature (Figure 7b) decreased through the rotor passage. This was expected, as the flow temperature decreases due to expansion and acceleration. As the bypass air was extracted upstream of the turbine, the injected purge flow had a higher temperature than the main flow. Therefore, contrary to cooling in real gas turbines, the purge flow was heating the endwall in this measurement setup. The very start of the platform exhibited the highest adiabatic wall temperature over the full pitch, with iso-lines closely following the shape of the endwall contouring (Figure 3b).
As this part of the endwall extends inside the cavity and below the hub radius of the upstream NGV, it can be concluded that the changes seen in this region are associated with purge flow interaction. The extent of increased adiabatic wall temperature at the suction side (up to the 30% axial chord) indicates that a high amount of hot purge air is entrained into the suction side horseshoe vortex, whereas the rapid decrease over the endwall hill indicates the presence of the main flow.
Comparison with CFD predictions
The predictions from CFD simulations were compared to the experimental data by means of the endwall resolved Nusselt number and non-dimensional adiabatic wall temperature distributions, and the lateral averaged data of these values.
The simulation results for design purge flow rate are depicted in Figure 8. The increase of local heat transfer at the endwall hill upstream of the leading edge was clearly captured by CFD, which was visible as a wedge-like region (region A). The effect of the horseshoe vortex at the pressure side leading edge (region B) was not as clearly visible in the experiments as in CFD. However, a local increase of heat transfer was observed in both cases. No influence of the horseshoe vortex on the suction side was visible for both the experiments and the simulation, as the effect was too close to the blade and therefore not covered by the heated surface of the measurement setup. The adiabatic wall temperature exhibited two locations of purge entrainment into the passage with increased temperature (regions A and B). The larger region following the side of the endwall, which extended up to 30%
Figure 8.
Distributions from CFD simulations of Nusselt number (a) and adiabatic wall temperature (b) for IR 0.8%.

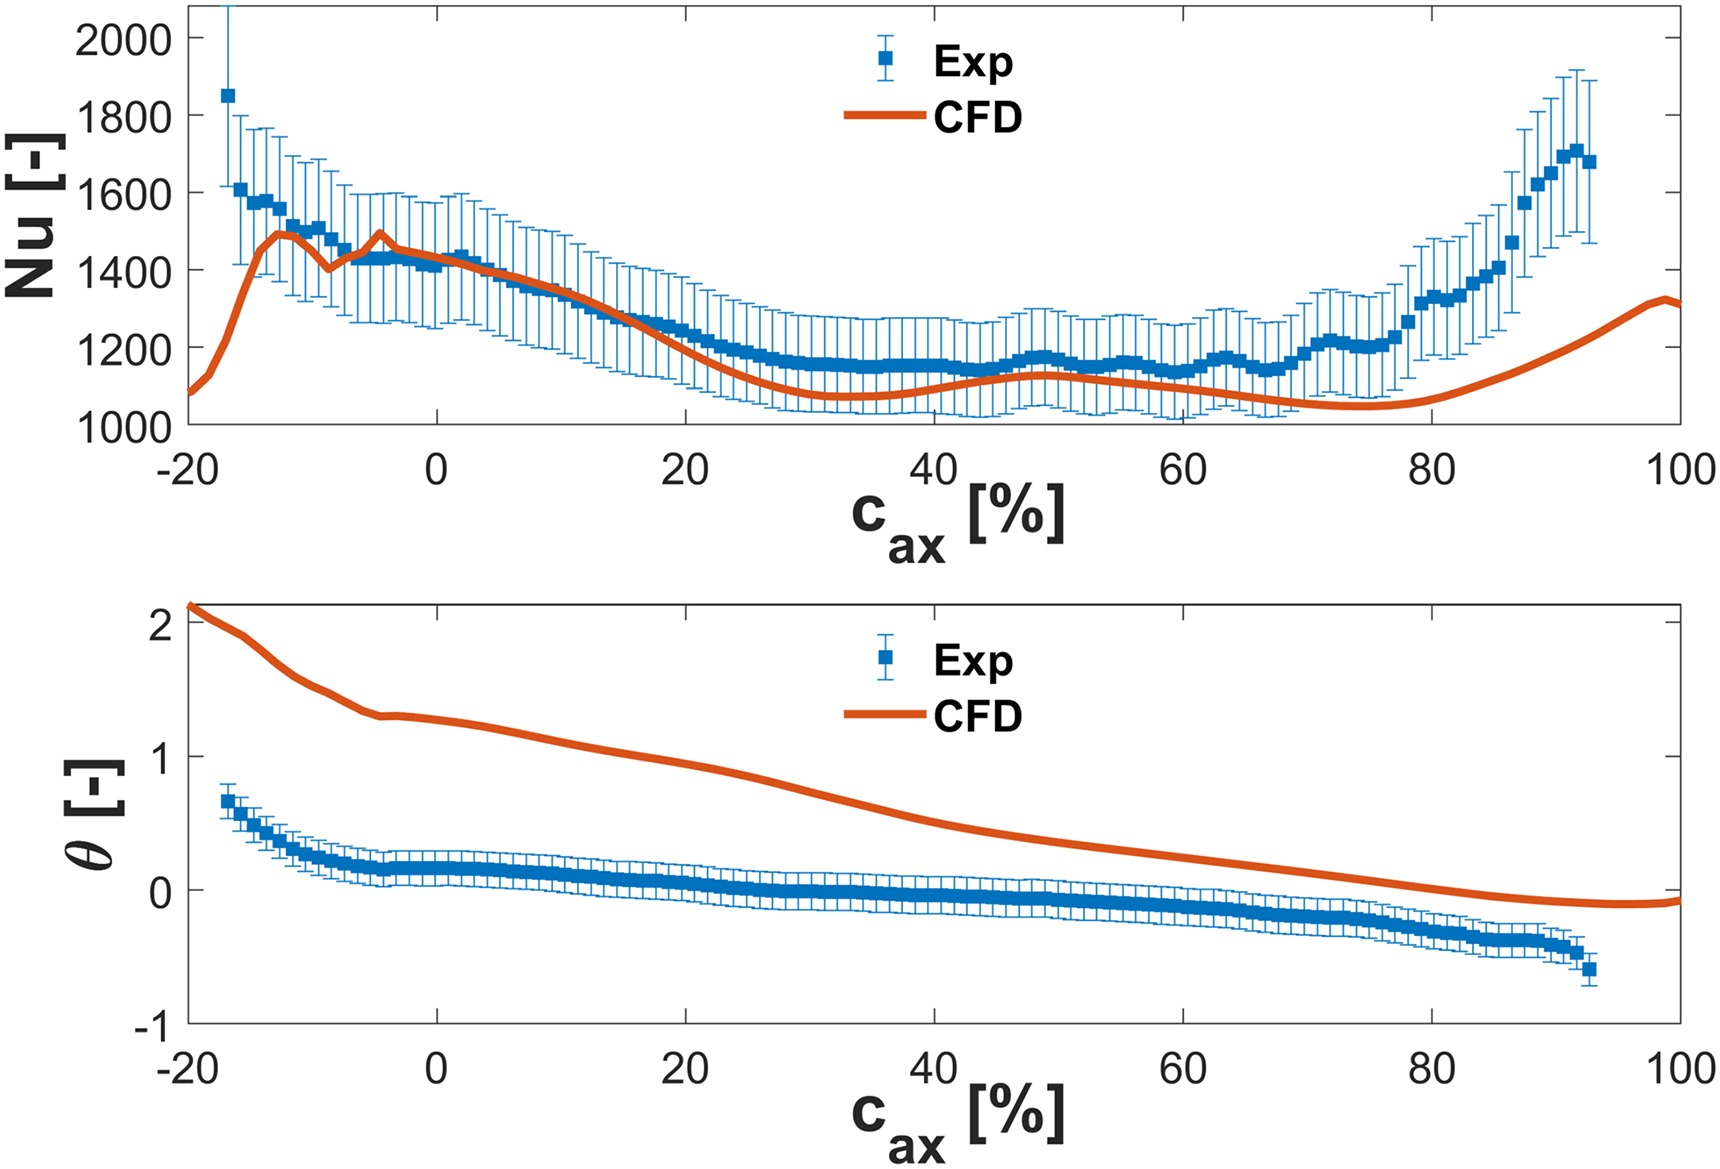
The lateral averaged results are compared in Figure 9. A general agreement within ±15% for the Nusselt number was found, although the high heat transfer region at the start of the heater was not captured by the simulations. Further, the increase through the passage was predicted to be less pronounced and start farther downstream than measured in the experiment. The trends for the adiabatic wall temperature were captured with a change in slope at approximately −5%
Purge flow influence on endwall heat transfer
The effect of purge flow on the endwall heat transfer was investigated with three different injection rates. Accordingly, the design point IR = 0.8% case was the reference, and compared against zero injection IR = 0.0% and a high injection rate IR = 1.2%. This was accomplished by means of the relative Nusselt number difference, defined as follows:
Figure 10 shows the relative difference to nominal injection for both off-design cases. A general observation reveals that for both cases, there were local changes in heat transfer up to ±20%. However, significant changes were only found within the first 30% of the axial chord length. This implies that after the passage cross flow hits the blade suction side, all the purge flow is mixed into the secondary flows and detached from the endwall.
Figure 10.
Relative difference in local Nusselt number for IR 0.0% (a) and IR 1.2% (b) compared to design point (IR 0.8%).

In the case of zero purge injection, a distinct increase of heat transfer was observed along the suction side, from the leading edge downstream to approximately
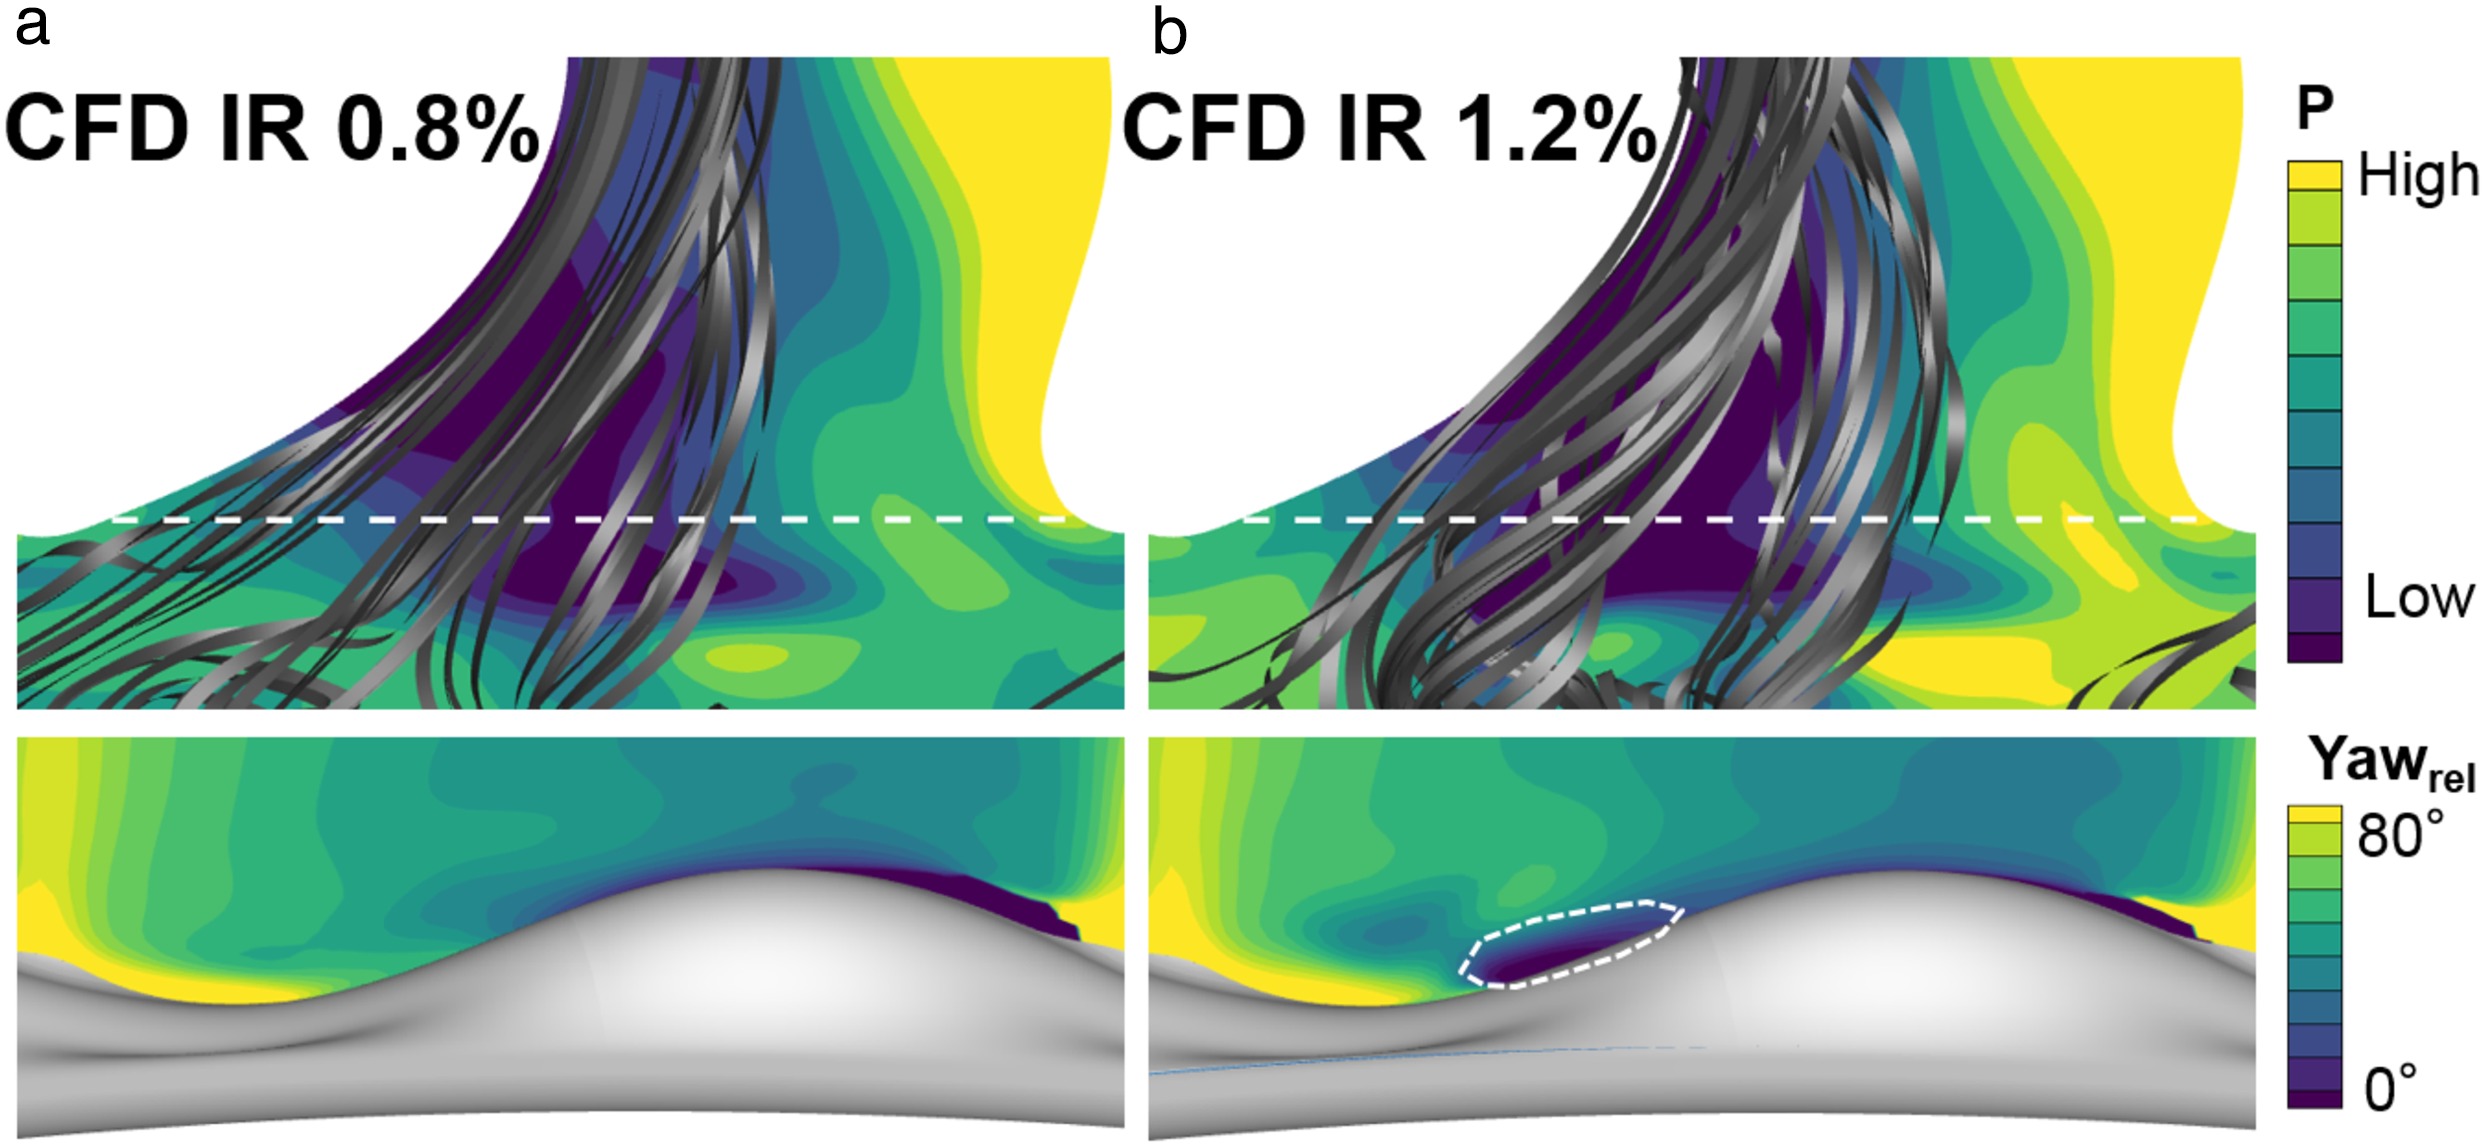
Figure 11.
Purge flow stream lines (top) and relative yaw angle contour (bottom) for IR 0.8% (a) and IR 1.2% (b).
For the case of high purge flow rate, increased heat transfer was observed in a triangular region extended up to 35% of the axial chord (where it ends at the blade suction side). The highest increase (up to 20%) was located in a band like region starting from the beginning of the platform along the side of the endwall hill.
For IR = 1.2%, the purge flow was entrained as two different jets into the main flow and endwall (Figure 11b). Due to the higher purge momentum, the relative yaw angle of the main flow was reduced by the purge, and enhanced mixing of both flows was present. Additionally, the purge entrainment at the suction side caused a mass redistribution and flow acceleration of the main flow in the region between the two purge jets.
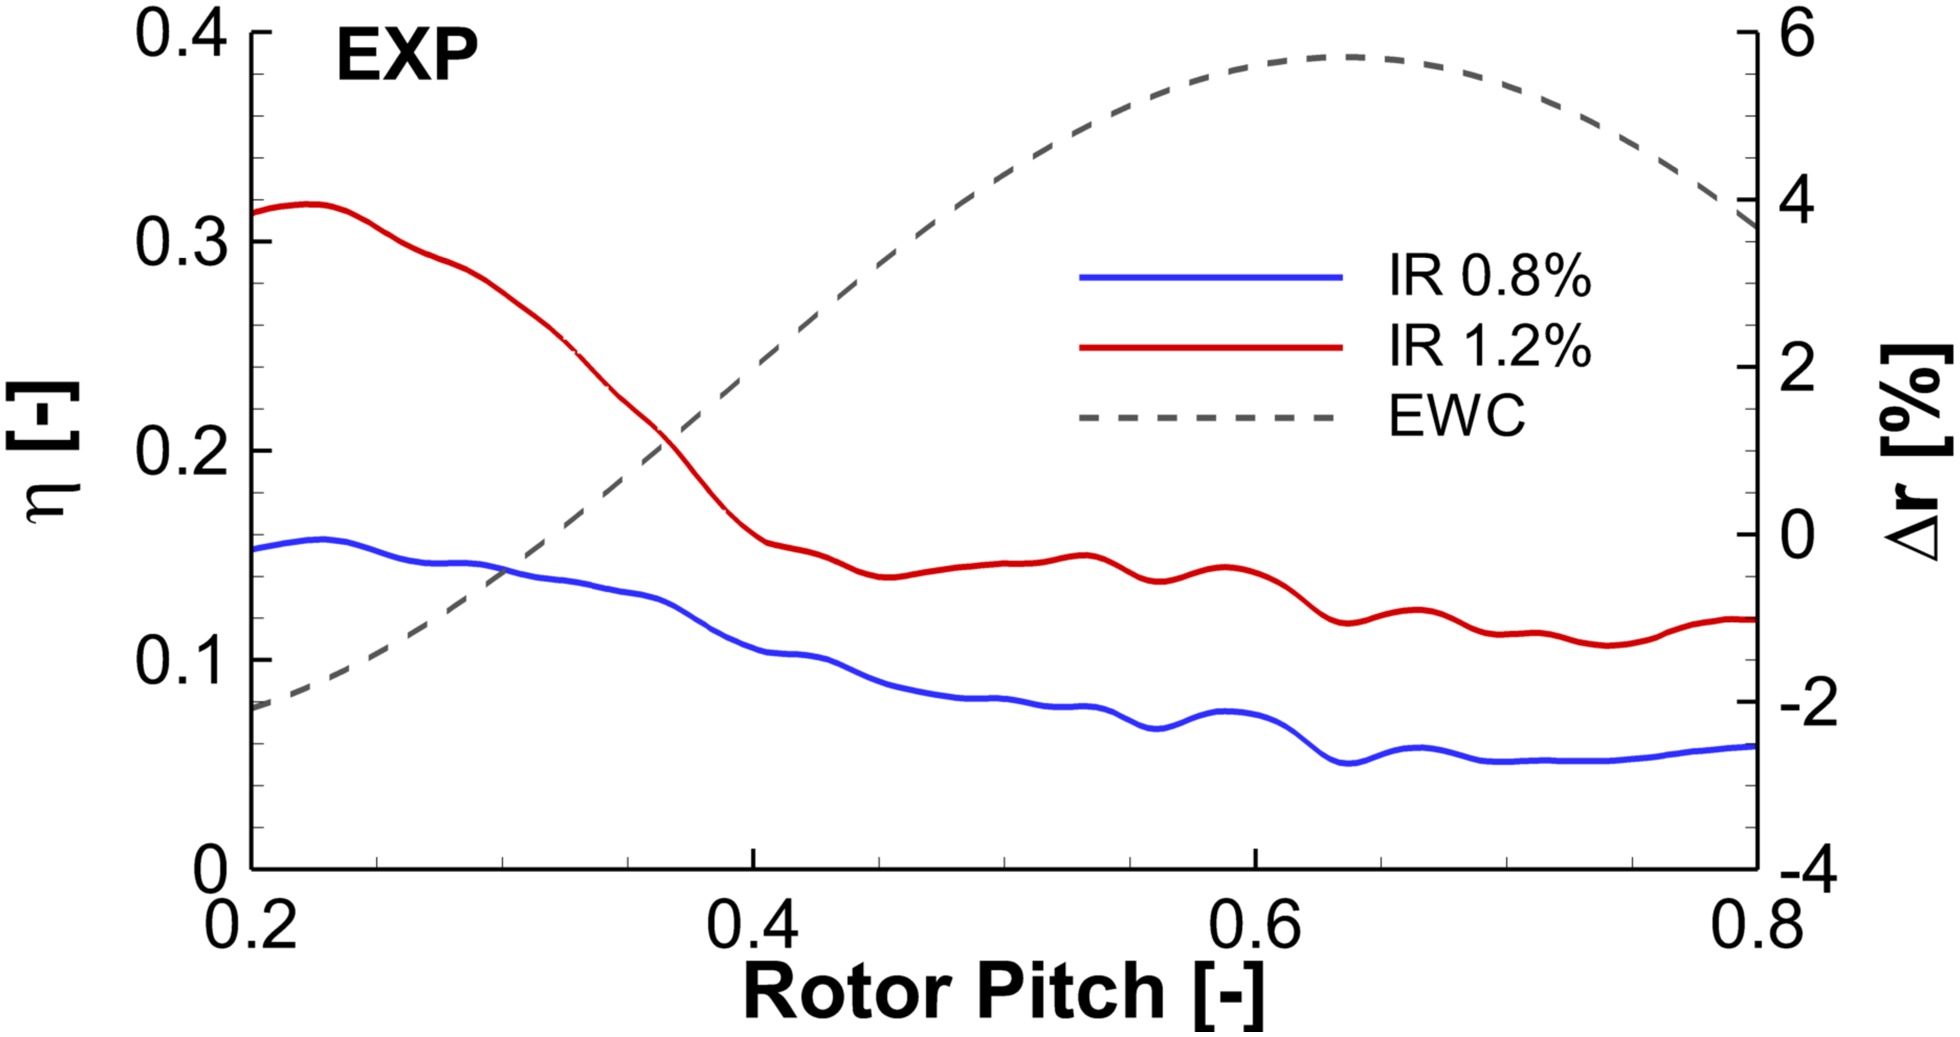
The influence of purge rate on the pitch wise distribution of absolute heat transfer over the passage is shown in Figure 12, for the indicated dashed line in Figure 10. Towards the suction side, both purge flow rates of 0.8% and 1.2% exhibited near identical levels of heat transfer, whereas the zero purge rate exhibited the same trend but with elevated levels. This reduction in heat transfer was caused by the local reduction in velocity due to the presence of low momentum purge air, as described previously. Between the 0.3 and 0.6 rotor pitches, the heat transfer was the highest modulated due to purge flow. Moreover, the most uniform circumferential heat transfer distribution on the endwall was achieved without purge flow. The modulation due to purge flow was similar for both injection ratios (0.8% and 1.2%), with different amplitudes at the maximum level leading to an increased non-uniformity over the pitch.
Figure 12.
Pitch-wise Nusselt number distribution and endwall radius change at indicated location in Figure 10.

Purge flow endwall cooling effectiveness
The cavity purge flow injection affected the main and secondary flow structures in the rotor passage, and provided cooling of the endwall due to the temperature difference compared to the main flow. This cooling was evaluated by means of a cooling effectiveness
The difference in adiabatic wall temperature was normalised by the difference between the purge flow temperature
Figure 13 shows the cooling effectiveness for both nominal and high purge rates for the rotor endwall. The general pattern is the same for both cases. The highest cooling effect was observed at the very beginning of the platform, where the endwall is below the nominal main flow hub radius (and therefore immersed in the purge flow). The other area of purge cooling started at the EWC trough and extended up to 30% of the axial chord along the blade suction side. This pattern was very similar to the regions of decreased heat transfer due to purge flow injection discussed in the previous section (Figure 9). This further confirms that the purge flow is predominantly swept to the suction side of the blade. This concentration is also illustrated in Figure 14, which shows the circumferential distribution for the same axial position indicated in Figure 13. The effectiveness is approximately twice as high at the suction side with the endwall trough compared to the rest of the pitch.
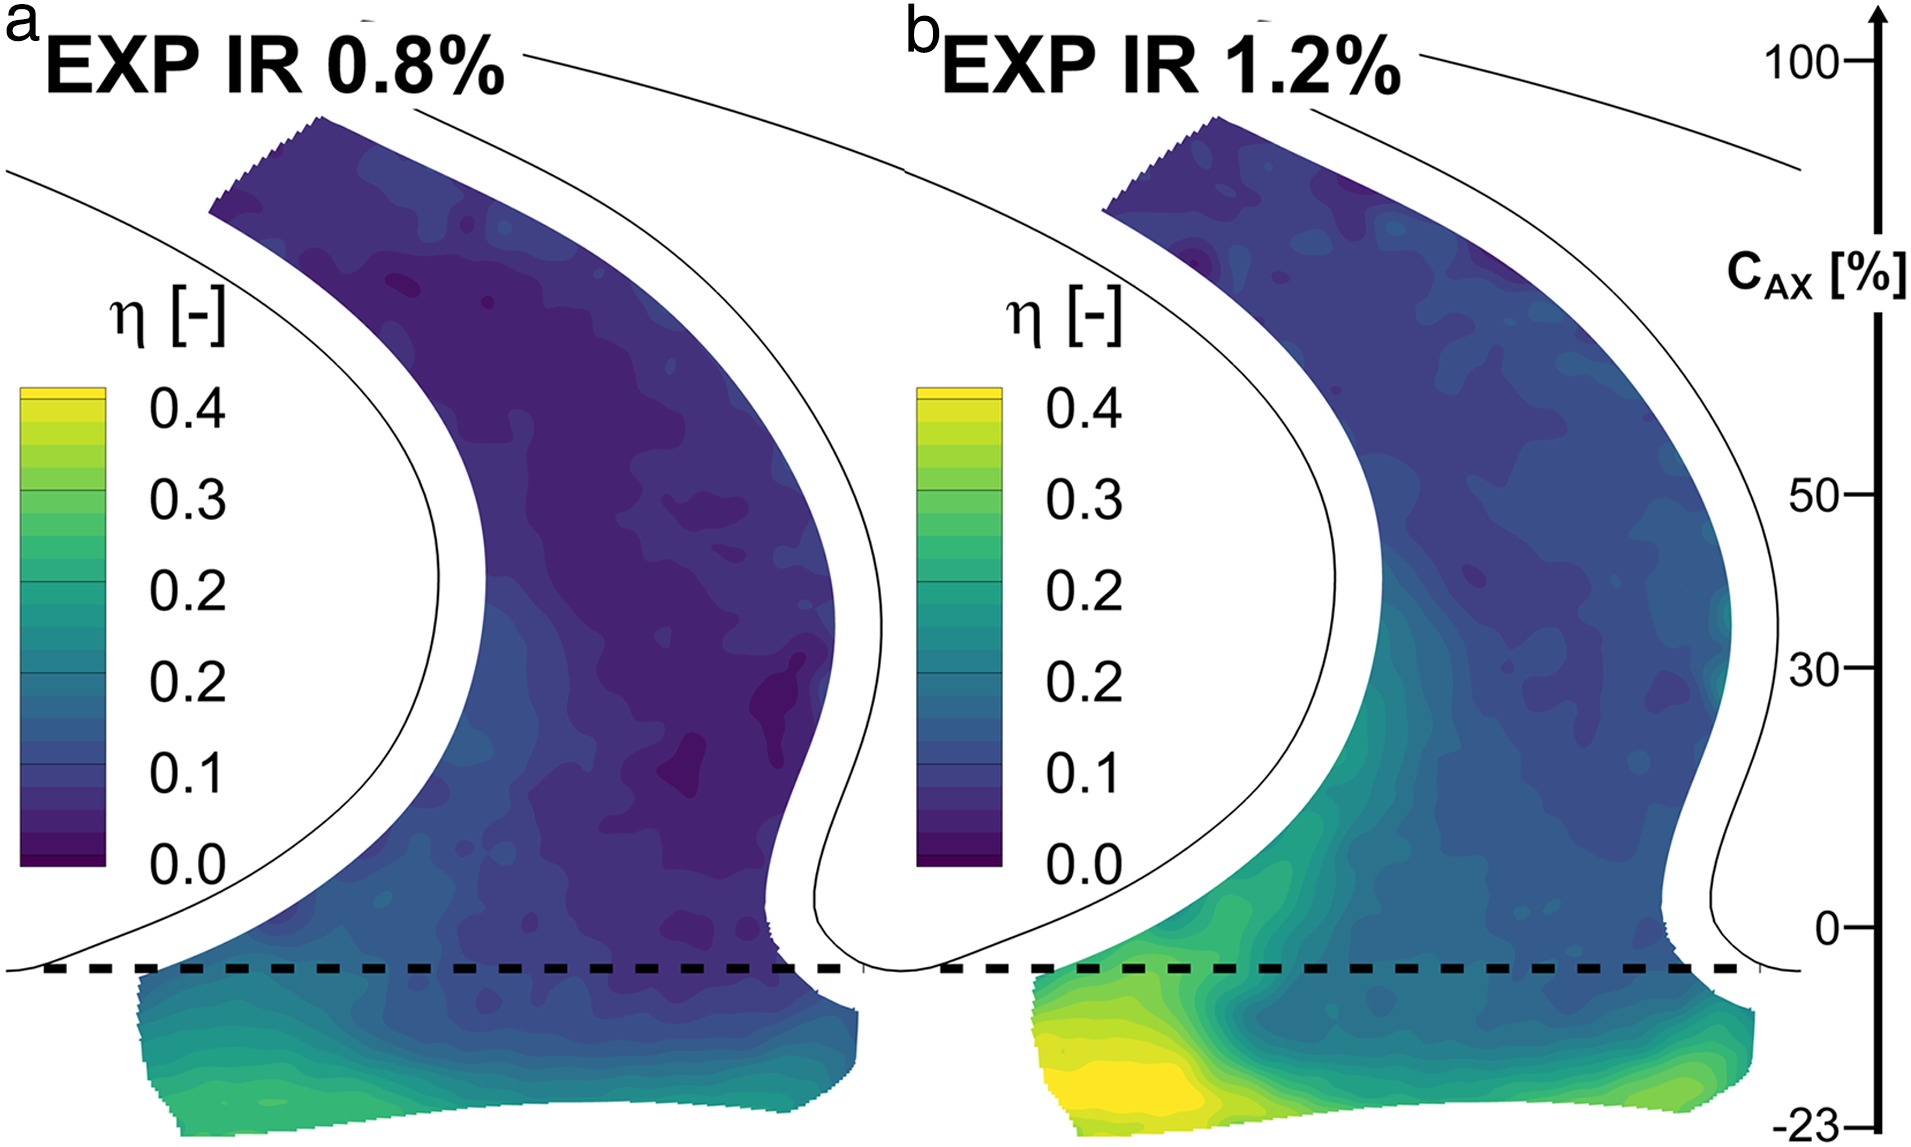
The cooling effectiveness was approximately 75% higher for the high injection case (over the design injection case), where the overall platform averaged effectiveness was 0.085 for IR = 0.8%, and 0.150 for IR = 1.2%.
Conclusions
This work presents high-resolution heat transfer measurement data of a high-pressure representative turbine rotor endwall (with advanced non-axisymmetric endwall contouring) in a rotating turbine facility. A new technique was used to manufacture a thin film quasi-iso-energetic heating surface on arbitrarily shaped surfaces, and to create controlled thermal boundary conditions for fast infrared surface temperature measurements. The influence of different purge flow injection rates on endwall heat transfer and cooling effectiveness was investigated for a contoured endwall extended into the disk cavity.
Predictions from CFD simulations were generally in good agreement with the experiments (within ±15%), and captured the relevant local heat transfer patterns.
Cavity extended non-axisymmetric endwall contouring was shown to significantly influence the local heat transfer rate from the beginning of the platform up to 30% of the axial blade chord. Compared to the design conditions, differences of up to 20% in local Nusselt number were observed for both the no purge and high purge flow rates. Endwall resolved CFD results were required to resolve these local changes, which were not captured by lateral averaged data.
Compared to the case without purge flow, the average cooling effectiveness was 0.085 and 0.150 for purge rates of 0.8% and 1.2%, respectively. Therefore, these results suggest that during the design and optimisation process of advanced geometries for highest aerodynamic efficiencies, auxiliary air injection should be included in addition to the local heat load.
Advanced tools for aerodynamic performance optimisation can lead to very specific designs. For the investigated geometry, the injection of purge flow beneficially reduces the heat transfer at the stress critical region of the blade root leading edge suction side. However, this benefit is counteracted by increased pitch-wise differences and non-uniformities over the platform. Owing to this sensitivity of heat transfer to the purge rate, off-design performance also needs to be considered during the design phase.
Nomenclature
Abbreviations
CFD
Computational Fluid Dynamics/Simulation
DLR
Deutsches Zentrum für Luft- und Raumfahrt
EWC
endwall contouring
EXP
Experimental
FRAP
fast response aerodynamic probe
IR
injection rate
LEC
Laboratory for Energy Conversion
NGV
nozzle guide vane/ stator 1
RS
Rotor-stator
SST
shear stress transport model
ZnSe
Zinc Selenide