
Introduction
Atmospheric particle contamination is the main cause of gas turbine compressor fouling. Micrometric particles suspended into the air, after being swallowed by the engine, may adhere to the compressor internal surfaces (Suman et al., 2017). Due to compressor fouling, the efficiency of the gas turbine decreases over time, leading to a reduction of the power output of the whole machine.
The fouling intensity is linked directly to the site location and the engine type. The site in which the engine operates determines the physical and chemical nature of the contaminants: moving from coastal to the desert, or from rural to industrialized areas, the contaminant types can change significantly, and with these, their interaction with the surfaces may be deeply affected. The reinforcement of the interaction between particles and surfaces is strongly influenced by environmental conditions. Due to high humidity levels, water can condense on the surfaces, especially on the first stages of the compressor, increasing the bonding strength between the particles and the substrate (Mezheritsky and Sudarev, 1990). As reported by Stalder (2001), contaminants composed by a mixture of wettable, water-soluble and water-insoluble materials, may become, over time, firmly adhered to the surfaces due to natural aging processes if the deposited layer is not immediately removed. The detrimental effect of fouling can also vary from engine to engine: generally, smaller gas turbines (in terms of output power) show a faster performance decay respect to greater engines in terms of mass flow rate, pressure ratio and efficiency reduction (Tarabrin et al., 1998).
Performance losses due to compressor fouling can be partially mitigated by providing frequent engine cleaning. The online washing technique, widely employed on heavy-duty gas turbines, allows the possibility to recover the engine performance without shutting the machine down. The engine washing is provided by injecting cleaning fluid during the operation using a set of nozzles installed at the inlet bell-mouth of the compressor. To achieve the best results in terms of cleaning efficiency and performance recovery, the washing operations are usually provided with a daily frequency (Schneider et al., 2010). Moreover, in stationary applications, the presence of a set of filters, which usually stop contaminants larger than 2 µm, helps to reduce the fouling rate (Wilcox et al., 2010). Aeronautic engines, due to the absence of filters, are more prone to ingest huge amounts of contaminants, especially in ground operations. As pointed by Asplund (1998), the taxiway before departures, and the use of de-icing products increase the fouling rate of these machines. In the first case, compressor fouling is caused by the ingestion of exhaust gases produced by other engines which operate in idle condition (where the un-burned emission is higher) and dust particles naturally present at low altitudes. In the second case, the deposit build-up is mainly due to the glycol mist injected into the engine. Besides, the absence of a compressor cleaning device mounted permanently on aeronautic engines makes washing operations more challenging to schedule respect to those provided on heavy-duty gas turbines.
The analysis of the type and concentration of the swallowed contaminants, which depend on the specific site location and the operative conditions of the engine, can give an idea of the most appropriate washing regime. In light of this, a lot of attempts and on-field investigations have been made to optimize the washing techniques and to improve the cleaning devices to increase cleaning efficiency and reduce water consumption (Mund and Pilidis, 2006). This on-field research generated, over the years, a significant number of patents that concern washing procedures, cleaning device set-up, nozzle configurations, and design parameters. Despite this, operative parameters such as the droplet diameter and the water-to-air ratio have been highlighted as the most critical aspects to be optimized when washing operations are provided.
Syverud and Bakken (2007) investigated the effect on the washing effectiveness of different droplet sizes (from 25 µm to 200 µm), and cleaner mass flow rates (0.4% to 3.0% of the water-to-air ratio) during the cleaning operation of a GE J85-13 aero-derivative engine fouled with saltwater. The Authors concluded that higher mass flow rates (up to 3% of the water-to-air ratio) and coarser droplets (up to 200 µm) represent the most effective combination to achieve the best performance recovery effects and to prevent debris re-deposition in the last stages of the compressor unit. Nevertheless, these parameters, which give the best results in terms of cleaning, are in contrast with customer requests of less water consumption and avoidance of erosion and overall safety issues, which would require low values of the air-to-water ratio and small droplet diameters.
One of the critical parameters for an optimal compressor washing operation is the cleaner fluid. The main characteristic of a cleaner is the presence of surfactant agents, which are usually organic compounds that lower the surface tension of the solution. This mechanism, which leads to the wetting, the penetration, and the dispersion of the deposits, cannot be carried out employing water only. The formation of foam is essential to the degree of effectiveness of the cleaner. The choice of surfactants in an aqueous solution can be used to optimise the elasticity of foam and its resistance to drainage to suit its desired application (Abbott, 2015).
Beyond the cleaning aspect, mandatory aspects for a reliable compressor cleaner are related to human and environmental safety. Commercial cleaners, especially those produced in the early 1980s, contain aromatic hydrocarbon chains that, despite being effective for deposit removal (Kolkman, 1993), are thought to be dangerous for living species if released into the environment. Stringent requirements were introduced by the Oslo and Paris Commission (OSPAR) in 1998 to prevent the discharge of pollutants or substances harmful for the ecosystem into the North Sea region. This example of progress towards using the most environmentally friendly chemicals for a particular application challenged the compressor cleaning industry to modify the cleaner formulas by removing dangerous compounds, without affecting the cleaning efficiency.
Aim of this work
To quantify the washing effectiveness of a new compressor-cleaner environmentally-safe formula, developed specifically to remove soot deposits from the compressor internal parts, experimental tests have been provided on the multistage test compressor of the Allison 250 C18 engine. The compressor unit has been fouled, by injecting a precise amount of contaminants under controlled conditions, and then washed. The fouled and the washed conditions of the compressor internal parts (rotor blades and stator vanes) have been detected through a photographic report and then compared employing an image-analysis tool. This procedure allowed the quantitative estimation, in terms of residual patterns on the surfaces, of the washing effectiveness of the cleaner. To compare the surface quality resulting from the use of such a cleaner, the analysis has been repeated employing demineralized water, considered in the present study as a reference point.
Methodology
In the following section, the methodology used in the present investigation is explained in detail: in the first part, a detailed description of the test facility is provided while the second part is devoted to the explanation of the test conditions, techniques, and materials used in this work.
Test bench
The experimental campaign has been carried out on the rotating test facility located in the Fluid Machinery Laboratory of the University of Ferrara. The test facility mounts the multistage test compressor of the Allison 250 C18 engine (Detroit Diesel Allison, 1975) depicted in Figure 1. The machine has an inlet diameter of 0.104 m, and it is equipped with a fixed inlet guide vane. The compressor has six axial stages and one centrifugal stage. On the axial part, in correspondence of the 5th stage, a bleed valve is located. In the present application, the bleed valve is closed to allow the measurement of pressure and temperature in that zone.
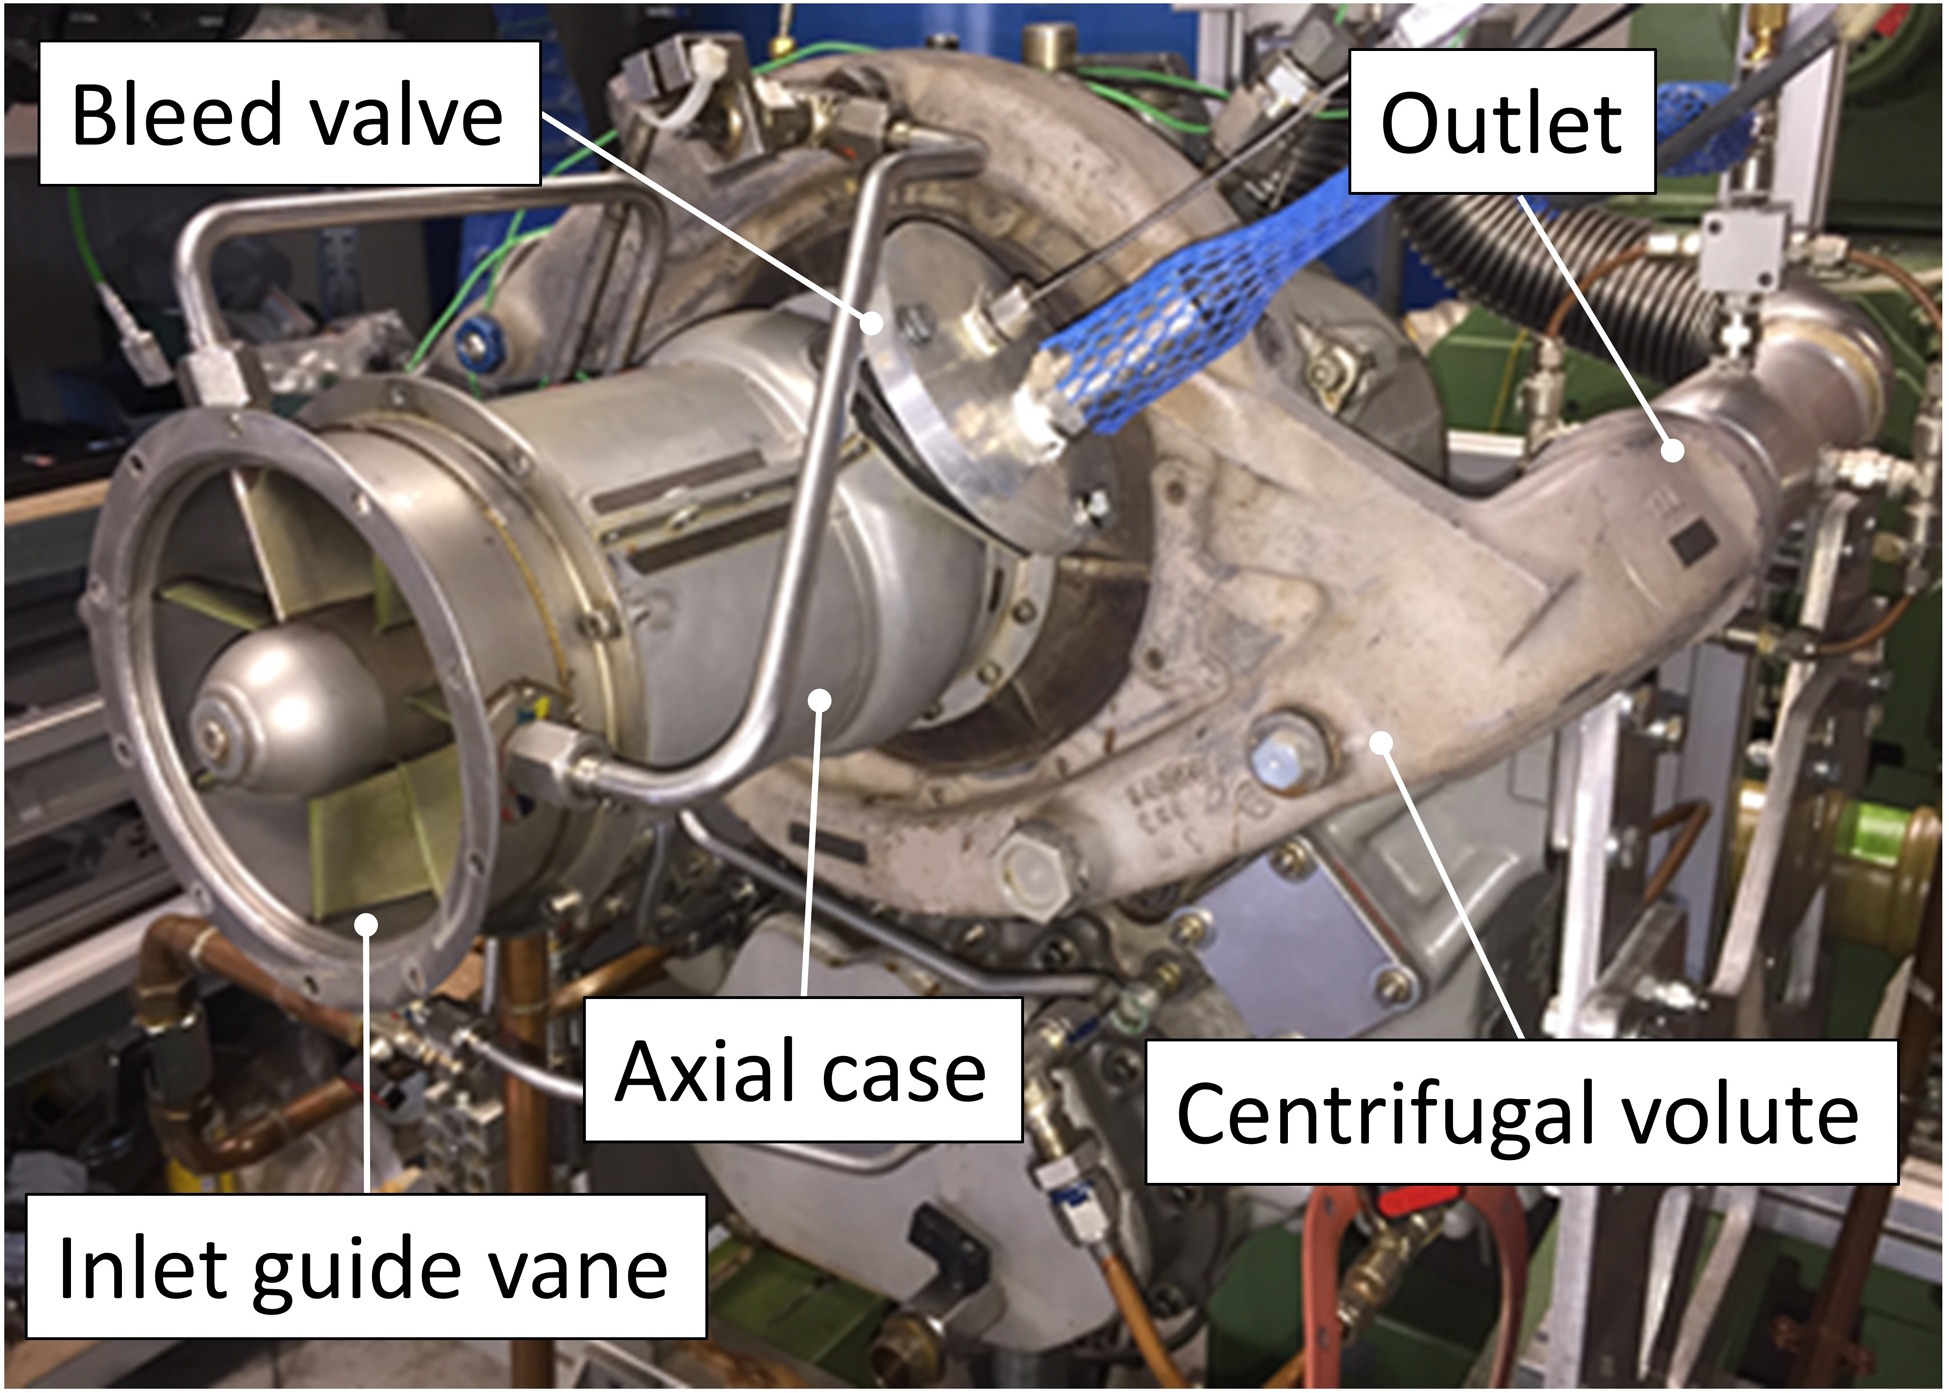
The centrifugal stage has two semivolutes, each with a circular exit duct with a diameter of 0.056 m and two flexible tubes link the outlet ducts to an exhaust outlet with a diameter of 0.100 m. An electric motor drives the machine. At its nominal operative conditions, the compressor achieves a pressure ratio of 6.2, with a rotational speed of 51,600 rpm and a mass flow rate of 1.36 kg/s. Besides the compressor unit, an air treatment unit, a water nozzles set-up, a contaminant injection system, and a discharge section compose the test bench. The schematic layout of the test bench is reported in Figure 2.
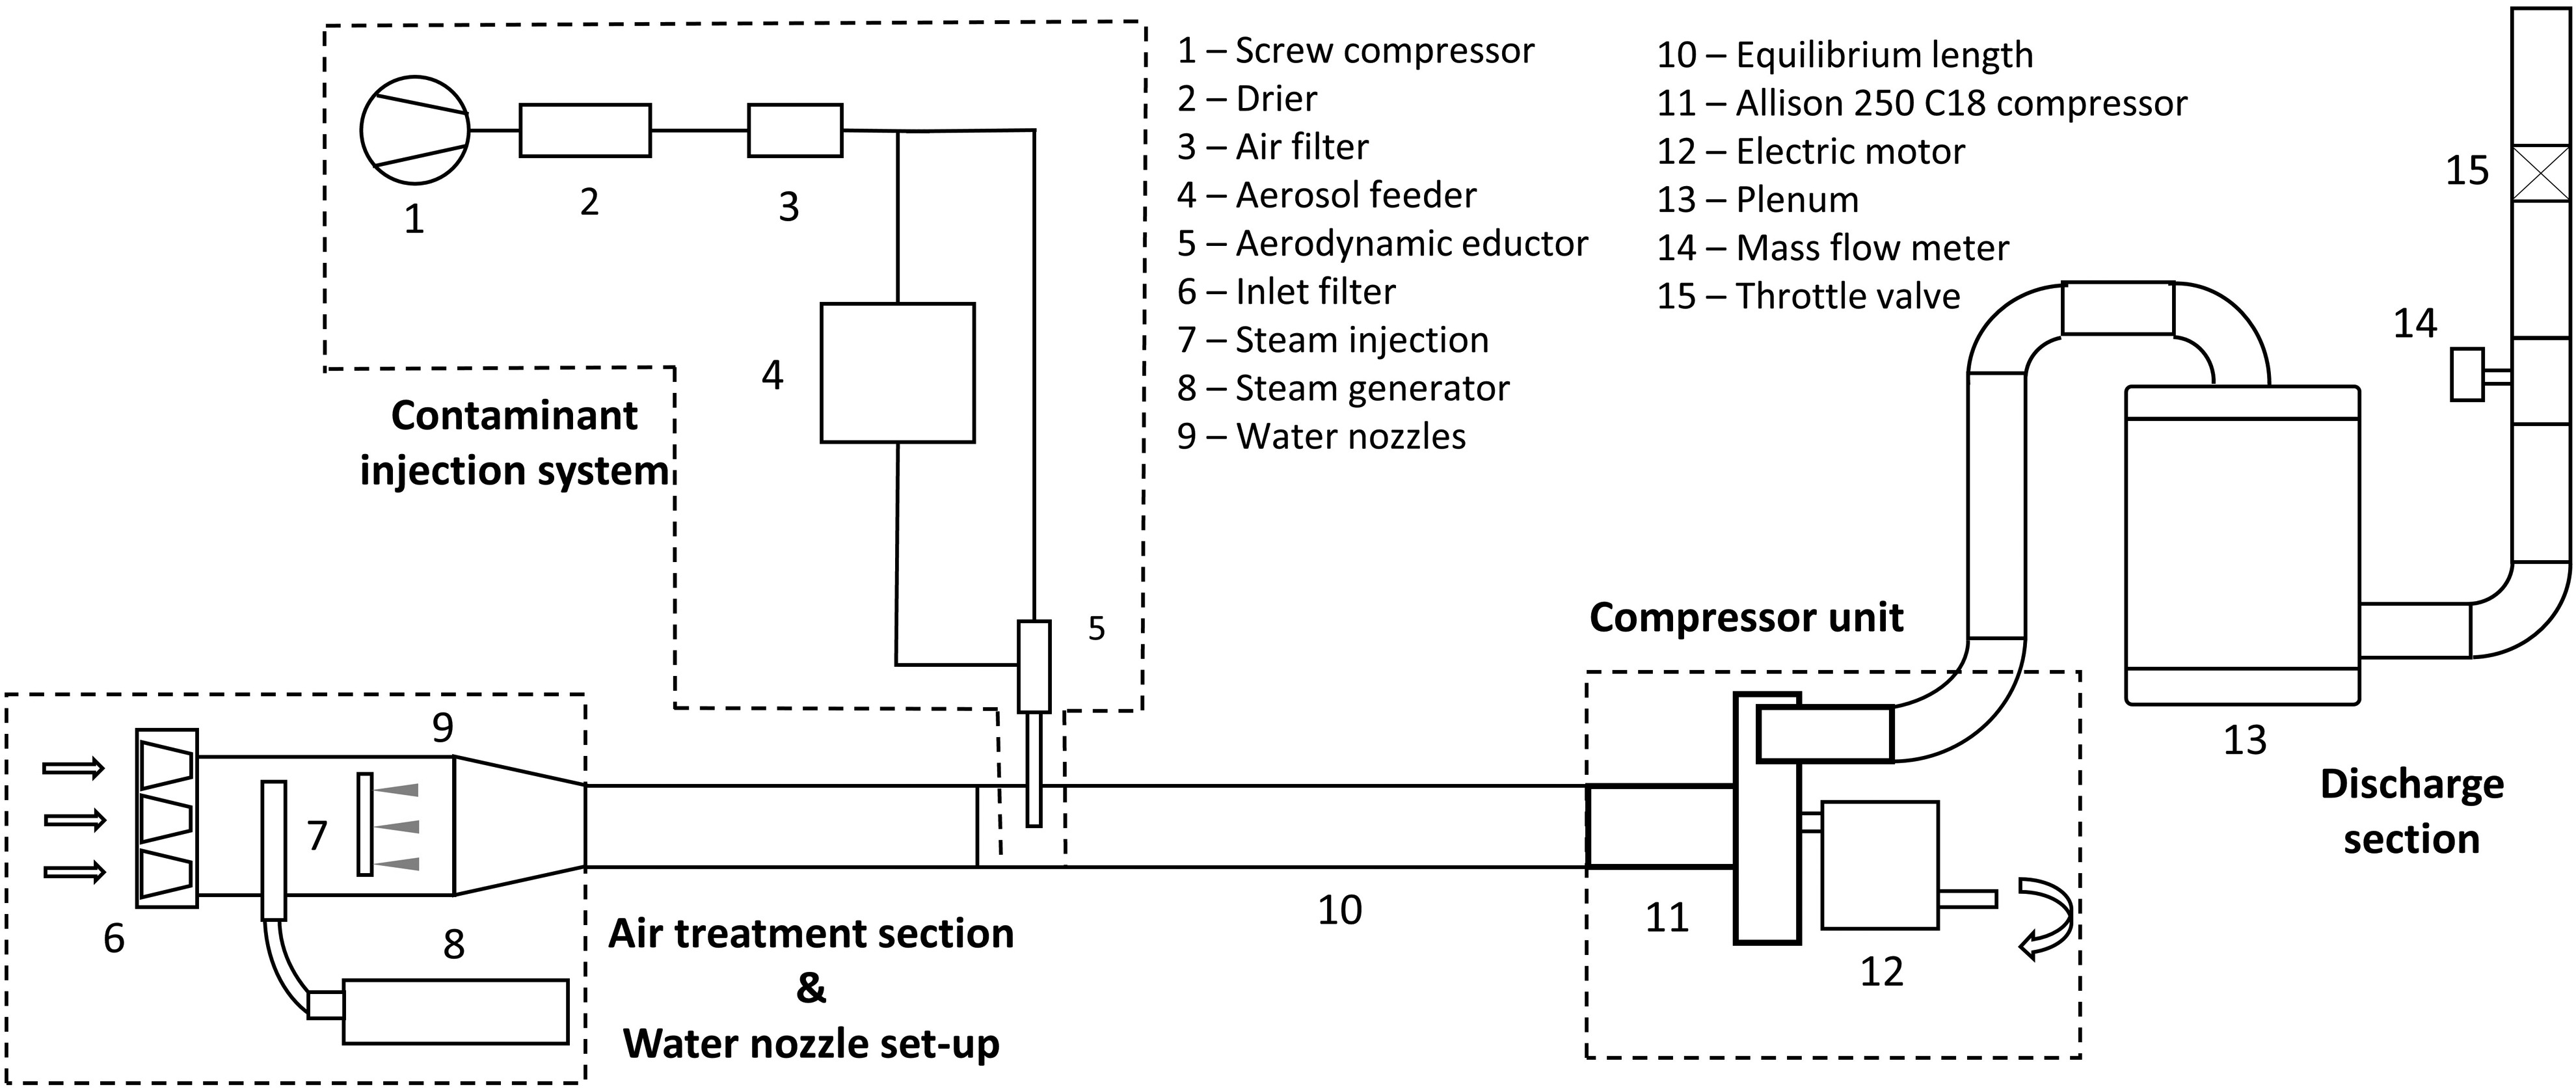
The air treatment unit is located at three meters from the compressor inlet mouth. At the inlet of this section is placed a compact EPA F9 filter that avoids the ingestion of external dust without introducing high-pressure losses. The present test bench section aims to modify the relative humidity value of the air swallowed by the compressor using a steam injection nozzle, linked to a steam generator. The steam humidification allows changing the relative humidity of the flow stream without increasing the air temperature.
The water nozzle set-up is composed of four axisymmetric spray cone water nozzles, and it is connected to a volumetric pump and a 50 l storage tank thorough a pipeline. A manual control valve downstream of the volumetric pump can regulate the pressure; in the present application, the fluid is supplied towards the nozzle at a pressure of 50 bar. At this pressure value, the calibrated mass flow rate of water injected is 0.18 l/min. The droplets have a Sauter mean diameter of 25 µm (values taken from the nozzle manufacturer datasheet). The droplets are injected at a distance of three meters from the compressor inlet mouth: this distance allows the droplets to reach a uniform distribution into the pipe and the kinetic coupling with the airflow.
The contaminant injection system has been designed to supply a constant mass flow rate of dust continuously. A solid aerosol generator doses the powder: the SAG 410 ultra-low flow model made by TOPAS GMBH, which measures out the particle mass flow rate to be injected. The system is powered by a screw compressor equipped with a dryer and a set of filters, which provides dry and clean shop air. The dosed powder is blown by an educator, which deagglomerates and disperses the contaminants into the compressor’s main pipeline. The uses of the educator, which works with the Venturi effect, guarantees an optimal deagglomeration of the test powders thanks to the shear stresses exerted into the throat of the device. More information about the particle feeding system can be found in (Suman et al., 2021). The particles are injected at a distance of two meters from the compressor inlet mouth: this distance allows the powder to reach a uniform distribution into the pipe and the kinetic coupling with the airflow.
The downstream section of the compressor is composed of the plenum, a mass flow meter, and a throttling valve.
Test procedure
Due to the long time required for the deposition phenomena to occur in actual operating conditions, the faithful reproduction of these mechanisms in the laboratory is practically unachievable. Researchers have adopted the strategy to increase the concentration of the contaminants by several orders of magnitude respect to the ambient condition (Jensen et al., 2005) to accelerate the phenomena and realize the test in a laboratory time scale.
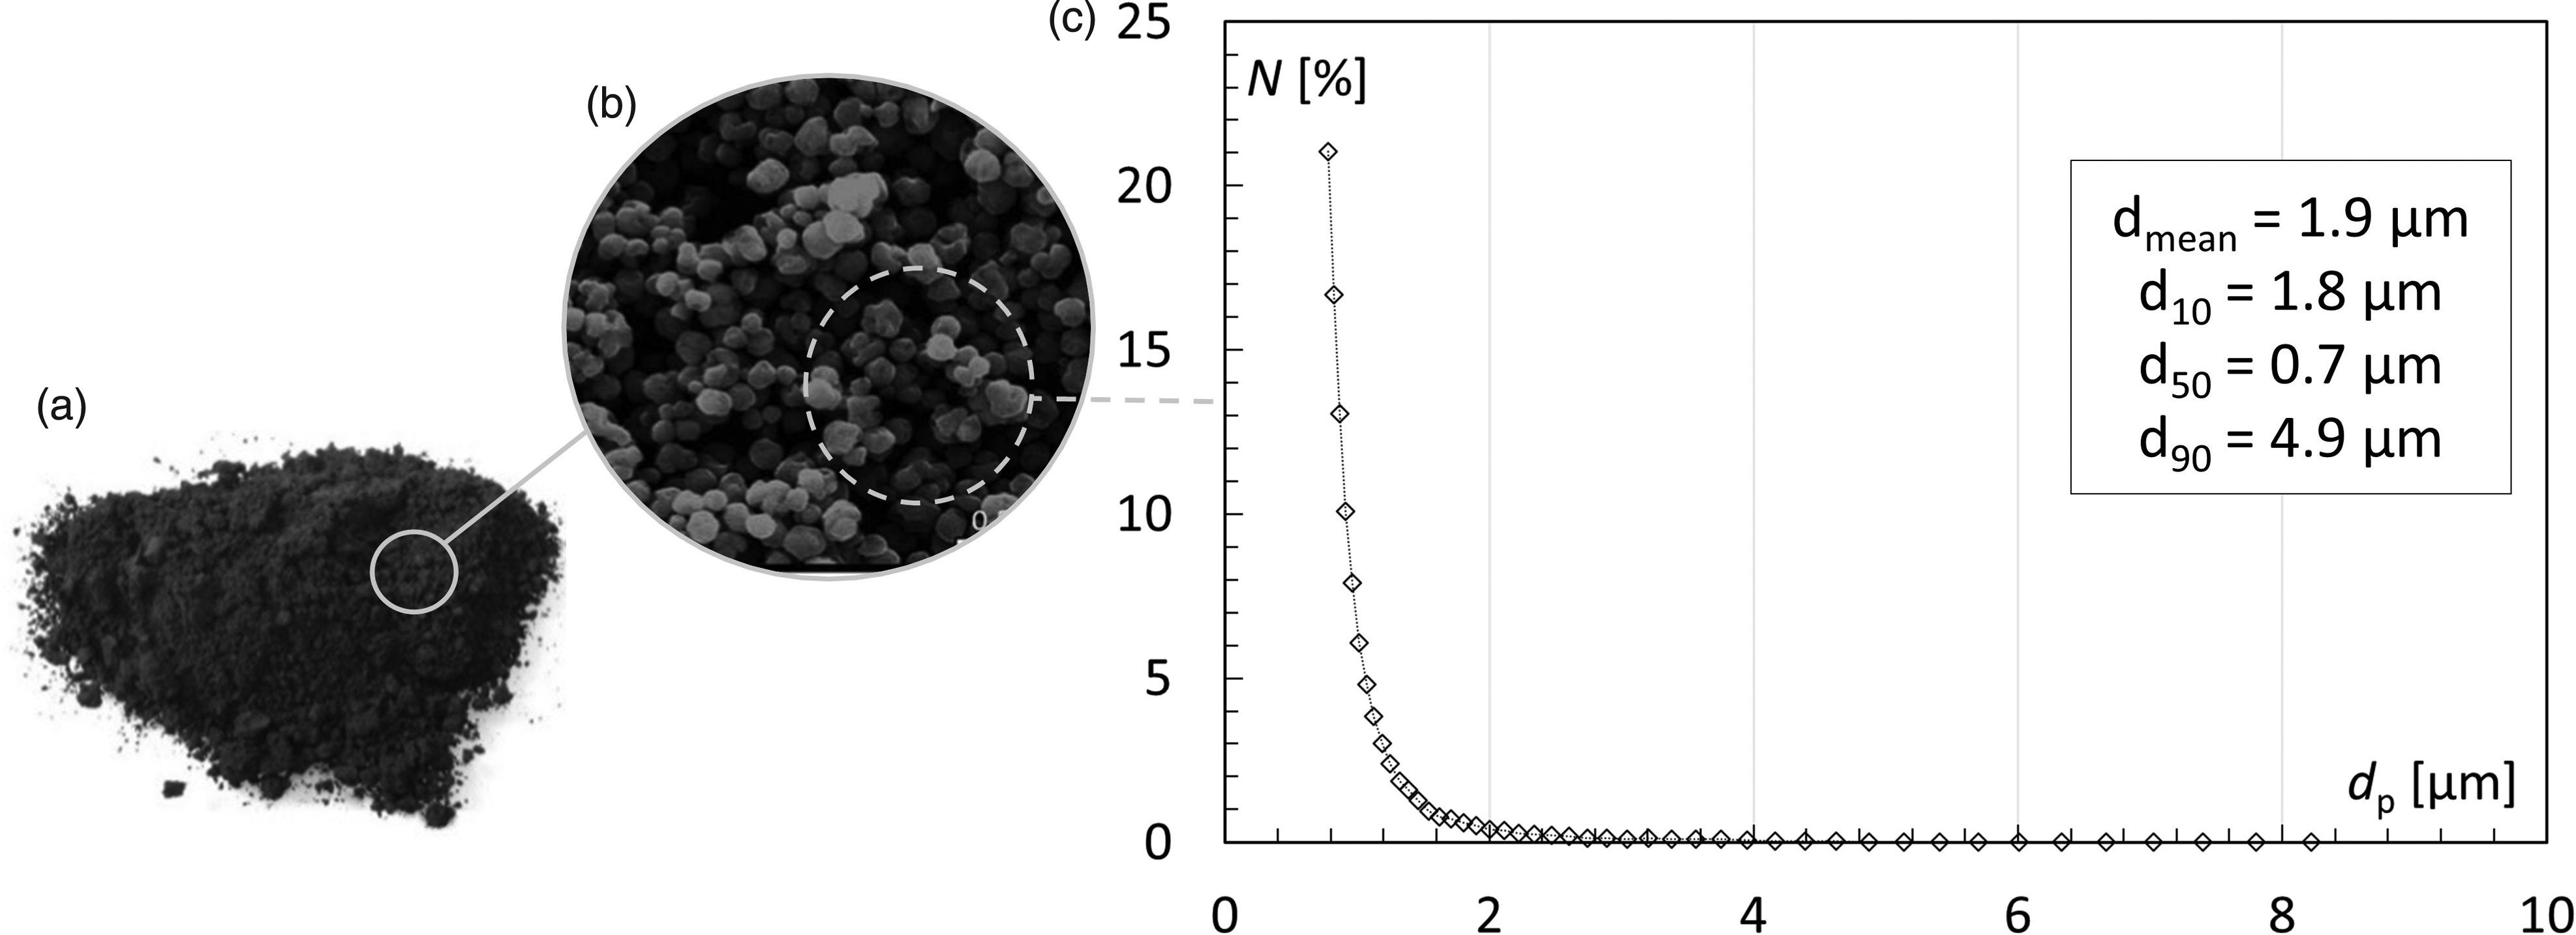
In this study, the compressor has been fouled with the standard test dust Raven 410 provided by Powder Technology GMBH. This test dust, commonly known as Carbon Black, is a form of paracrystalline carbon produced by the incomplete combustion of hydrocarbon and heavy petroleum products and is widely present in soot produced by diesel engines (Omidvarborna et al., 2015). In Figure 3a, the picture of a Carbon Black powder sample is shown, in Figure 3b, the image of the soot particles taken with the Scanning Electronic Microscope (SEM) is reported. The particle diameter distribution has been provided by the vendor, and it is reported in Figure 3c.
Figure 3.
Raven 410 test dust: (a) powder sample picture, (b) particle SEM picture and (c) particle diameter distribution.
The compressor unit has been fouled for 30 minutes at an operating rotational speed of 20,000 rpm with an air mass flow rate of 0.38 kg/s. The particle concentration has been kept constant for all the duration of the test at 12 mg/m3, resulting in a total mass of contaminants injected of 9.8 g. The performance curves of the Allison 250 C18 compressor unit in clean conditions are reported in the work of Munari et al. (2017), while the performance losses caused by continuous ingestion of Carbon Black have been measured on the same compressor unit in a previous work by Vulpio et al. (2020).
During the 30 min of operation, the relative humidity of the air at the compressor inlet has been kept constant at 80%RH. This high humidity value promotes particle deposition and increases the adhesion strength between particles and substrate. This condition can be one of the most burdensome for a cleaner removal action.
The washing operation has been divided into two parts, fluid injection (1 min) and drying (3 min) to eject all the liquid from the compressor. The compressor has been washed with a water-to-air ratio of 1.7%, corresponding to that reported in (Asplund, 1998) for the Allison 250 model.
The novelty introduced by the cleaner tested in this work, respect to other commercial cleaners, relies on a more effective combination of ethoxylated and propoxylated surface-active agents, specifically designed to tackle carbonaceous material particles from metallic surfaces.
To compare the washing effectiveness of the present cleaner with a reference condition, the experimental campaign has been repeated by washing the engine with demineralized water. Before starting the experimental campaign with demineralized water, the compressor has been offline cleaned to restore the initial condition of cleanliness.
The small size of the Allison 250 C18 compressor, makes this machine easy to be disassembled: the removal of the stator case from the compressor axial part allows direct access to the vanes and blades of the unit. The detection of the fouled and washed zones of the compressor has been done employing dedicated cameras (CANON EOS M6 mirrorless digital camera with Tokina 100 mm lens with a resolution of 3,552 × 2,664 pixels) positioned to detect the entire flow path of the axial compressor directly from the lab-testing facility. Thank the disassembling procedure, the half compressor case (stator) was positioned on a realized-on-purpose jig, and it overlooks a proper light and camera set-up. By contrast, the rotor was detected without any disassembling procedure, and the camera and light setup are installed directly on the rotating test rig. The pictures are taken using the same light set-up after each test. In Figure 4 the pictures of the compressor IGV (Figure 4a), rotor wheel (Figure 4b), and stator vanes (Figure 4c) are reported. The pictures have been taken in clean condition, after the contaminant ingestion, and after the washing procedure. Between each photographic report, the compressor has been dismounted and re-assembled.
Figure 4.
Views of the compressor unit in clean conditions: (a) IGV, (b) rotor wheel and (c) the disassembled stator.

Summing up, the experimental procedure is composed of the following steps:
Stator case disassembling and the picture of the IGV, stator vanes and rotor blades (clean condition) are taken;
Compressor fouling: 30 min of compressor operation at 20,000 rpm with particles ingestion;
Stator case disassembling and the picture of the IGV, stator vanes and rotor blades (fouled condition) are taken;
Stator case reassembling and compressor washing: 1 min of fluid injection at 20,000 rpm;
Compressor drying: 3 min of operation at 20,000 rpm;
Stator case disassembling and the picture of the IGV, stator vanes and rotor blades (washed condition) are taken.
Starting from the pictures taken during the campaign, the quantification of the washing effectiveness has been carried out by using image processing techniques. The open-source image processing package named IMAGE J (Schneider et al., 2012), developed by the U.S. National Institutes of Health, was used to analyze the digital pictures. Using the same procedure reported in (Brun et al., 2015) and in (Suman et al., 2020), a macro has been used to subtract the picture of the clean stator and rotor to the picture of the dirt one and to convert the resultant image into a binary format. The same procedure has been applied to the clean and after-washed pictures of the rotor and stator. This procedure allows highlighting the dirty zones of the compressor stator and rotor surfaces. The subtraction process applied to the images consists of a pixel-by-pixel subtraction operation: for each pixel pair subtracted, the procedure gives back a white pixel if the result is zero (the two pixels were identical) or a black pixel if the result is non-zero (the pixel were different). In light of this, the subtraction process returns a black and white image, where the black pixels are representative of the dirty zones of the compressor. This procedure can be applied only if the pictures taken at the different conditions are perfectly stackable. The use of a global thresholding value allows choosing a cutoff value, such that every pixel less than that value is considered a white pixel, while every pixel greater than that value is considered a black pixel (Ferreira and Rasband, 2012).
Uncertainty quantification
The uncertainty evaluation has to be related to the image processing operation of the stator and rotor in clean and fouled conditions. Two different sources of uncertainty have been calculated and combined: (i) the component related to the repeatability of the photographic operation
The first component, which may be introduced by the electromagnetic noise of the camera and light set-up during the measurements, has been detected through the comparison of the stator and rotor pictures taken in clean conditions (before starting the dust injection in the two tests), according to the procedure explained in the previous section. Similarly, the number of black pixels counted on each vane/blade (due to the differences between two pictures of clean condition), after the subtraction process, compared to the total number of the vane/blade pixel, is representative of the first uncertainty component, named
Through the present analysis, an estimation of the expected confidence band associated with the results can be obtained. The uncertainty values will be applied to the results reported in the following section by error bands.
Results
The results of the application of the image post-processing technique are reported in Figures 5 and 6 for the rotor blades and the stator vanes, respectively. The columns of Figures 5 and 6 refer to the condition of the compressor: the first column shows the fouled blades and vanes after the ingestion of the contaminants, while in the second column the residual deposits after the washing operation are depicted. Instead, the rows of Figures 5 and 6 refer to the cleaning fluid adopted: the first row refers to the demineralized water, while the second row refers to the commercial cleaner.
Figure 5.
Results of the image post-processing: deposits on the stator vanes after the particle ingestion (a–c) and the washing procedure with demineralized water (b) and commercial cleaner (d).
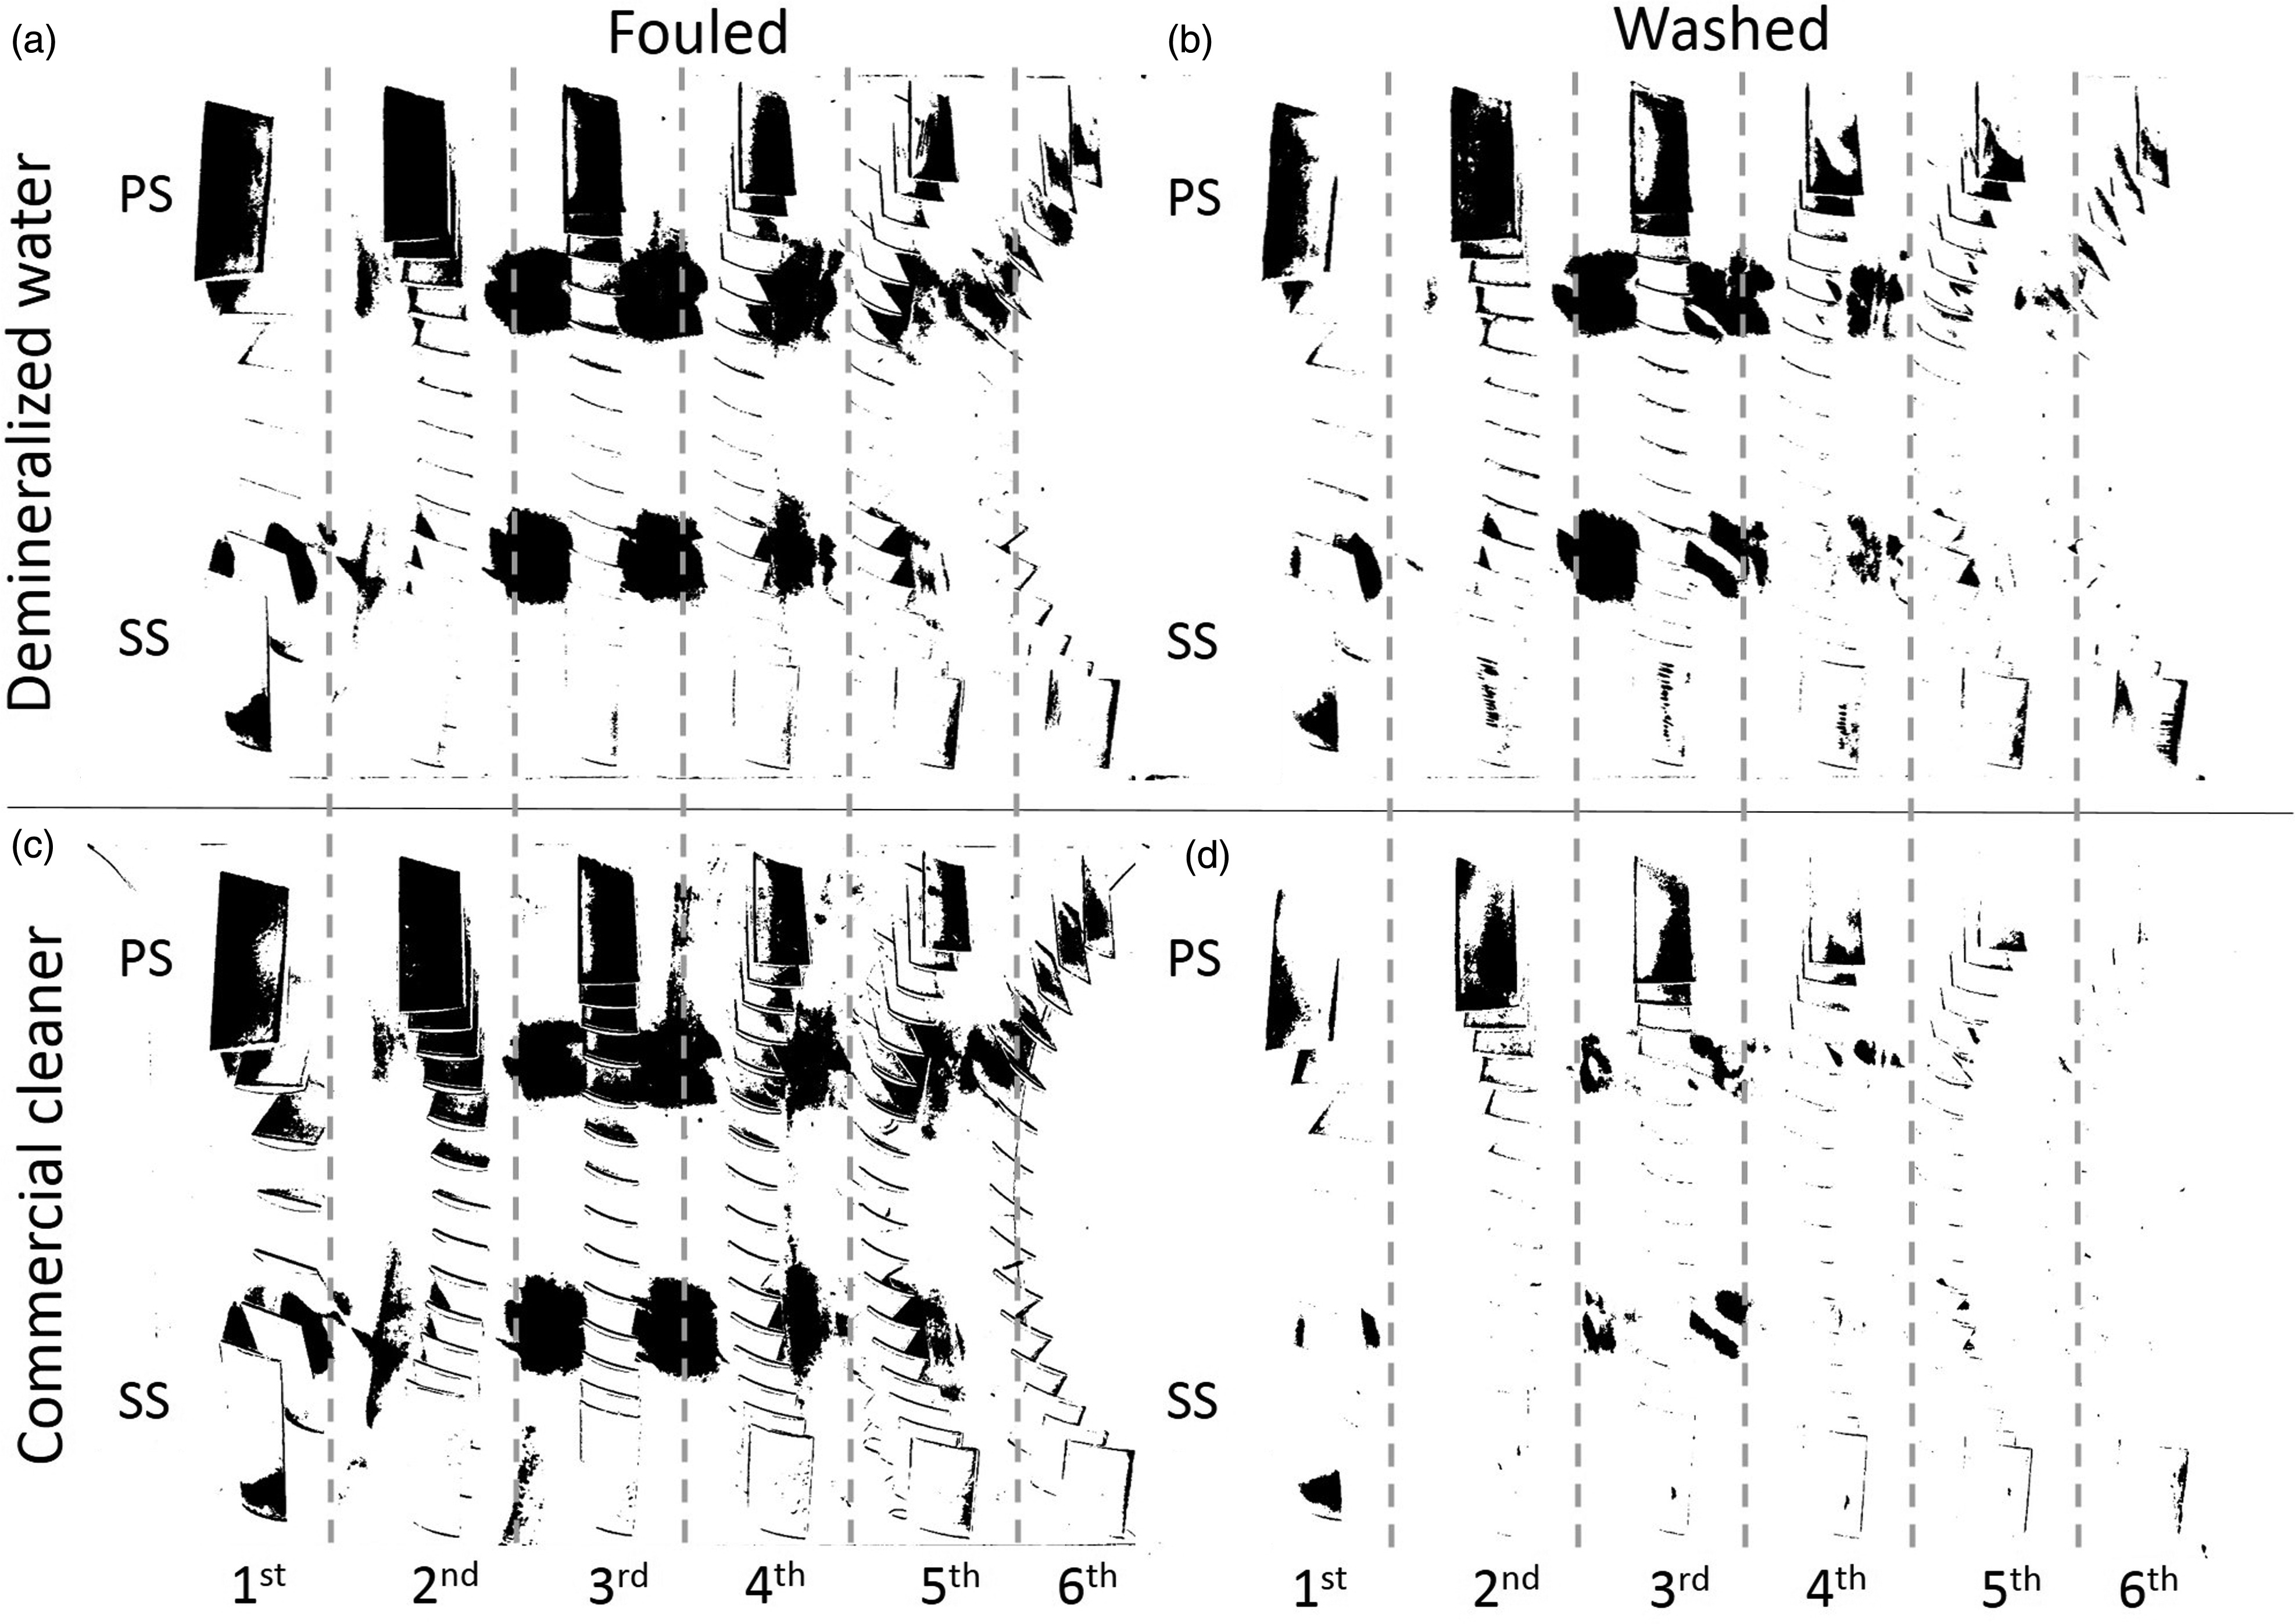
Figure 6.
Results of the image post-processing: deposits on the rotor blades after the particle ingestion (a–c) and the washing procedure with demineralized water (b) and commercial cleaner (d).
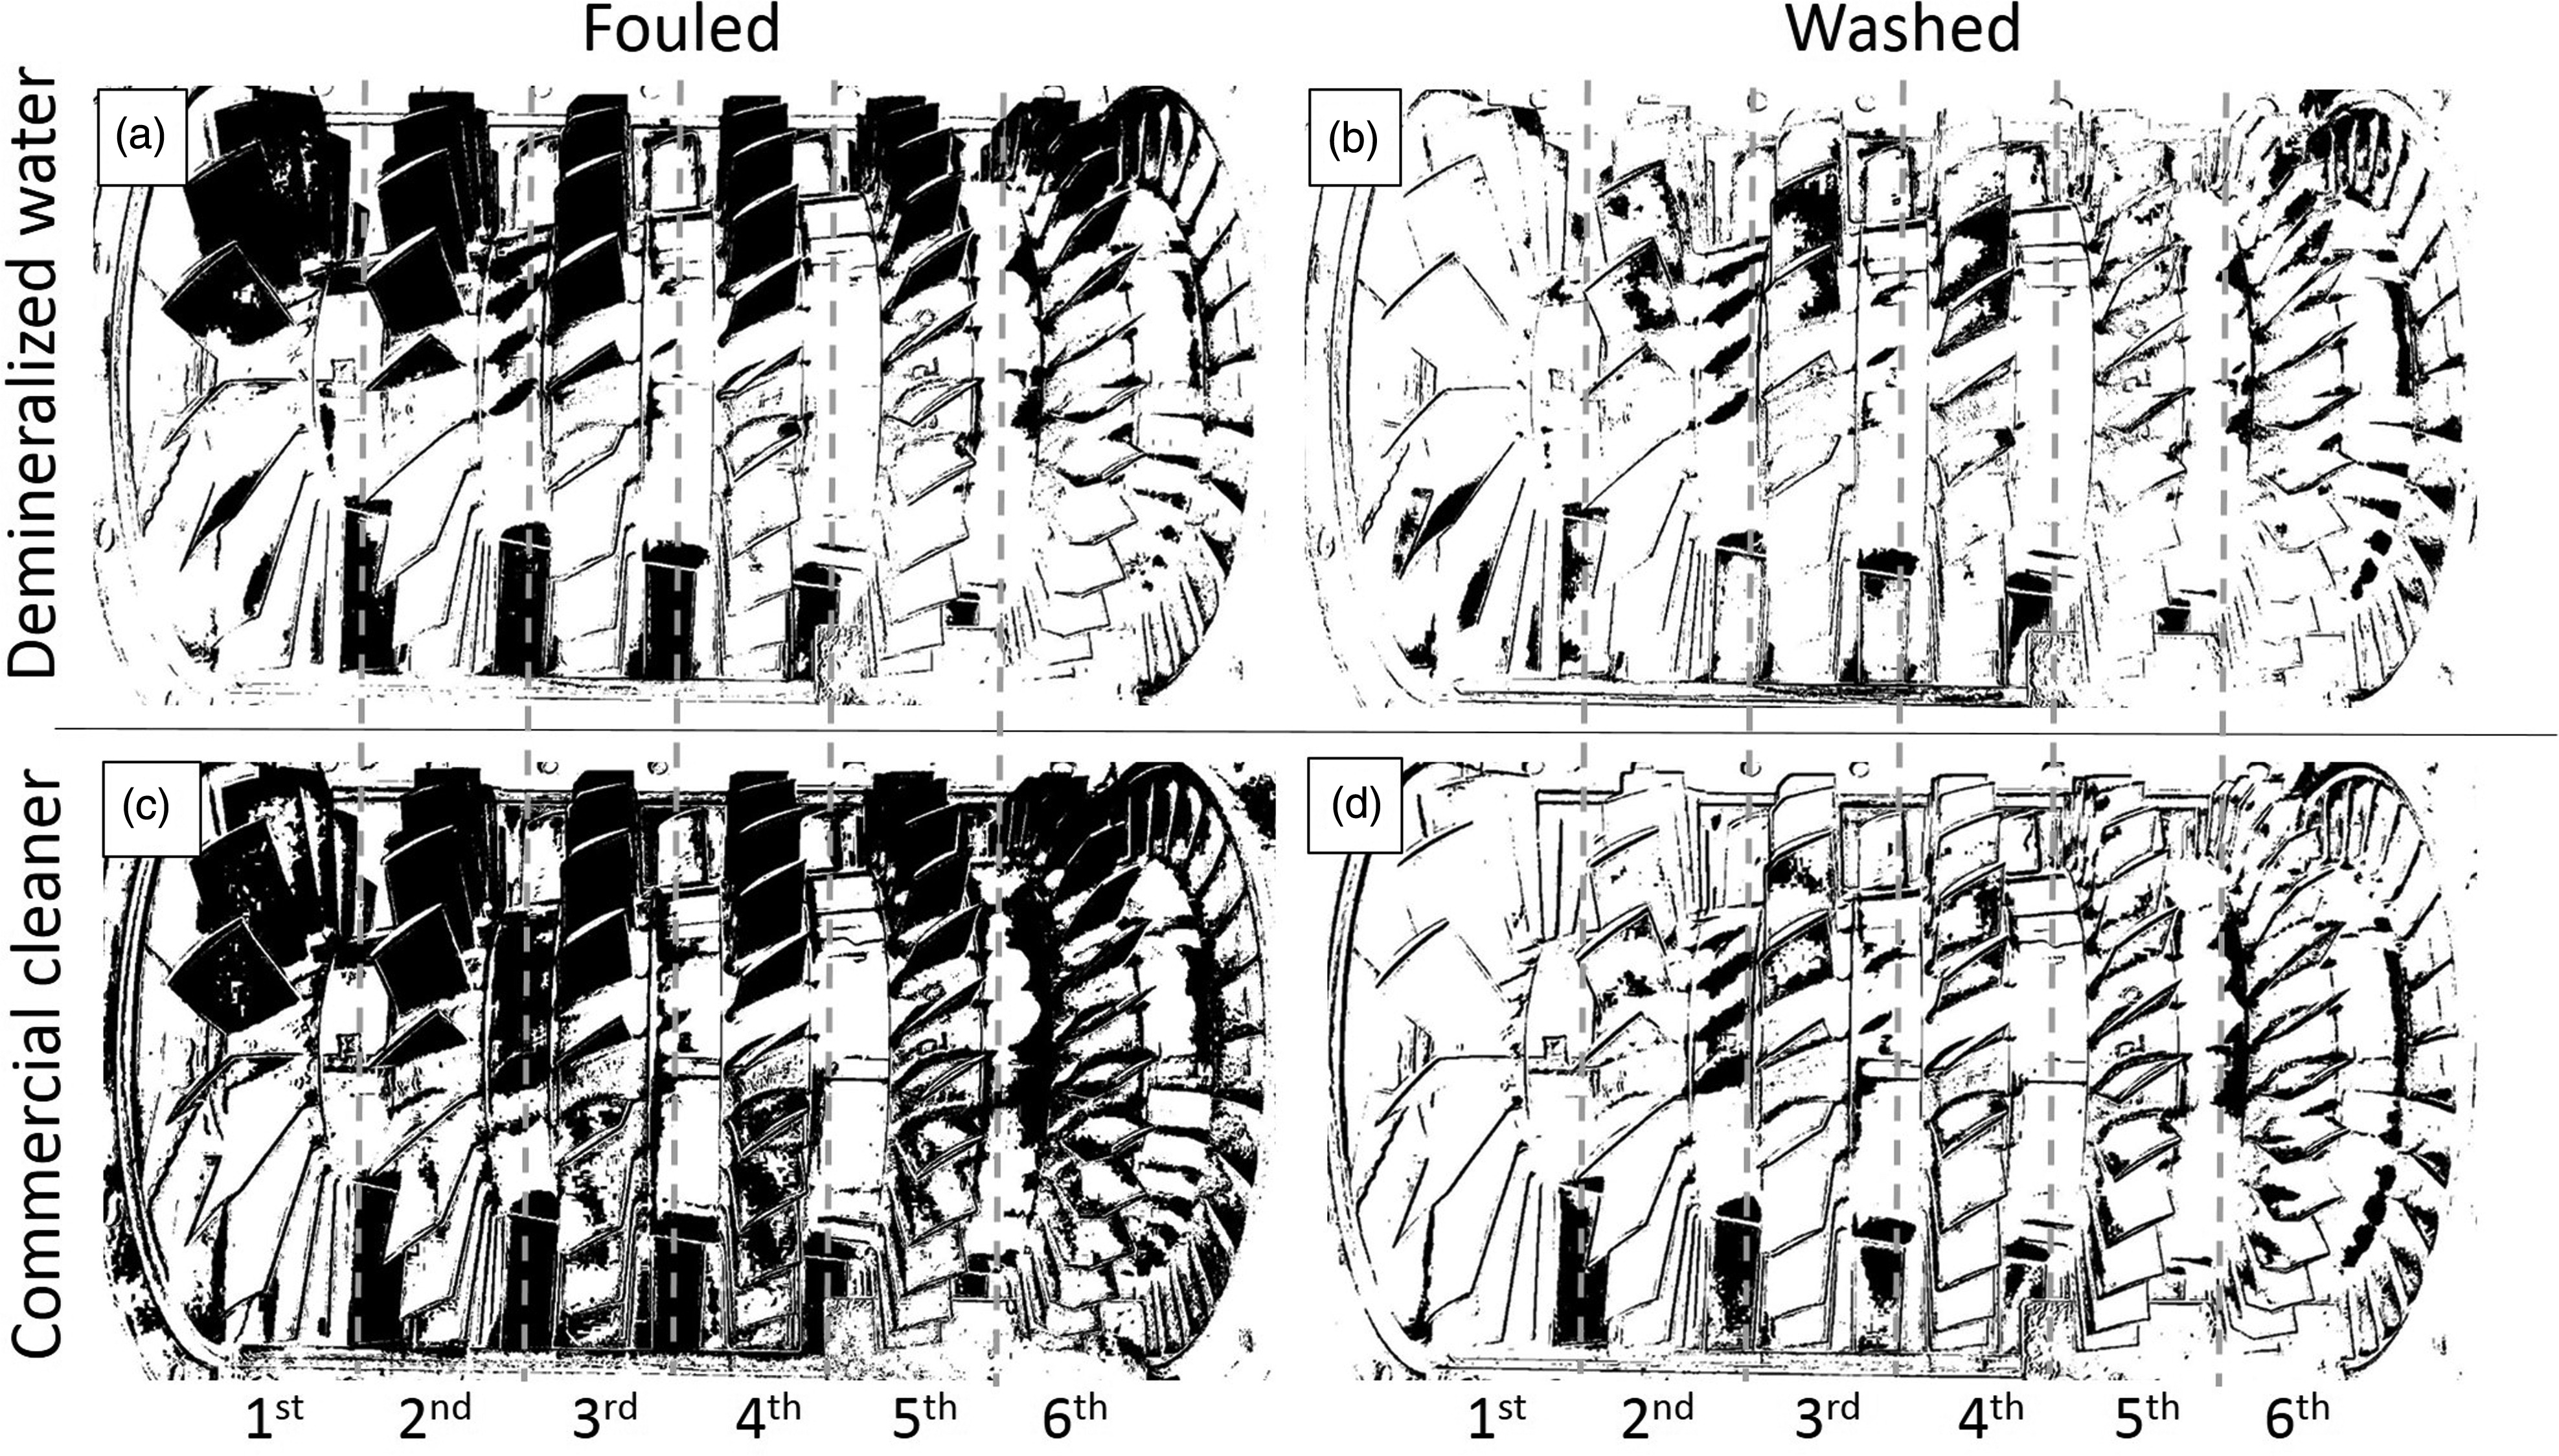
The post-processed pictures of the rotor blades and stator vanes, obtained after the particle ingestion during the two campaigns (Figures 5a, c, 6a, and c), show high similarity between them, meaning that the particle deposition operation has good repeatability between the two tests. Both for stator vanes and rotor blades, the pressure sides appear dirtier than the suction sides, especially in the first stages of the compressor. Instead, looking at Figures 5b, d, 6b, and d, obtained after the washing operations, it can be noted high differences concerning the zones and magnitude of the deposit patterns. From a visual analysis, it can be assessed that the commercial cleaner is able to remove deposits especially in the latter stages of the compressor, both for rotor and stator. These findings show the different behavior of demineralized water and commercial cleaner in tackling similar deposition patterns when the same washing parameters are employed. The difference in the removal mechanisms of the two cleaner is evident looking at the 2nd, 3rd, and 4th stages of the compressor stator vanes, in correspondence of the suction side. The use of the water instead of the commercial cleaner promotes the motion and the re-deposition of the contaminants from the first stage to the following stages. This behavior is due by the different nature of the two fluids: the presence of surfactant micelles into the commercial cleaner and the formation of the foam promotes the removal and the dispersion of the particles, which continue their path towards the outlet avoiding re-deposition.
To extract quantitative information from the post-processed pictures, a macro that counts the pixel on delimitated areas of the pictures has been implemented: the zones taken into account are the blade and vane regions. This technique has been employed to count the black pixels on a vane/blade and to compare them with the vane/blade total number of pixels. This value gives the quantitative information of the surface percentage occupied by the deposits after the washing procedure (residual deposits). This technique has been employed on the picture of the fouled and washed conditions, for both the pressure side and suction side.
The values obtained are employed to compute the washing effectiveness defined as:
where
Figure 7.
Washing effectiveness and related error bands for the demineralized water (dashed line) and commercial cleaner (solid line) through the stator vanes in correspondence of the pressure side (a) and the suction side (b), and through the rotor blades in correspondence of the pressure side (c) and the suction side (d).
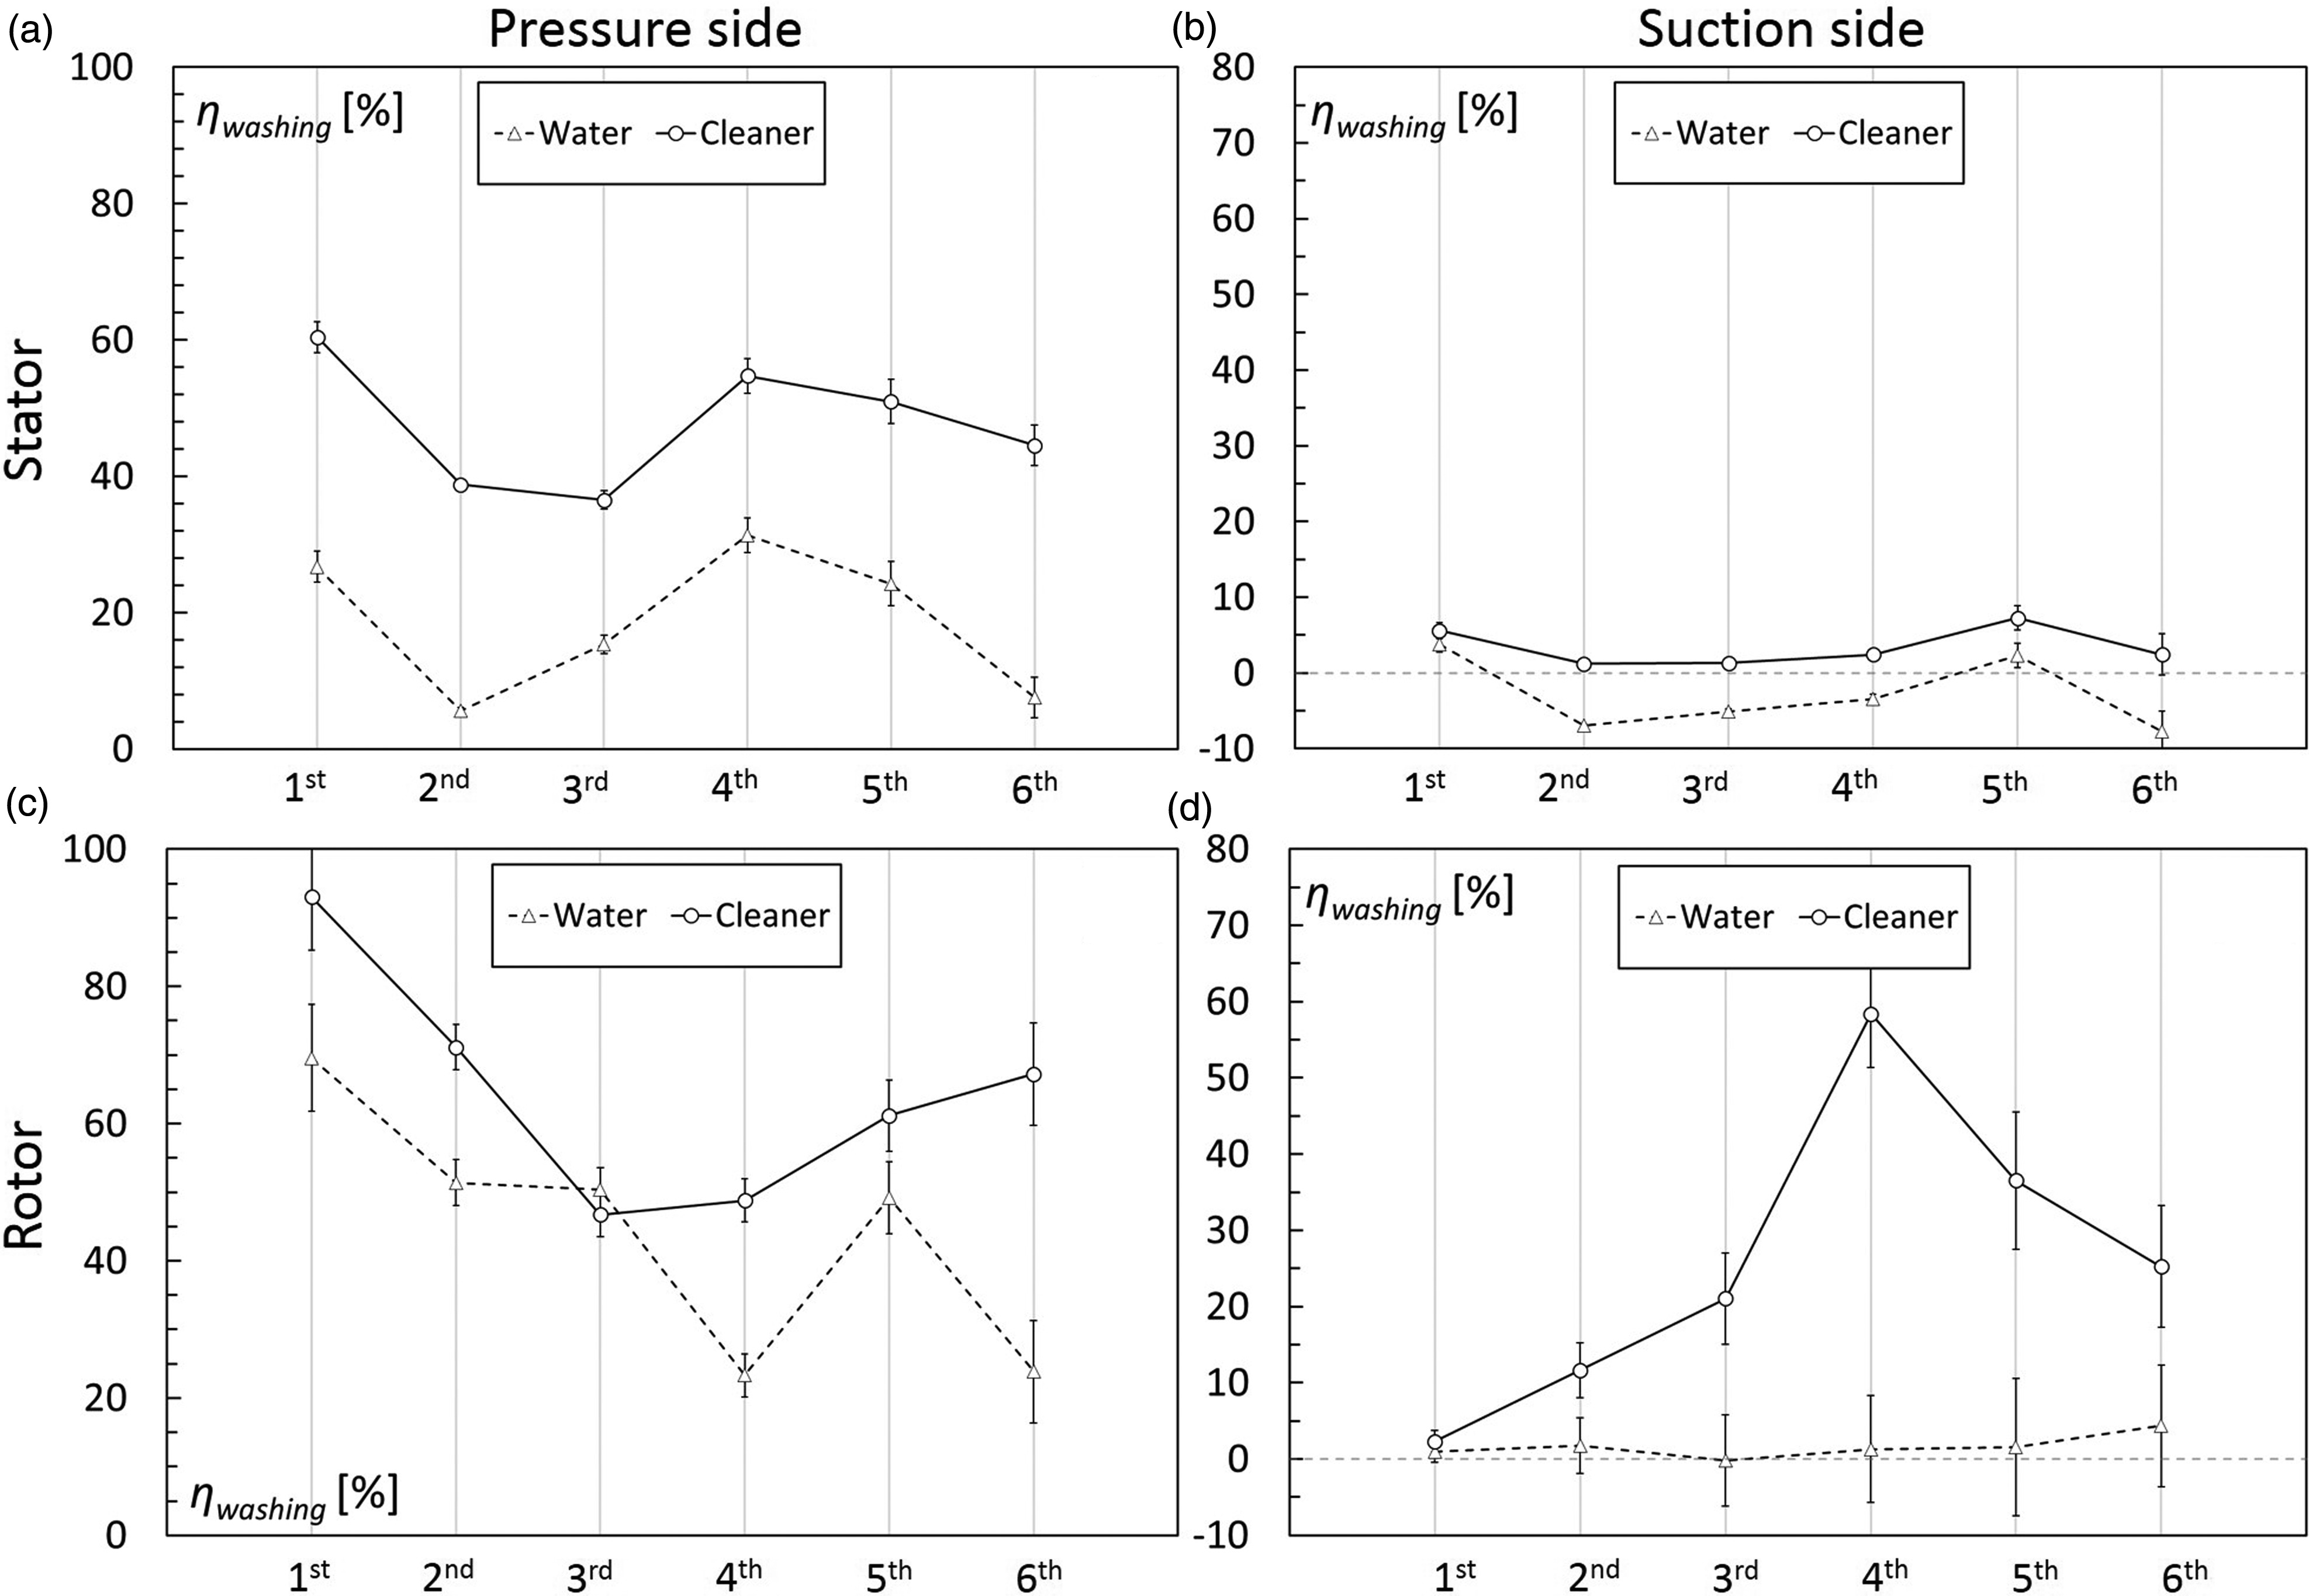
Regarding the trend reported in Figure 7 for the stator vanes pressure side (Figure 7a) and for the suction side (Figure 7b) the commercial cleaner shows higher values of washing capability respect to the demineralized water. The commercial cleaner has an average value of ηwashing of 47.7% on the pressure side and 3.4% on the suction side. The water average values are 18.5% on the pressure side and −2.9% on the suction side.
The effectiveness of this methodology to detect the removal capability is higher for the pressure side, where the amount of deposits is higher. For this reason, the pixel count in the PS is easier and the removal capability can be assessed with the reference of several “fouled” pixels. By contrast, as can be noted by looking at Figure 5, the suction side is less affected by deposits and the cleaning capability has to be evaluated on a fewer number of “fouled” pixels introducing a higher uncertainty level. The negative values reached by the washing capability values confirm the previous statements: the carbon black deposits, removed from the IGV and the first stage, redeposit onto the following vanes, increasing the vane surface deposit detected at the end of the test.
For this reason, a negative value of the washing effectiveness means that, after the washing procedure, the surface is found to be dirtier than the fouled condition.
The same procedure has been applied to the rotor blades, and the results are reported in Figure 6. Looking at the washing capability trends for the rotor blades depicted in Figure 7 for the pressure side (Figure 7a) and the suction side (Figure 7b) of the blades, it can be noted that, also in this case, the use of the cleaner allows a better washing effectiveness respect to the use of demineralized water only. In particular, as for the stator vanes, the washing capability reaches higher values in correspondence of the pressure side: the average washing capability value along the stages is 44.6% for the water and 64.7% for the commercial cleaner. The pressure side surfaces of the first stages are those with higher washing capability. A very high difference between the washing capabilities of the two fluids is highlighted at the suction side of the rotor blades. In fact, in these zones, the average washing capability is 1.6% and 25.9% respectively for water and commercial cleaner. Comparing Figure 7a and b with Figure 7c and d, it can be noted that the washing capability values of the rotor blades are higher respect to values found on the stator vanes. This fact probably is due to the centrifugal forces exerted by the rotor that promotes the deposit removal by the mechanical action of the injected droplets.
Further developments
In this work, the use of the picture post-processing technique, applied to the compressor-washing field, proved to be a reliable method to assess the washing effectiveness of a cleaning fluid against contaminants deposited into axial compressors. Further developments will employ this promising technique to investigate the washing effectiveness changing the droplet diameter, the water-to-air ratio, and the type of contaminant.
Conclusions
Compressor washing operations have become increasingly attractive due to their capability to recover the performance losses of the engines. The study of the effect of an on-purpose designed compressor cleaner against soot deposits has been assessed in this work. The compressor unit of the Allison 250 C18 engine has been fouled with soot contaminant under controlled conditions and then washed. To compare the results the procedure has been repeated by using demineralized water. The compressor has been dismounted and pictures of the fouled zones have been taken and analyzed employing an image post-processing package.
Through the pixel counting technique, the washing capability of the two fluids has been assessed: for the suction sides and the pressure sides of the stator vanes and rotor blades the value of the washing effectiveness has been computed. The results have shown significantly higher values of the washing effectiveness when the commercial cleaner is used, especially on the suction side of the stator vanes and on the pressure side of the rotor blades. Moreover, the re-deposition of soot particles on the suction side of the middle stages of the stator has been detected when demineralized water is used instead of the commercial cleaner.
Competing interests
Nicola Casari declares that he has no conflict of interest. Michele Pinelli declares that he has no conflict of interest. Alessio Suman declares that he has no conflict of interest. Alessandro Vulpio declares that he has no conflict of interest. Craig Appleby declares that he has no conflict of interest. Simon Kyte declares that he has no conflict of interest.