

Introduction
Recent advancements in turbofan technology to meet emission and noise reduction targets include the redesign of the fan stage to have low fan pressure ratio (FPR) and ultra high bypass ratio. This allows driving a large mass of air through the engine at lower speed, thus improving propulsive efficiency and reducing fuel burn (Hughes et al., 2011; Haselbach, 2015). However, the low FPR, large diameter and reduced rotational speed in future fan designs leads to increased sensitivity of the turbofan to off-design fan operation (Peters et al., 2014). One off-design condition that becomes important to understand in the context of aircraft safety is the windmill condition.
The windmill condition occurs after the in-flight shutdown of a turbofan, when the fan continues to spin due to the ram pressure of the oncoming air but the shaft power input from the turbine falls to zero. Knowledge of the windmill drag and rotational speed of the fan is key at early stages of the engine design. The windmill drag is the maximum drag that will be experienced by the engine, making it a limiting condition for sizing the aircraft vertical stabiliser. Fan windmill often follows damage to the fan due to foreign object ingestion, birdstrike or a fan blade off failure. The damage patterns are highly non-axisymmetric, particularly those for a fan blade-off (FBO) event, and rotation of a damaged fan leads to high levels of vibration due to the out-of-balance centrifugal loads (Zhang et al., 2023a). The low rotational speed of the fan at windmill, combined with damage to the fan, may excite resonant vibration modes in the airframe (von Groll, 2000; Zhao et al., 2024).
The flow field of an undamaged fan at windmill has been widely studied in the literature (Prasad and Lord, 2010; García Rosa et al., 2015; Gunn and Hall, 2016), showing that the overall zero work is the result of the fan acting like a compressor near the hub and like a turbine near the casing. The fan rotational speed is set only by the mass flow going through, resulting in a constant flow coefficient and flow similarity between different mass flow rates (Binder et al., 2015; Rosa et al., 2021; Zhang et al., 2022). The mass flow is determined by the losses through the fan stage, which for windmill are caused by the large pressure side separations in both the stator and rotor row, as a result of the low fan rotational speed and corresponding large negative incidence (Prasad and Lord, 2010; Dufour et al., 2015; Gunn and Hall, 2016).
Even though windmill often follows damage to the fan, few studies consider the windmill flow field for damaged fans. Mohankumar and Wilson (2017) studied both axisymmetric and non-axisymmetric fan tip damage. For the axisymmetric case, they found that the removal of the blade tips greatly reduced the rotational speed, as there is no more work extraction near the casing. In the case of non-axisymmetric damage, a smaller reduction in fan rotational speed was observed for an equivalent amount of damage. Similarly, Zhang et al. (2023b) found that the rotational speed for a fan with a missing blade and adjacent blade tip remained nearly identical to the value for an undamaged fan. The experimental results by Medina Cassillas et al. (2025) showed that axisymmetric damage of 25% blade span decreases the fan rotational speed by 61%, compared to a decrease between 9% and 13% for non-axisymmetric damage, depending on the circumferential distribution of damage, when 25% of the blade is removed from half the blades. It was shown that this discrepancy is caused by the occurrence of blade to blade interactions in the case of non-axisymmetric damage.
In this paper, the windmill condition for realistic damage patterns is studied, both experimentally and numerically. The flowfield for the realistic damage case is compared to idealised damage cases. It will be shown that the rotor work distribution for a fan at windmill is determined by the flow turning and the axial velocity at rotor exit. The impact on axial velocity is considered first, showing that flow redistributes to damaged regions, such that the spanwise distribution of the damage has a big effect on the axial velocity and thus the windmill operating point. The flow turning in the damaged area of the fan is then shown to be the same as for an equivalent idealised damage case. Finally, loss and blockage are characterised for both the rotor and stator, where damage is shown to reduce the blockage and therefore the loss in both rows.
Methodology
The majority of the methods used to obtain the results presented in this paper are the same as were used by the authors in previous work. A brief description of the rig and experimental methodology will be given below. Further details of the experimental rig setup and measurement techniques can be found in Medina Cassillas et al. (2025). The computational setup described in previous work was only used for steady simulations, and the unsteady CFD methodology will be described in more detail in this paper.
Experimental methods
To obtain measurements of a fan in windmill condition, a test campaign was completed using the low speed, single stream, vertical fan rig shown in Figure 1. This testing facility was developed in previous work to research Boundary Layer Ingestion (BLI) (Gunn et al., 2013; Castillo Pardo and Hall, 2019), and was modified as described in Medina Cassillas et al. (2025) to achieve a windmill operating point representative of a future low FPR design. An array of auxiliary fans placed downstream of the fan section pull air through the rig, causing the rotor to windmill at the desired operating point.
Figure 1.
Low speed fan rig used for windmill experimental measurements (Medina Cassillas et al., 2025).
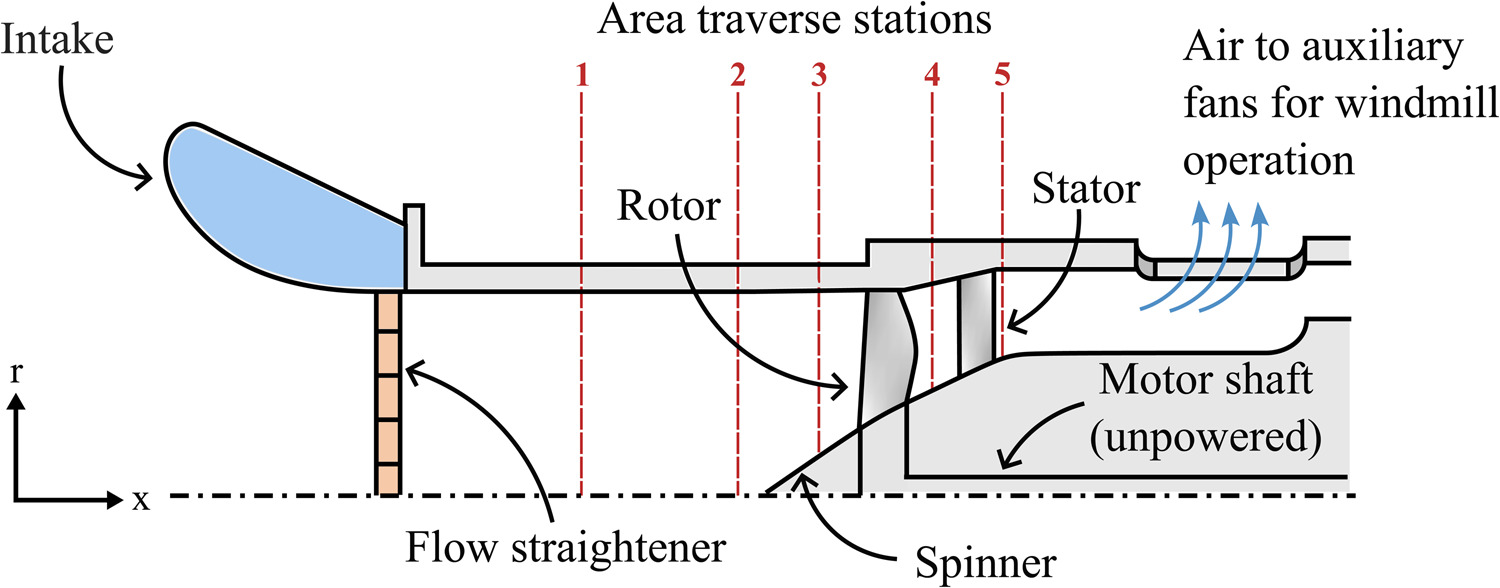
Five-hole probe measurements were taken at stations 1 (rig inlet), 3 (rotor inlet), 4 (rotor exit) and 5 (stator exit) marked in Figure 1 to obtain steady pressure measurements and describe the overall fan windmill operating point. To obtain flow angle measurements, the five-hole probe was calibrated in a straight, uniform flow, by rotating the probe to
Hot-wire traverses were performed at the most informative station for understanding the flow structures through the fan rotor, which is at rotor exit (station 4), noting that these measurements are more time and data-intensive than five-hole probe measurements. These were used to obtain the ensemble-averaged flow field downstream of the rotor, such that blade-to-blade differences can be observed for the damage cases. The hot-wire collects data over 50 rotor revolutions, and the signal is locked to the rotor shaft in order to obtain an ensemble per rotor revolution. These ensembles are then averaged to obtain the velocity flow field for the rotor over one revolution. To convert the hot-wire voltage measurements into velocity measurements, the King’s Law calibration method described in Bruun (1995) was used. In addition to this, by rotating the hot-wire probe around its axis it was possible to obtain unsteady flow angle measurements. The process to calibrate the probe for velocity and angle and perform the ensemble average is described in detail in Medina Cassillas et al. (2025). The hot-wire velocity uncertainty was shown to be below 2.45% of local value and the flow angle uncertainty below 1.92%.
Damage patterns
Figure 2 shows each of the fan rotors tested in the low speed fan rig, where individual blades can be removed and replaced with blades with 25% and 50% damage to create different damage patterns. The sector damage (SD1) case shown in Figure 2d is considered to be representative of rotor damage following a fan blade-off event, where half of the trailing blade is also missing and subsequent blades see lighter damage, with a portion of the tip section removed (ATSB, 2001; Zhang et al., 2023a). The case with balanced damaged sectors (SD2) was used for experimental testing, as balancing the missing blades reduced the loads on the rotor bearings.
Figure 2.
Damage patterns considered for damaged fan windmill investigation. (a) Undamaged (U). (b) Fan blade-off (FBO). (c) Periodic tip damage (PTD). (d) Sector damage (SD1) and (e) Balanced sector damage (SD2).
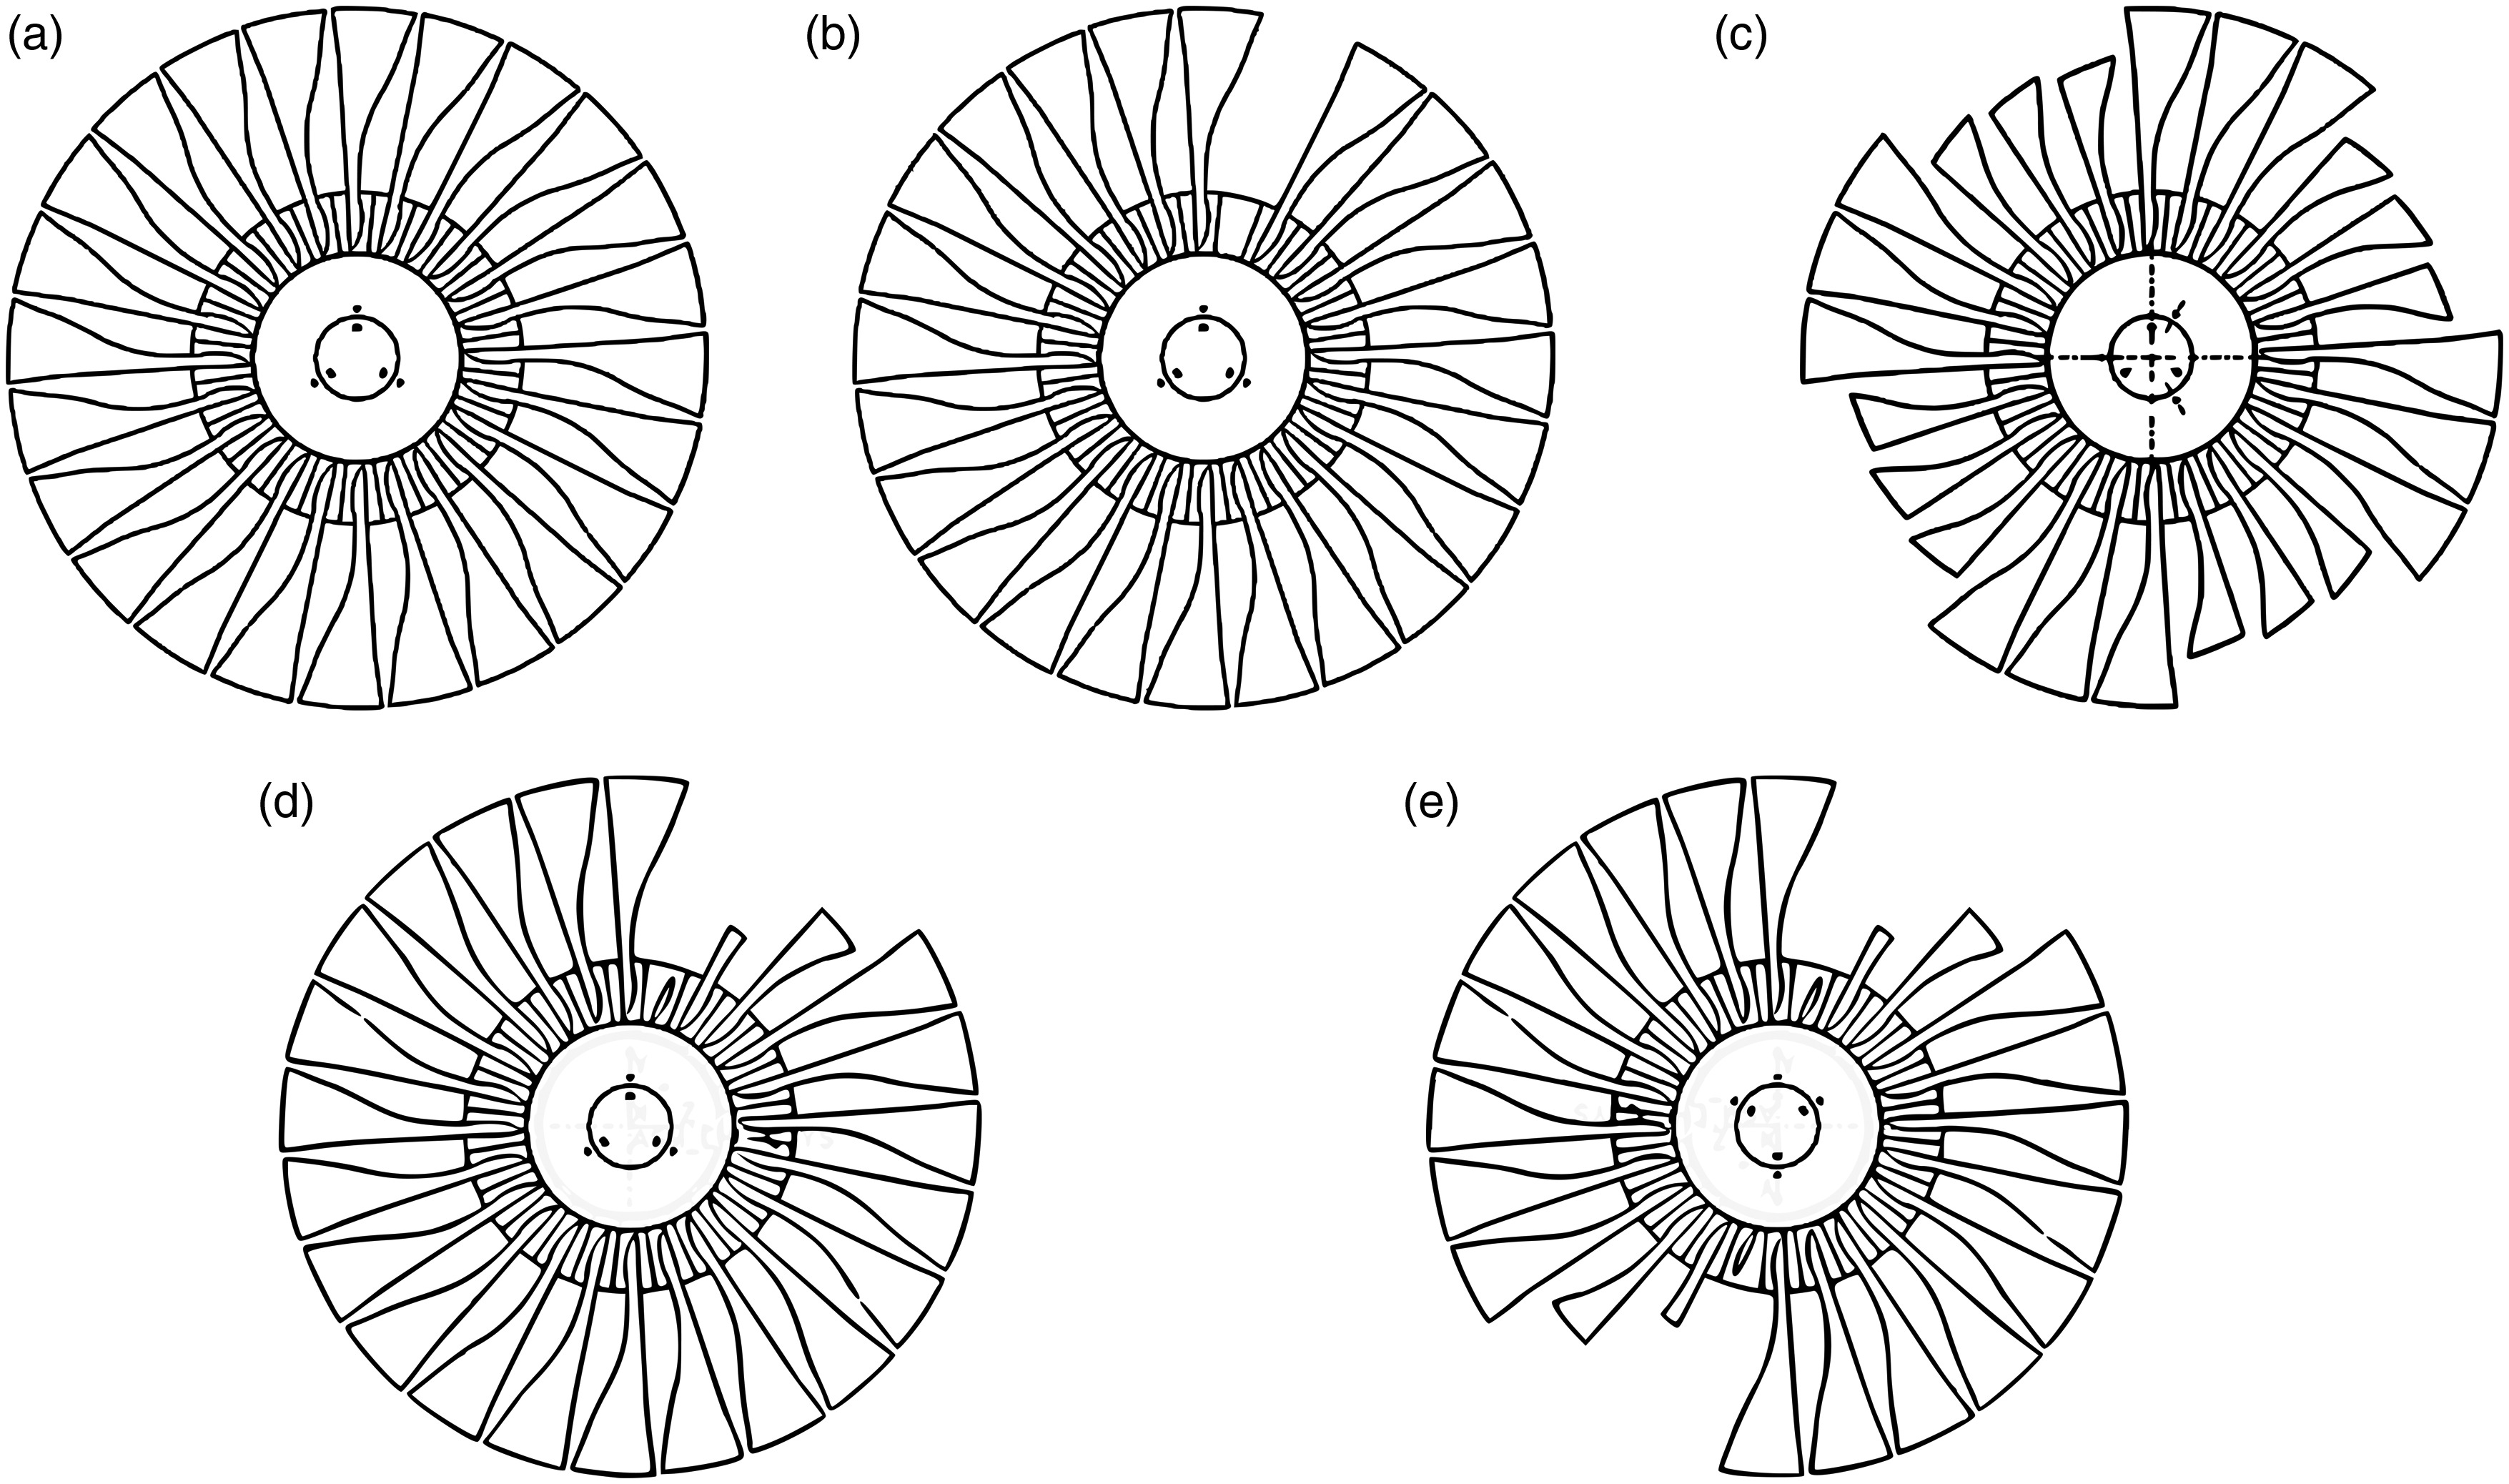
The undamaged (U) fan case (Figure 2a) was used as a baseline for the windmill flow field, and the fan blade-off (FBO) and periodic tip damage (PTD) cases in Figure 2b and c were used as the idealised damage cases that could be combined to form the SD1 flow field. These will be used to test whether the flow field of the SD1 case matches that of the FBO towards the hub, and that of the PTD towards the casing. While real fan damage might not match the SD1 and SD2 damage cases exactly, they allow investigating whether the windmill flow field for a complex damage case can be obtained from idealised damage cases. It would then be possible to predict the flow field for a fan with any damage pattern from an array of idealised damaged cases.
Table 1 shows the geometric parameters that describe each damage case, as well as their windmill operating point. The two geometric parameters chosen are the total number of damaged blades
Table 1.
Windmill operating point and key parameters for each damage case.
| U | FBO | SD1 | SD2 | PTD | |||
|---|---|---|---|---|---|---|---|
| EXP | CFD | EXP | CFD | CFD | EXP | EXP | |
| Figure number | 2a | 2b | 2d | 2e | 2c | ||
| 0 | 1 | 3 | 6 | 12 | |||
| 0 | 0.042 | 0.083 | 0.166 | 0.174 | |||
| 2.27 | 2.24 | 2.34 | 2.26 | 2.29 | 2.48 | 2.87 | |
| 0.53 | 0.60 | 0.53 | 0.60 | 0.57 | 0.50 | 0.51 | |
The windmill operating point for each case is given by the flow coefficient
Figure 3 shows the windmill operating point for each of the damage cases tested, as well as the windmill characteristics calculated as per Equation 2 for the flow coefficient
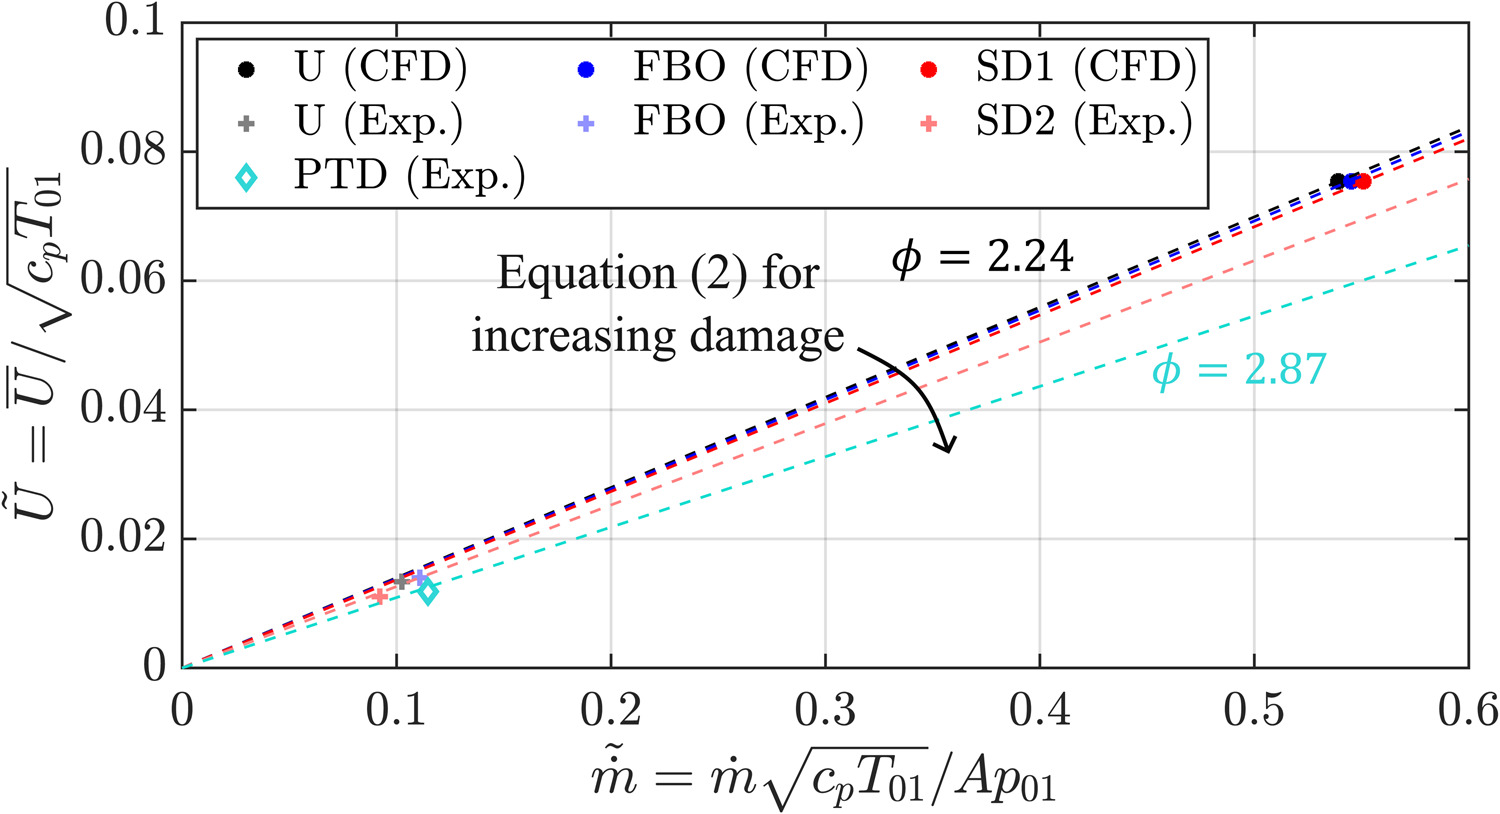
Considering the effect of the amount of damage on the blade speed, in general, the flow coefficient increases as the damaged area fraction
Computational setup
All computational cases considered in this paper were simulated using Turbostream, a solver developed by Brandvik and Pullan (2011) which solves the RANS equations on GPU cores for reduced simulation time relative CPU-ran RANS solvers. The Spalart-Allmaras turbulence model with adaptive wall functions was used. This method has been shown to produce good results for the windmill condition by Dufour et al. (2015) and Gunn and Hall (2016), and has also been used by Mohankumar and Wilson (2017) in windmill simulations with damaged blade tips. To run unsteady simulations (URANS) the dual time-stepping scheme proposed by Jameson (1991) was used. The URANS cases were ran for 3 rotor revolutions, with 150 outer timesteps per blade passing and 100 inner timesteps. The inner loop was considered converged when the continuity residual had decreased by two orders of magnitude with respect to the first inner loop timestep, and the momentum residual remained one order of magnitude lower than the continuity residual throughout the inner loop. After 3 revolutions, corresponding to 10800 outer time steps, the average mass flow, stagnation temperature and pressure and isentropic efficiency converged to within three significant figures.
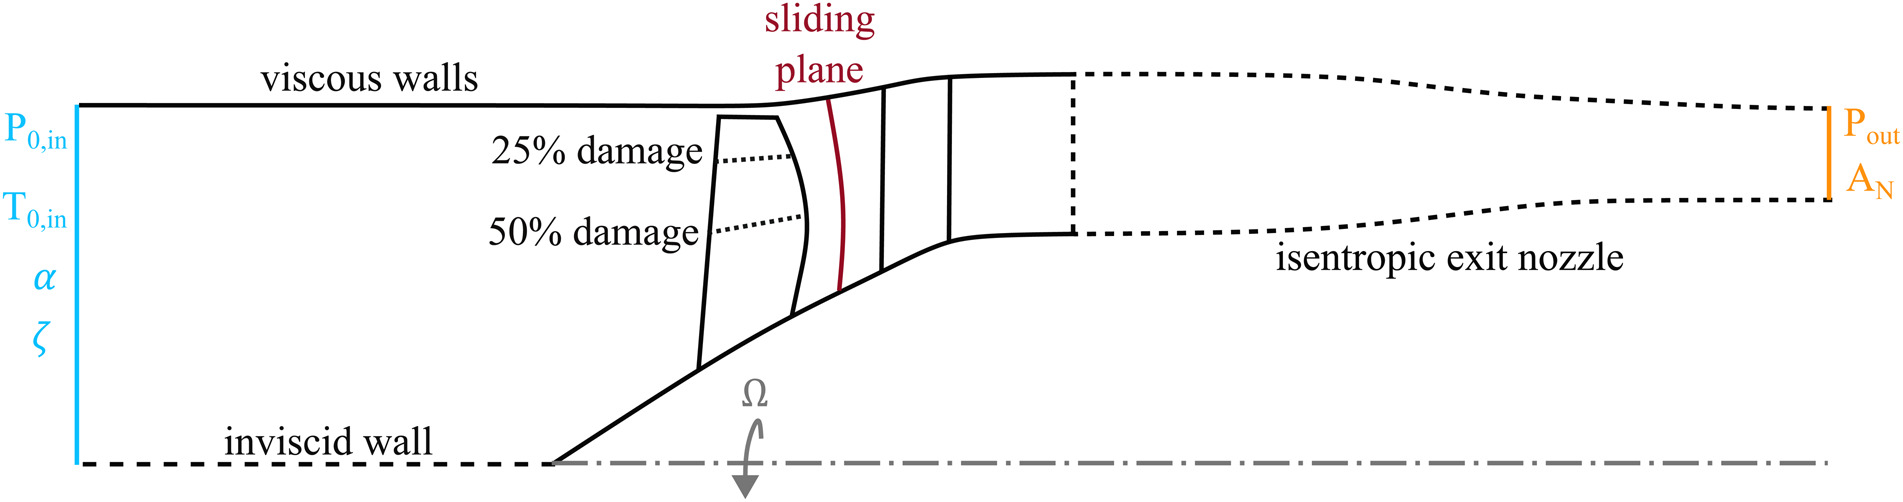
The computational domain for the URANS simulations is shown in Figure 4. To achieve the windmill operating point, the mass flow through the fan can be modified by changing the isentropic exit nozzle area
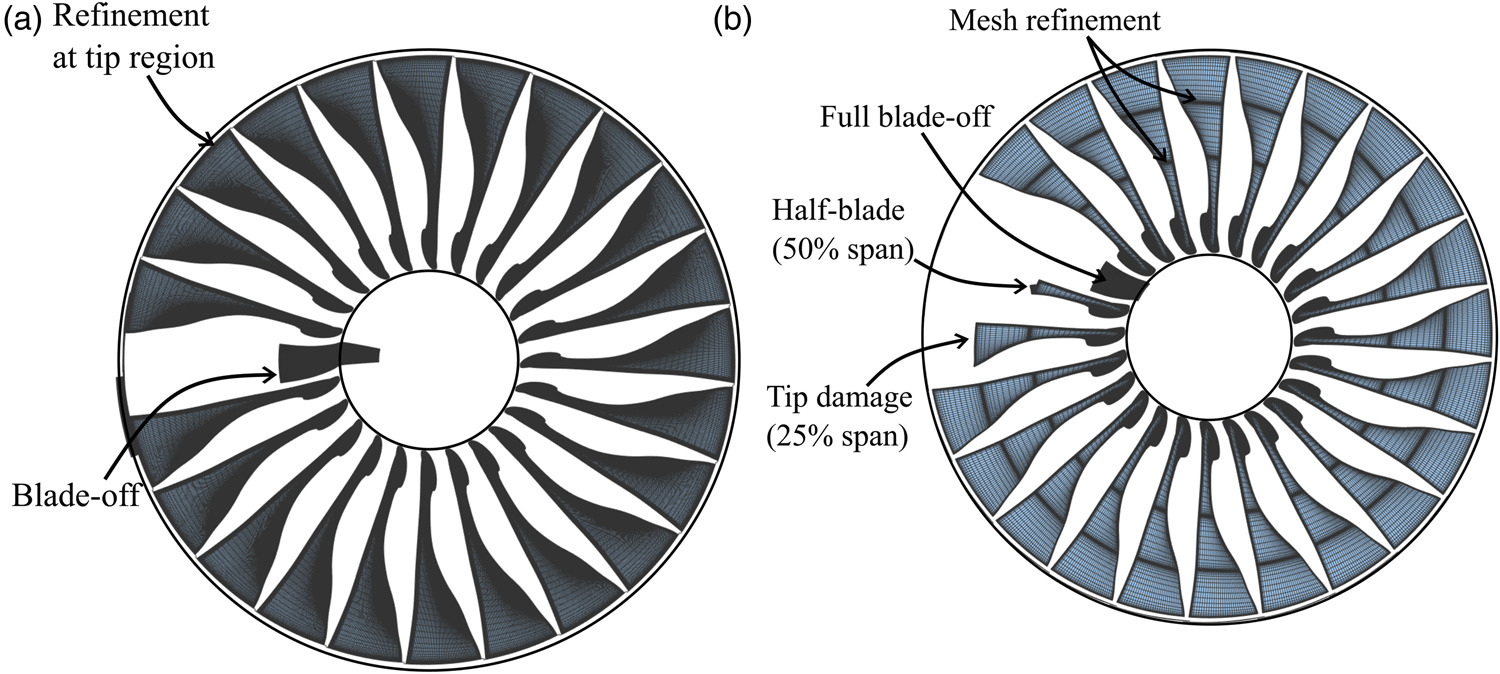
The rotor meshes used for the damaged URANS cases (FBO and SD1) are shown in Figure 5. These are multiblock structured meshes, where H-mesh blocks are placed at the inlet and exit ducts and an O4H mesh is used around the rotor blades. As both damage cases are non-axisymmetric, full-annulus simulations were required. For the FBO case, the mesh is the same as was used for the undamaged case, where the O4H blocks for one of the blades have been removed and replaced with an H-mesh block, resulting in the mesh shown in Figure 5a. Due to the need for mesh refinement in the tip region of the damaged blades, for the SD1 case the mesh points were clustered at 50% and 75% span as well as near the casing. The tip gap mesh block was then extended to the required damage location for each of the damaged blades, and the blade-off was treated in the same way as for the FBO case, replacing the O4H blocks by an H-mesh block. The undamaged (U) and fan blade-off (FBO) cases were ran with a finer mesh, with
Results and discussion
The velocity triangles for the rotor at windmill are shown in Figure 6 for an undamaged fan, showing the compressor and the turbine-style operation depending on the spanwise location. In this paper, the direction of rotation for the rotor is chosen as the positive direction, such that positive flow turning corresponds to compressor operation (positive work on flow), and negative flow turning corresponds to turbine operation (negative work on flow).
Figure 6.
Rotor velocity triangles at windmill for an undamaged fan. (a) Near hub and (b) Near casing.
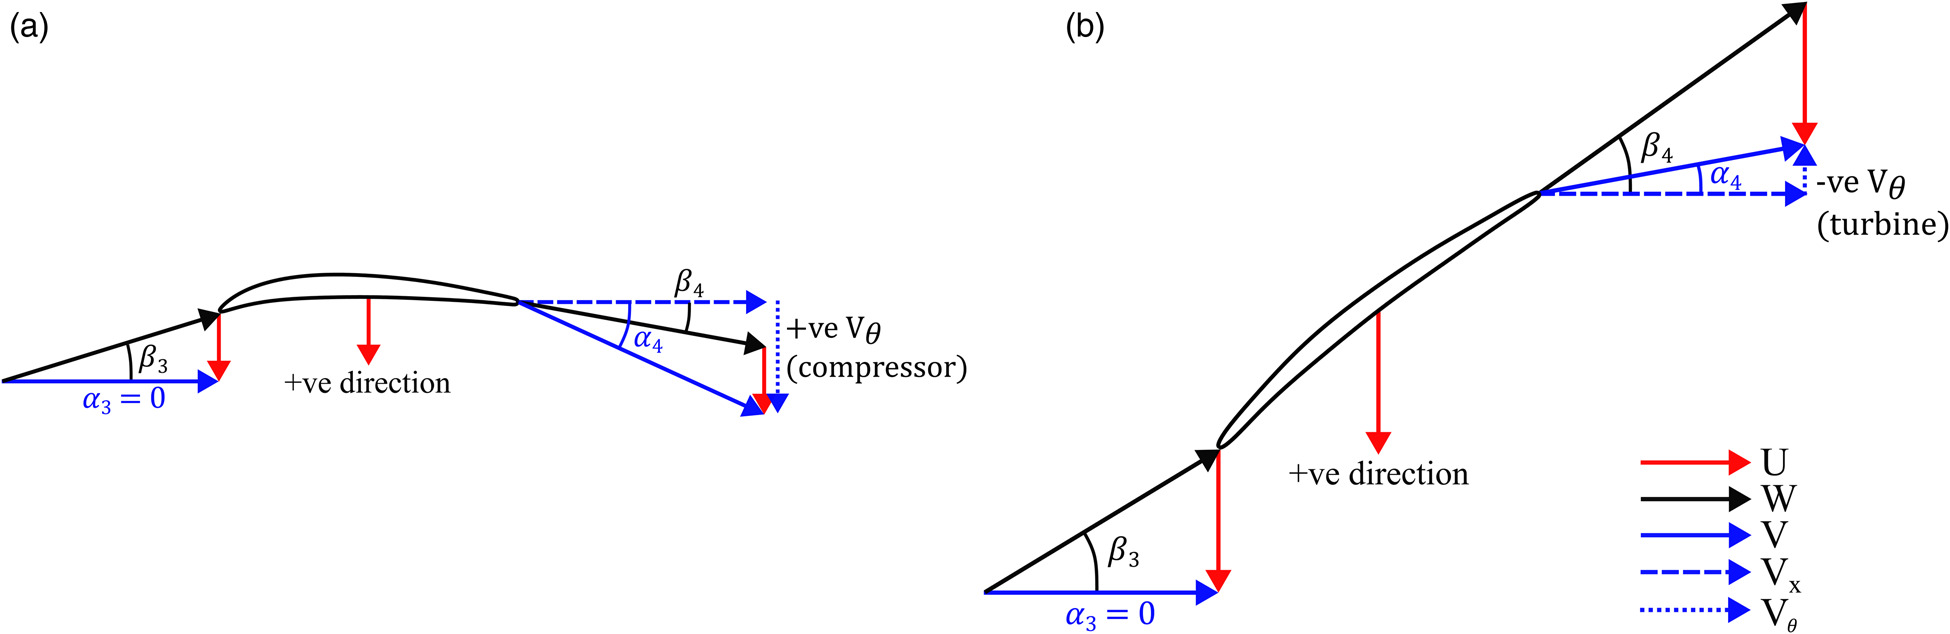
By expressing Euler’s work equation as per Equation 3, the changes to the work distribution can be considered as changes in the rotor exit axial velocity
The following sections will show how varying damage to the fan affects the axial velocity and flow turning, and the resulting work distributions.
Windmill operating point
The five-hole probe results in Figure 7 show how the overall flow field is affected by the damage cases considered. Figure 7a shows the flow coefficient, Figure 7b the axial velocity at rotor exit, and Figure 7c the rotor work output.
Figure 7.
Radial variation in rotor quantities for varying damage patterns, from five-hole probe measurements. (a) Flow coefficient. (b) Axial velocity variation and (c) Work distribution.
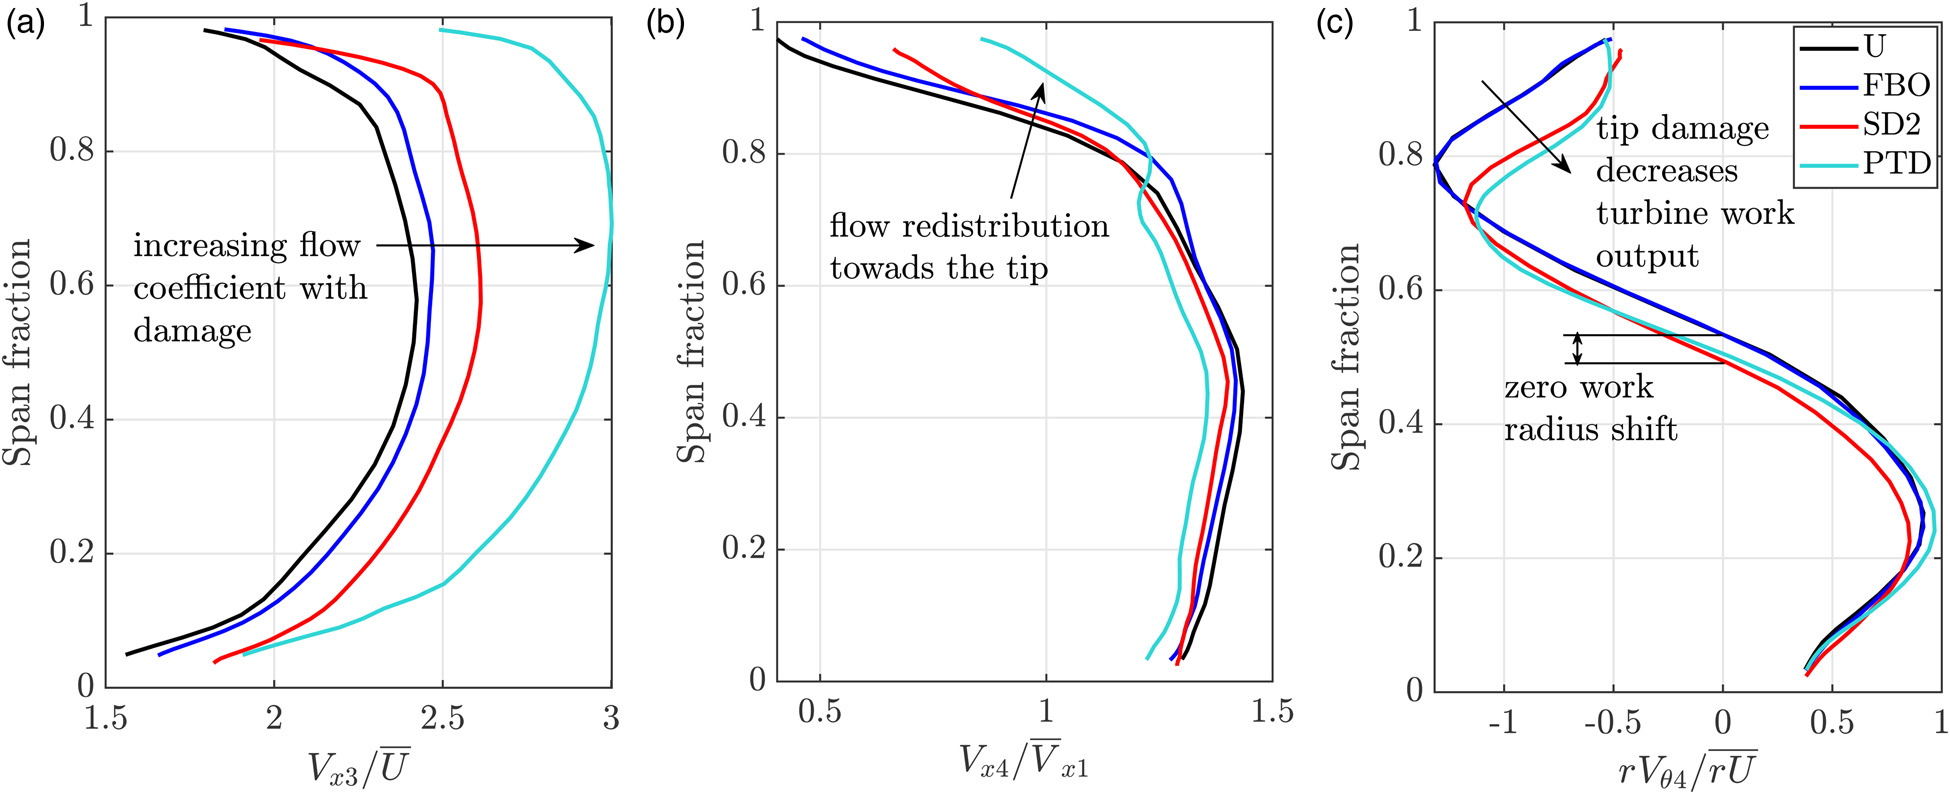
It can be observed that a single blade being removed (FBO) does not change the spanwise work distribution in Figure 7c compared to the undamaged case, and it only has a small effect on the axial velocity in Figure 7a and b. This indicates that removing a single blade increases the massflow through the fan without modifying the flow angles. This leads to the slight increase in the flow coefficient shown in Figure 3 while the blade rotational speed remains unchanged.
Both the PTD and the SD2 cases show a reduction in the turbine work output near the tip, which leads to a shift in the work distribution and thus a reduction in the zero work radius. However, in the PTD case the flow will redistribute towards the tip region, which increases the effect of the tip damage on the flow coefficient. As per Equation 4, having a lower
While the five-hole probe results provide an indication of how the work distribution and flow coefficient are being affected, it is necessary to consider how
Rotor flow field
The hot-wire measurements and the URANS results allow an assessment of how the flow field varies for individual blades (damaged and undamaged). Considering first the undamaged fan, it was shown by Medina Cassillas et al. (2025) that the rotor flow field is characterised by the formation of a vortex on the rotor blade pressure side that migrates towards the trailing edge and is convected downstream at the casing. This vortex can be identified by a region of low velocity near the casing on the blade pressure side, as well as by high streamwise vorticity
Figure 8.
Normalised rotor exit axial velocity contours for varying fan damage. (a) U (Hot-wire). (b) PTD (Hot-wire). (c) SD2 (Hot-wire) (d) U (URANS). (e) FBO (URANS) and (f) SD1 (URANS).
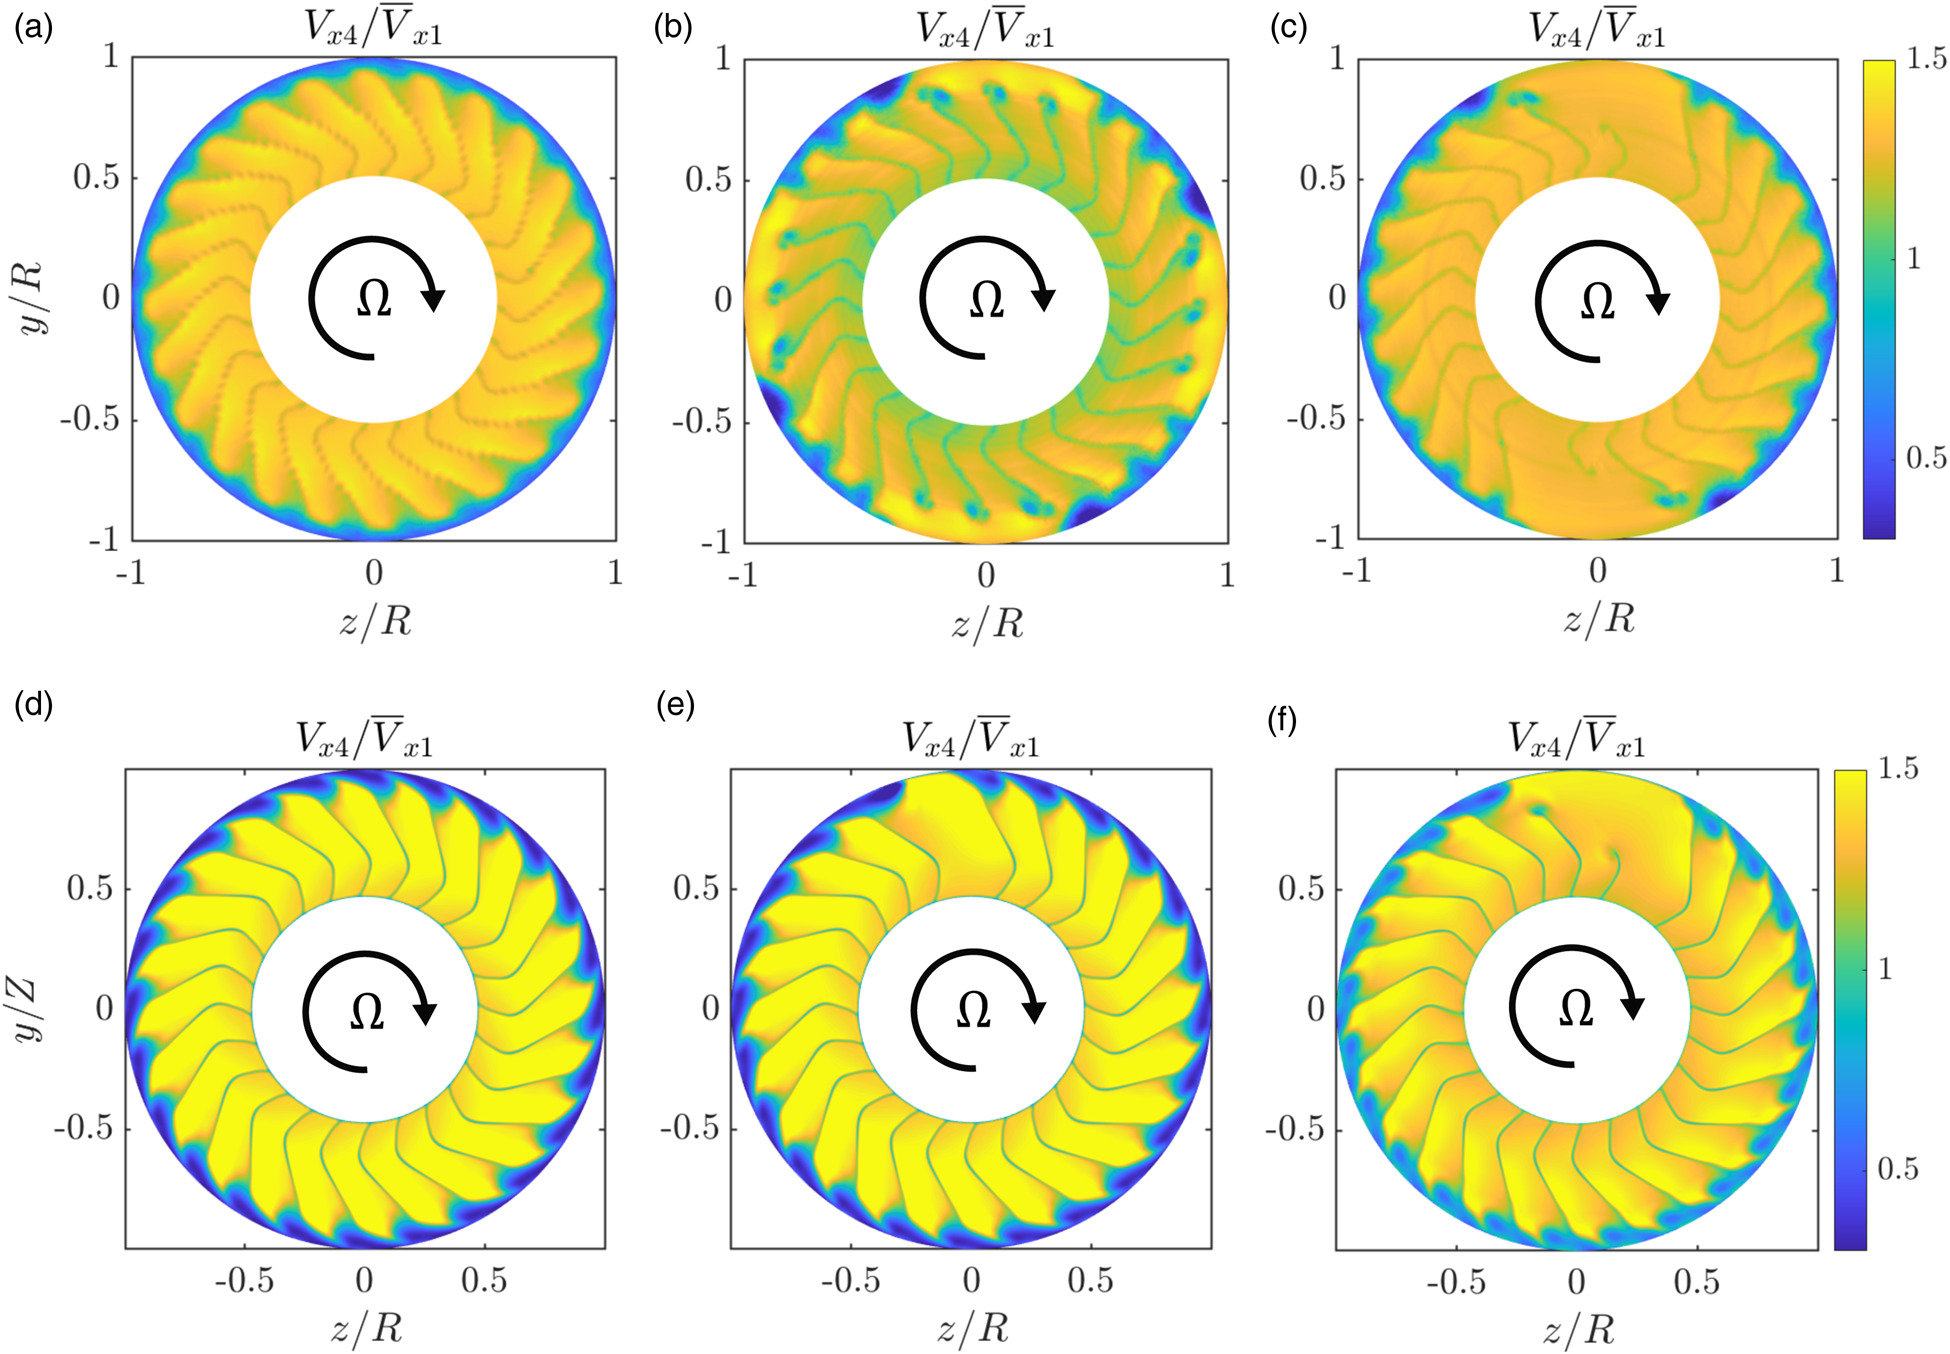
Figure 9.
Streamwise vorticity contours from URANS simulations for varying fan damage. (a) U. (b) FBO and (c) SD1.
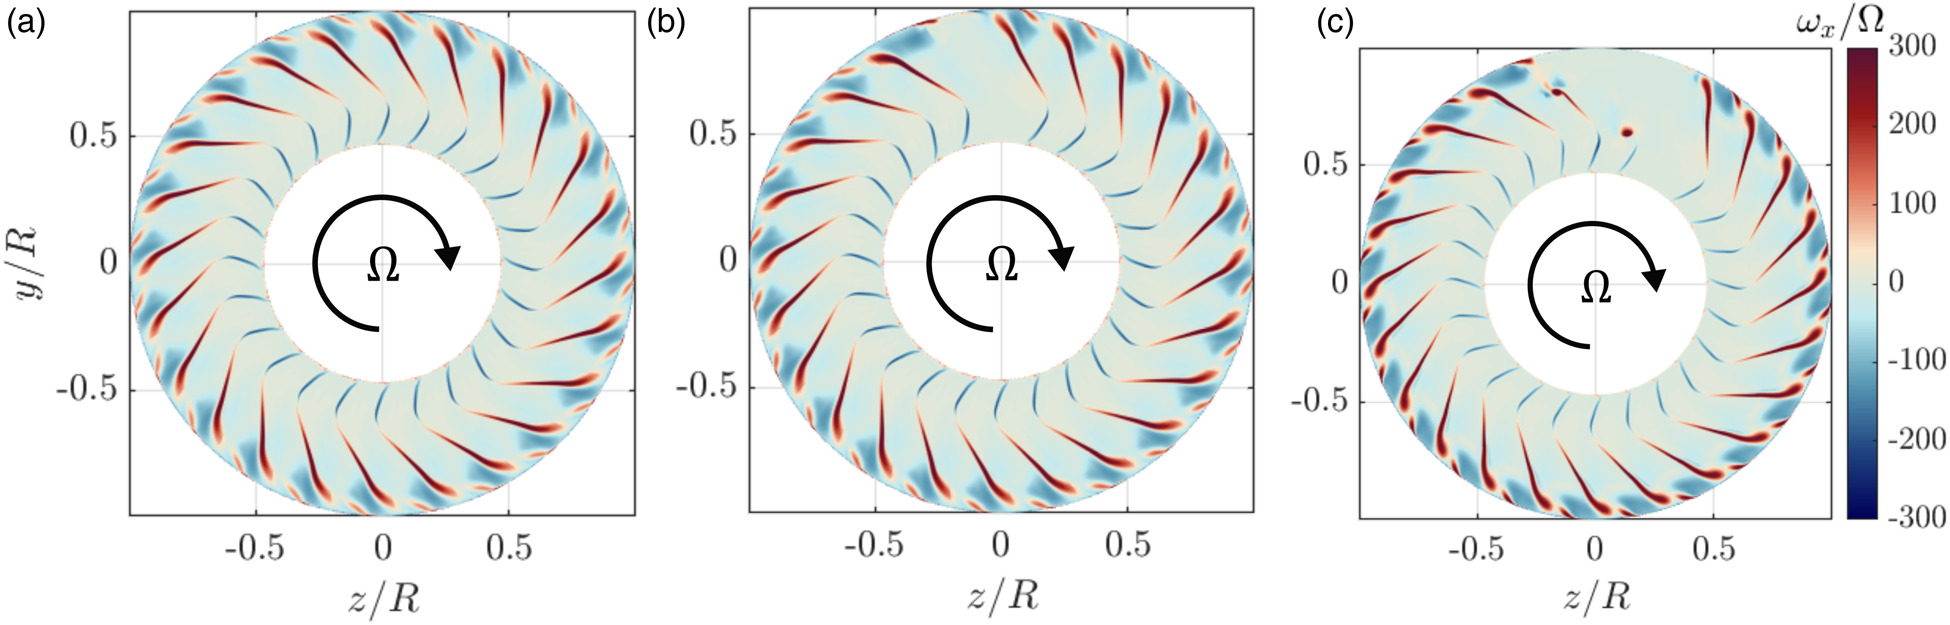
Figure 8b shows that for the PTD case, the flow field for undamaged blades is the same as for the undamaged fan, while the blades with tip damage present a region of low axial velocity and high vorticity at the tip of the damaged blade, rather than at the casing. The streamwise vortex still forms on the blade pressure side but is now contained by the high speed flow over the damaged blade tips and gets convected from the damaged blade tip. The SD2 case in Figure 8c also presents a region of low axial velocity at the 25% tip damage blade and the 50% damage blade, however, due to the damage not being concentrated near the casing, there is no increase in flow velocity above the damaged blades. This has also been shown in Figure 7b. The regions of high vorticity at both the 25% and 50% damaged blade tips in Figure 9c confirm the presence of the pressure side vortex at the tip of the damaged blades. In all damage cases, the undamaged blades present similar behaviour to those of the undamaged fan. The only difference can be observed for blades adjacent to a damaged blade, where the pressure side vortex expands into the empty passage left by the adjacent damaged blade, shown as a larger region of low axial velocity in Figure 8b, c, e and f.
In order to understand how the
Figure 10.
Rotor exit relative flow angle variation for different damage cases and spanwise locations. (a) 20% to 30% span and (b) 80% to 90% span.
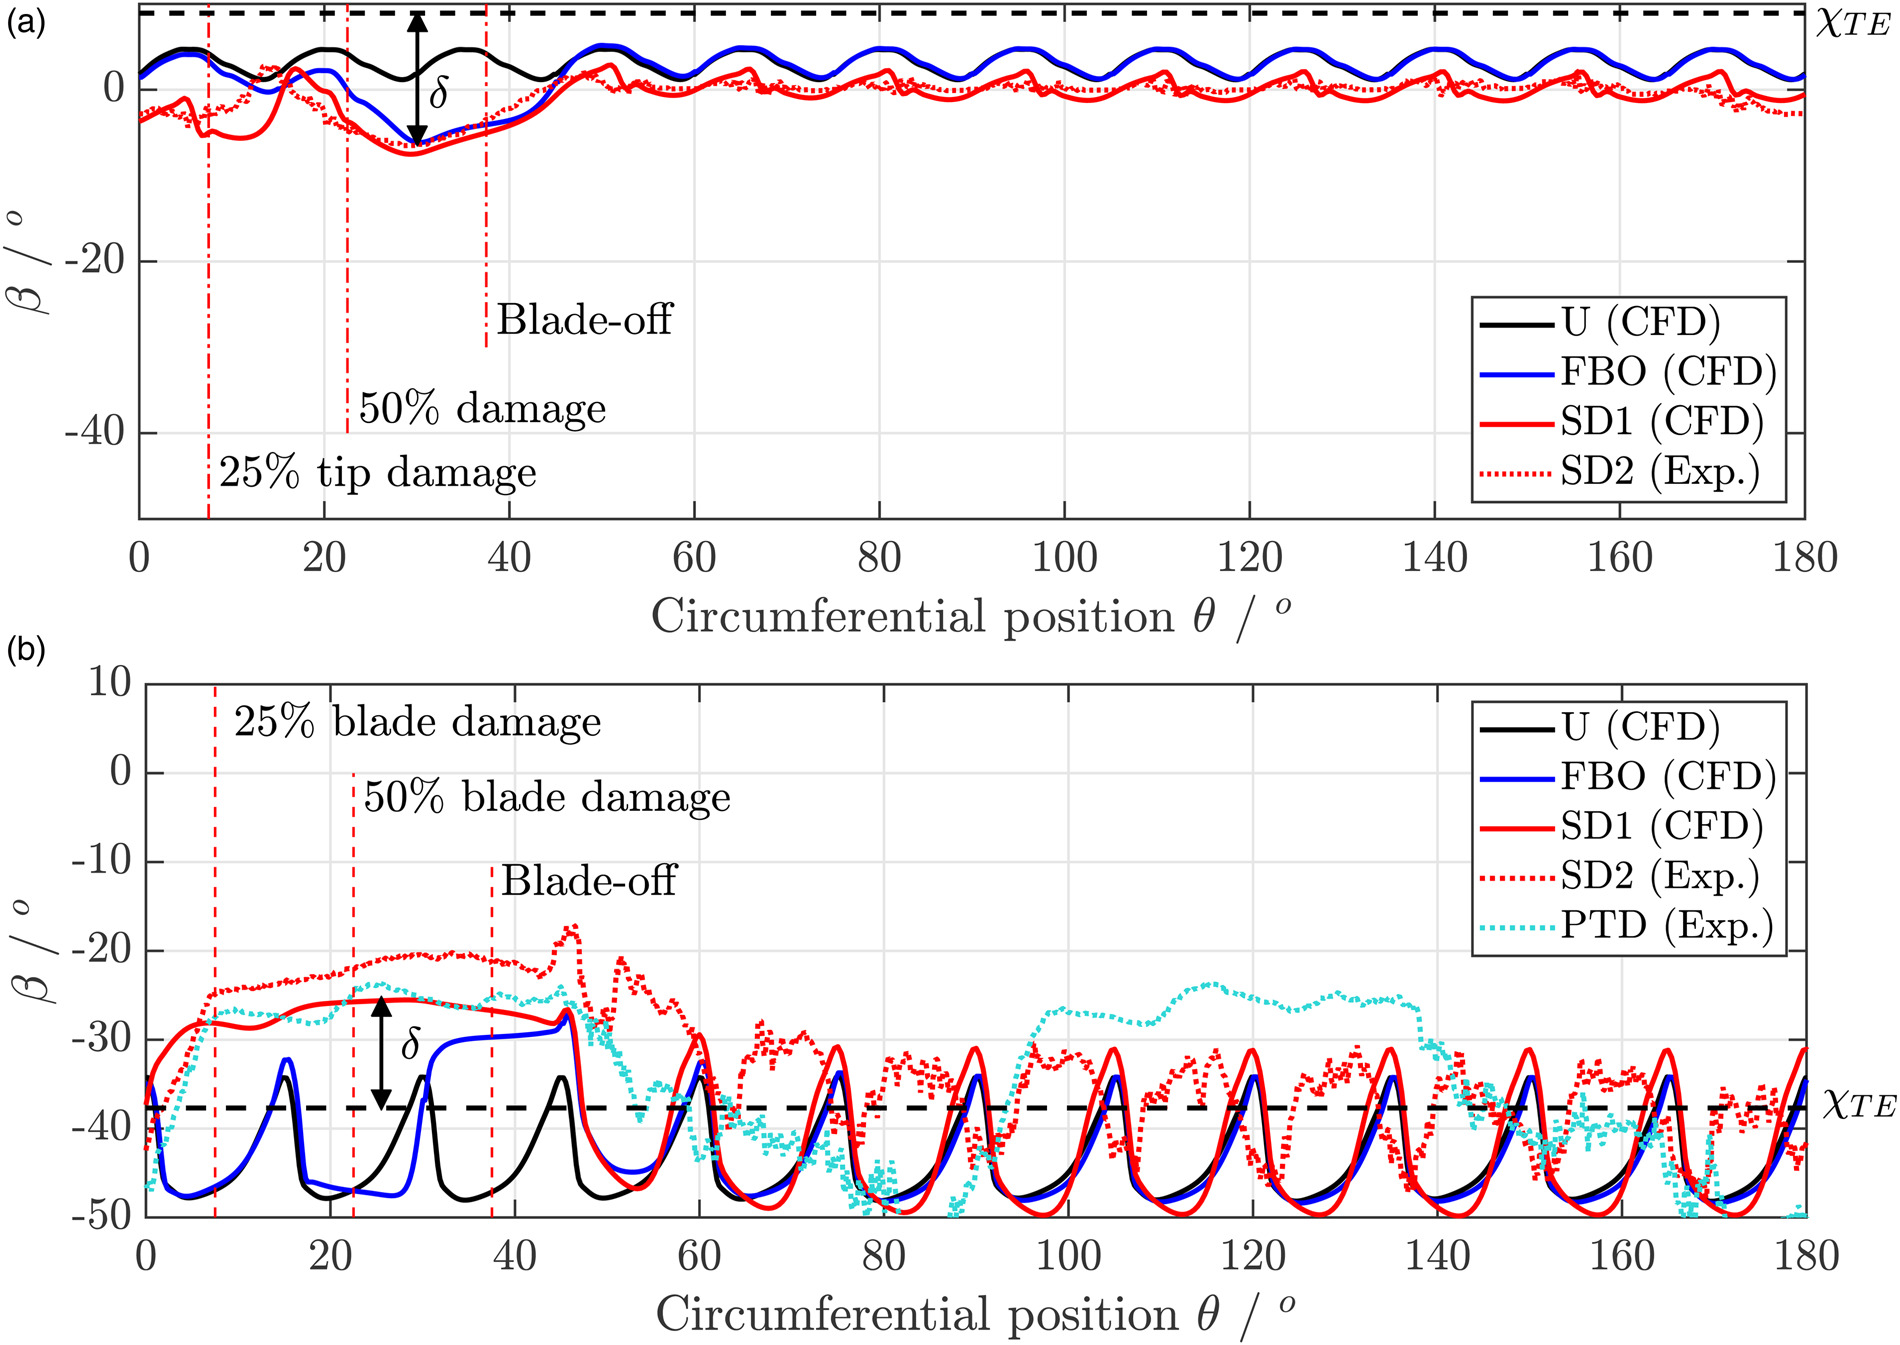
Near the hub, between 20% and 30% span,
Near the casing, in the region between 80% and 90% span, there is still only one blade missing in the FBO case, while the SD1, SD2 and PTD cases have three consecutive damaged blade tips. The flow turning in the damaged region decreases with respect to the undamaged case, to
The results in Figure 10 highlight the importance of the damage pitch-to-chord,
For a damaged fan sector, the flow turning matches well with the equivalent FBO or PTD case. In the regions below 50% span, there is a good match to the FBO turning, while towards the casing, the damaged region turning matches that measured for the PTD with three consecutive damaged blades. This implies that by combining results for idealised periodic tip damage cases such as those studied by Medina Cassillas et al. (2025), with different levels of span damage, and the FBO case considered in this paper, a relationship can be found between damaged region deviation and pitch-to-chord, as shown in Figure 11. This relationship could be used to predict how a given damage pattern will change the flow turning in the damaged region and thus how it will affect the work distribution and the fan rotational speed.
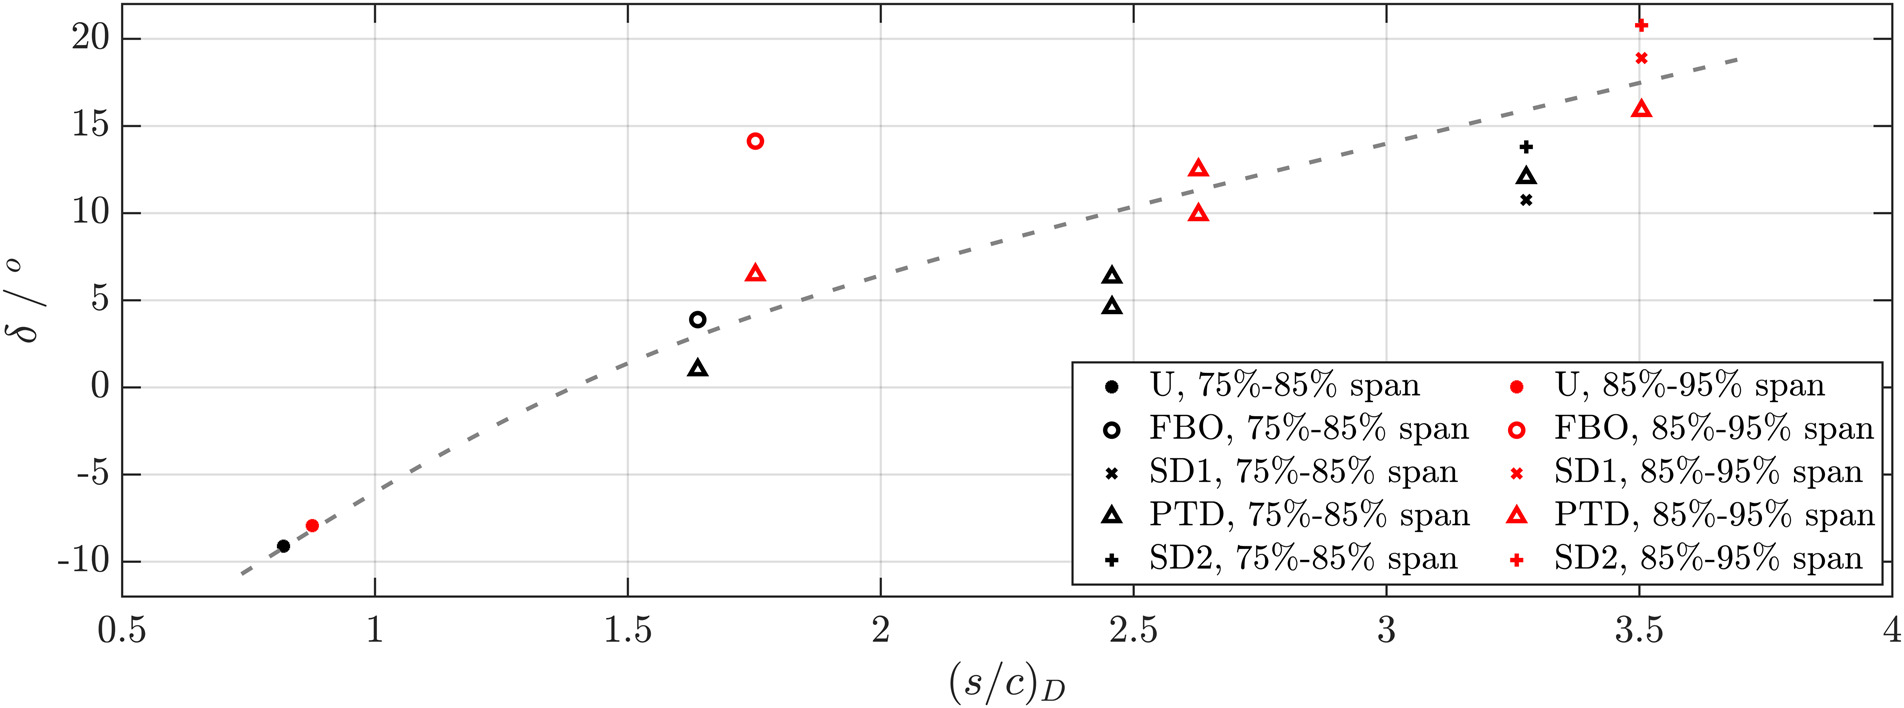
Figure 12 shows how the work output varies blade to blade when some of the blades are damaged. For the tip damage blade (25% damage), above 70% span the turbine work output decreases with respect to the undamaged blades, due to the reduced turning with three missing blade tips. Towards the hub, the behaviour of this blade is similar to the undamaged blades, however, the compressor-style work decreases with respect to the undamaged blades due to the 50% damage blade affecting the turning in the passage.
Figure 12.
Radial work distribution variation for blades in the sector damage case from URANS results.
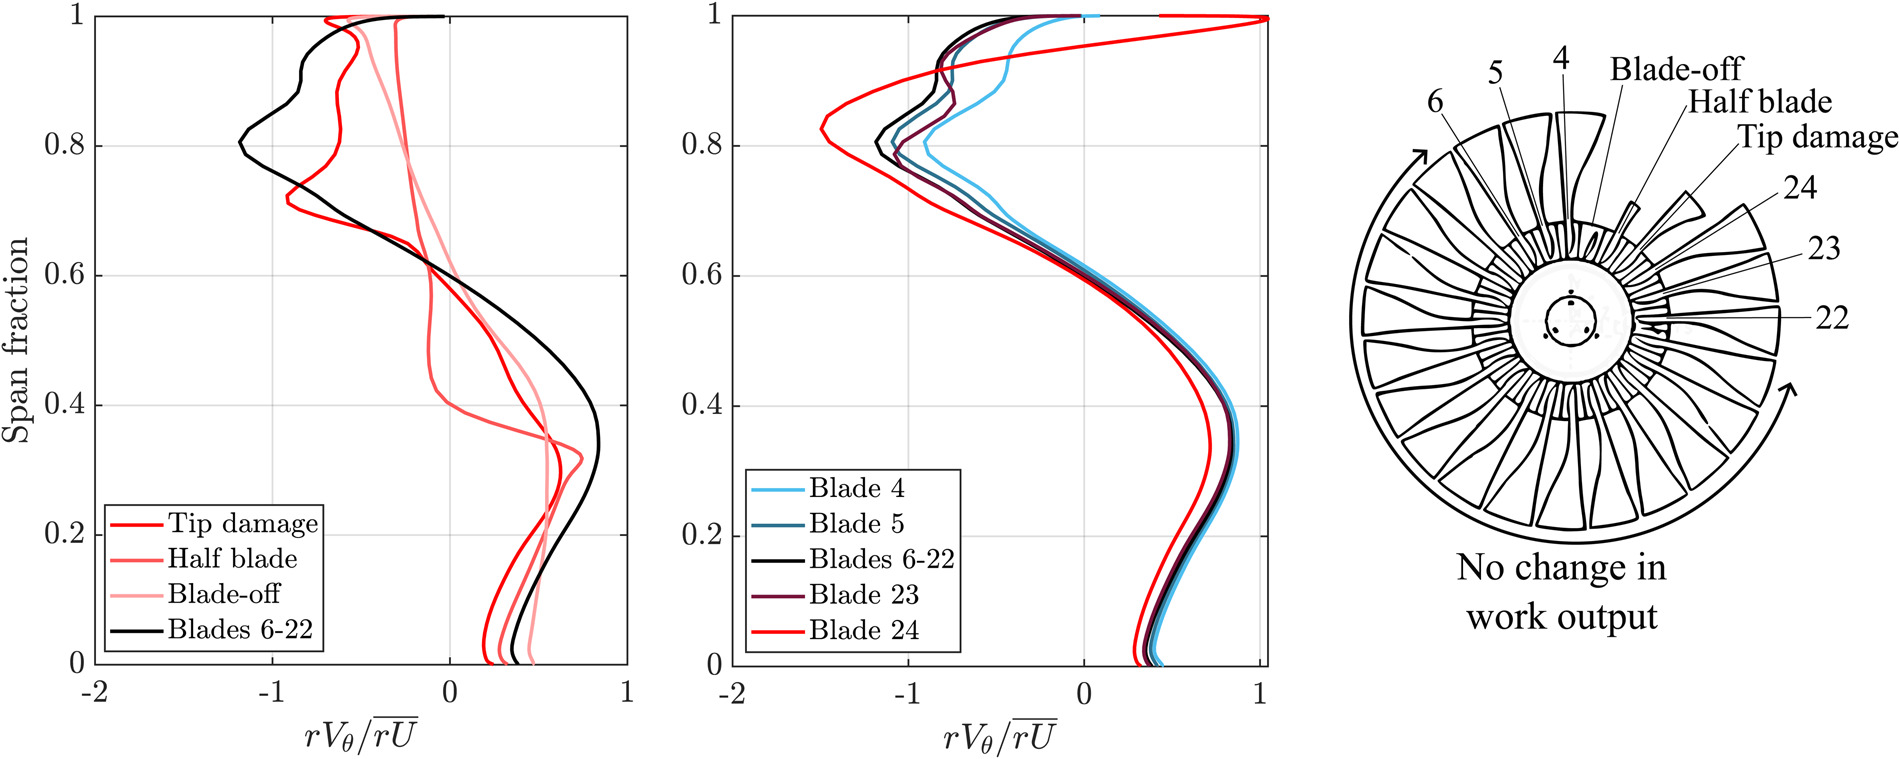
The half blade (50% damage) operates entirely as a compressor, with the flow above the damage being turned by the adjacent blades and therefore producing a small amount of turbine-style work output. In the blade-off region, the flow continues to be turned by the adjacent blades such that near the hub the flow turning is positive and towards the casing the flow turning is negative. However, the work output in this region is significantly lower than for undamaged blades.
As the main effect of the damage is to remove some amount of turbine work, this must be balanced by the adjacent undamaged blades for the fan to remain at the windmill condition. The damaged sector therefore influences the work distribution for the two blades adjacent to the damage on either side, labelled in Figure 12. Blade 4, which has the suction side adjacent to the blade-off passage, is affected by the reduced turning in the damaged region such that the turbine-style work slightly decreases near the casing. The following blade, Blade 5, moves towards the undamaged blades work output (Blades 6–22).
Blade 24 has the pressure side adjacent to the damage. As shown in Figure 8, the pressure side casing vortex for this blade expands into the damaged region leading to reduced flow velocity. This reduces the work output near the casing significantly, leading to the region of positive work output above 90% span. However, below the casing vortex, this blade is still providing significant turning of higher velocity flow which redistributes towards the tip-damaged blade. This leads to high turbine-style work output. Blade 23 again moves towards the undamaged blade distribution.
Losses and blockage
The damage also impacts the losses through the fan stage, which set the mass flow through the fan stage, and therefore the point along the windmill characteristic at which the fan is operating (Gunn and Hall, 2016). Losses are computed for the rotor and stator using the entropy loss coefficient
The overall entropy loss coefficients for the rotor and stator rows for each of the cases considered are shown in Figure 13. The rotor loss decreases as the amount of damage increases, with a clear decrease in the loss between the fan blade off case and the damaged sector case. This is because rotor loss is dominated by the presence of the pressure side casing vortex, which causes high mixing loss, and this vortex is reduced when it forms at damaged blade tips.
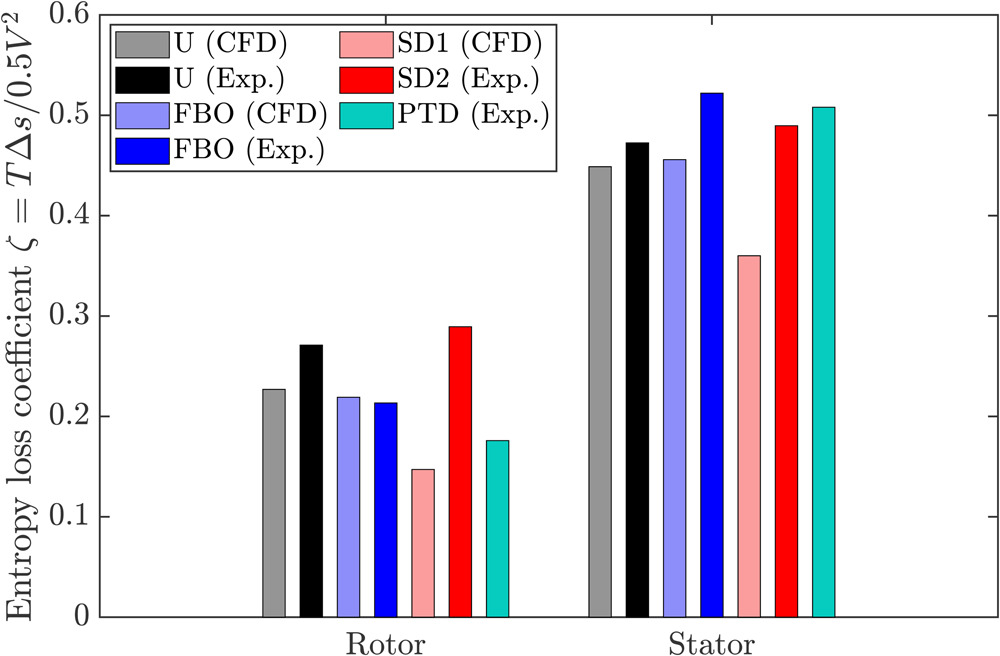
Figure 14 shows that the rotor loss is directly related to the blocked area
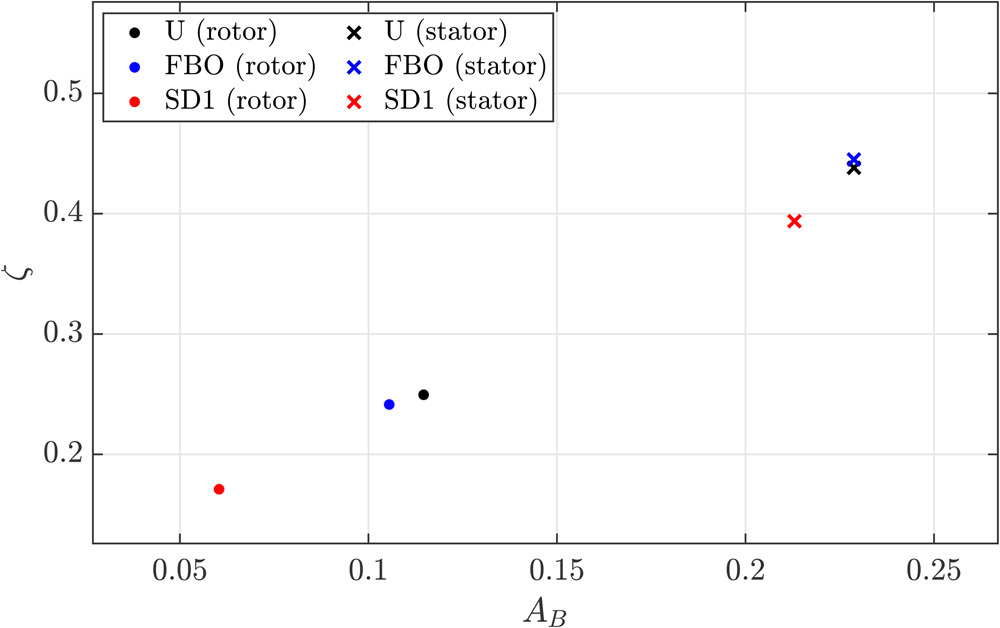
Considering the stator, previous work has determined that the flow field is characterised by a large pressure side separation that leads to high loss and blockage. This is reflected in Figure 13, where the stator has an entropy loss coefficient which is approximately double that of the rotor in all cases, dominating the stage loss. The blockage is also much higher for the stator than for the rotor for all damage cases, with
It was shown in Medina Cassillas et al. (2025) that damage to the rotor tips led to a radially inward shift in the stator peak loss location due to the competing effects of a reduced rotor blade speed and less turbine work at the damaged blade tips and thus more axial flow. However, this was shown to have little impact on the overall stator loss. The damage cases considered in this paper alter the stator blockage more significantly. Figure 15 shows that for the FBO and the SD1 cases the stator blockage is reduced for the passages downstream of the damage. This is caused by the flow approaching the stator passage being more axial over the whole span when rotor blades are damaged. While in the SD1 case this reduction in stator blockage also leads to a reduction in the loss, the FBO stator loss remains almost unchanged from the undamaged case, as shown in Figure 14. The results in Figures 14 and 15 therefore show that rotor damage extending towards the hub impacts the stator blockage more than damage in the tip region. The effect on stator blockage and loss is small in the case of a single blade-off compared to a damaged sector.

Conclusion
The results presented have led to the following key findings regarding how damage impacts the windmill operating point, rotor work output and fan stage loss:
Damage near the rotor tip affects the windmill flow coefficient much more than damage that extends towards the hub. For a case with damage to a sector representing a fan blade-off event, the decrease in windmill rotational speed was 5.9%.
Losses in both the rotor and stator depend on the flow blockage caused by regions of flow separation and high mixing. Damage reduces the blockage and therefore the loss in both rows.
The rotor work distribution for a fan at windmill is determined by the flow turning and the axial velocity at rotor exit. The flow turning in the damaged area of a fan can be related to an equivalent idealised damage case.
Fan blades adjacent to damaged regions have a significant impact on the rotor work through the presence of the casing pressure side vortex.
Nomenclature
FPR
Fan Pressure Ratio
FBO
Fan Blade-Off
Number of damaged blades
Casing radius
Damaged blade tip radius
Damaged fan face area ratio
Flow coefficient,
Work coefficient,
Non-dimensional radius
Non-dimensional blade speed,
Non-dimensional mass flow rate
(U)RANS
(Unsteady) Reynolds-Averaged Navier Stokes
Fan rotational speed
Entropy loss coefficient
Absolute swirl angle
Relative flow angle
Flow velocity
Axial flow direction
Tangential flow direction
Streamwise vorticity,
Blade metal angle
Deviation angle
Damage pitch to chord ratio
Number of consecutive damaged blades
Number of blades
Blade chord
Entropy
Blocked area ratio