
Introduction
The International Air Transport Association (IATA, 2017) forecast that in 2018 the total fuel bill for airlines would be $156 billion which is approximately 20% of the average operating costs. This level of expenditure, combined with the drive to reduce greenhouse gas emissions, is a large incentive to reduce fuel burn. There are a number of avenues being explored to reduce this cost, for example reduced airframe drag and optimised flight plans. Improvements in aero-engine efficiency will also lead to reduced fuel burn through more efficient combustion and improved component aerodynamics. This paper focuses on understanding and quantifying how geometric features associated with the construction and assembly of compressor blade rows affect the overall aerodynamic performance.
The construction and assembly of an axial compressor blade row introduces a number of geometric features that are likely to be undesirable from an aerodynamic standpoint. For example, a complex leakage path exists beneath the stator-shroud due to the necessary clearance between it and the rotating assembly. While the effect of shroud leakage is usually considered in the design, it is not always fully modelled and therefore the complexities of the leakage flow rate and the whirl pick-up may not always be reliably captured.
Additional geometric features are introduced during manufacture because the individual stator blades, typically including integral hub and casing platforms, are welded together at the casing in groups of 5–8 blades to form a vane-pack. The hub platforms are not welded together to allow for the effects of vibration and thermal expansion. This results in an axial inter-platform gap at the hub between each blade passage, which is estimated to be up to 1% of pitch. Further, due to manufacturing tolerances, the hub endwalls within the vane-packs can have misalignments along the inter-platform gaps resulting in a step in the flow path which is estimated to be in the order of 1% of span. When the vane-packs are assembled into a row within the aeroengine there are gaps between the packs to allow for vibration and expansion. These vane-pack gaps are estimated to be of the order of 10% of pitch. Finally the hub platforms are located in a circular c-ring, which is usually manufactured in two parts, also resulting in a leakage flow path. None of these gaps and steps are routinely considered during the aerodynamic design.
This paper will first focus on the impact of the stator-shroud leakage flow and the associated whirl pick-up on the blade row aerodynamic performance. Then the impact of the real geometry features, such as inter-platform gaps, vane-pack gaps and misaligned endwalls, on the aerodynamic performance will be investigated.
Literature review
The causes of stagnation pressure loss within turbomachines have been the subject of extensive study. Denton (1993) classified the losses within blade rows into three categories: profile, leakage and secondary losses. However the interaction of the leakage and endwall flows can make it difficult to separate leakage and secondary losses. A review of secondary flows and the resulting losses was produced by Sieverding (1985) and a study of the three-dimensional nature of compressor flowfields was undertaken by Gbadebo et al. (2005). These papers show how the boundary layer flow on the endwalls is overturned relative to the mainstream flow by the blade pressure field. The resulting secondary flows interact with the blade suction surface forming loss cores in the corners between the blade and endwalls.
There have been a number of studies into the effects of shroud leakage flows. LeJambre et al. (1998), Heidegger et al. (1996) and Wellborn and Okiishi (1998) investigated them in representative compressor environments. A parametric study into the effects of the shroud leakage flow on the blade row losses was undertaken by Demargne and Longley (2000) using a linear cascade. All of these studies showed that any low axial momentum flow impinging on to the hub endwall increases the secondary flow within the blade passage. This increases the interaction of the endwall flows with the blade suction surface leading to larger loss cores and lower efficiencies. However, the studies also show that the tangential momentum of the leakage flow (due to whirl pickup in the shroud cavity) can help to resist the cross passage movement of the secondary flows in a compressor.
Studies into the impact of endwall geometry features such as gaps and steps have predominately been done on turbine geometries. Reid et al. (2007) investigated the impact of inter-platform gaps and found that they could reduce stage efficiency by 0.5–1.5%. Grewe et al. (2014) showed how steps along an inter-platform gap, regardless of their orientation, will increase the losses in a blade row.
Within compressors larger scale geometry features such as those associated with casing treatment have been investigated by Johnson and Greitzer (1987) who showed that the adverse pressure gradient in a blade row caused flow within a slotted hub to be ingested near the trailing edge and reinjected near to the leading edge. Leishman et al. (2007) studied the impact of large scale bleed off-takes located within a blade passage and described how, even with no net bleed, the flow moved in and out of the bleed slots. However, other than profiled endwalls, to the authors’ knowledge the impact of gaps and steps within compressor blade rows have not been studied in detail.
Methodology
The real-geometry features described above are investigated through a combination of experimentation using a linear cascade and computational investigations.
Experimental setup
The measurements were undertaken using a linear cascade that has prismatic blades. The two-dimensional blade profile was extracted from an existing three-dimensional blade which had been developed for a low-speed three-stage axial compressor investigation of an aero-engine geometry. The two-dimensional section chosen was from 15% of span above the hub as this gives a representative pressure field on the hub platform. Details of the blading are given in Table 1. The aerofoils were wire cut from aluminium and slotted into 3D printed hub platforms. The centre two blades within the linear cascade can be removed allowing different platform geometries to be tested.
Table 1.
Cascade blade geometry.
| Span | 225 mm |
| Chord | 199.5 mm |
| Pitch to chord ratio | 0.55 |
| Blade inlet metal angle | 56.9° |
| Inlet flow angle | 45° |
| Blade exit metal angle | 11.7° |
| Reynolds number (chord) | 3.50 × 10⁵ |
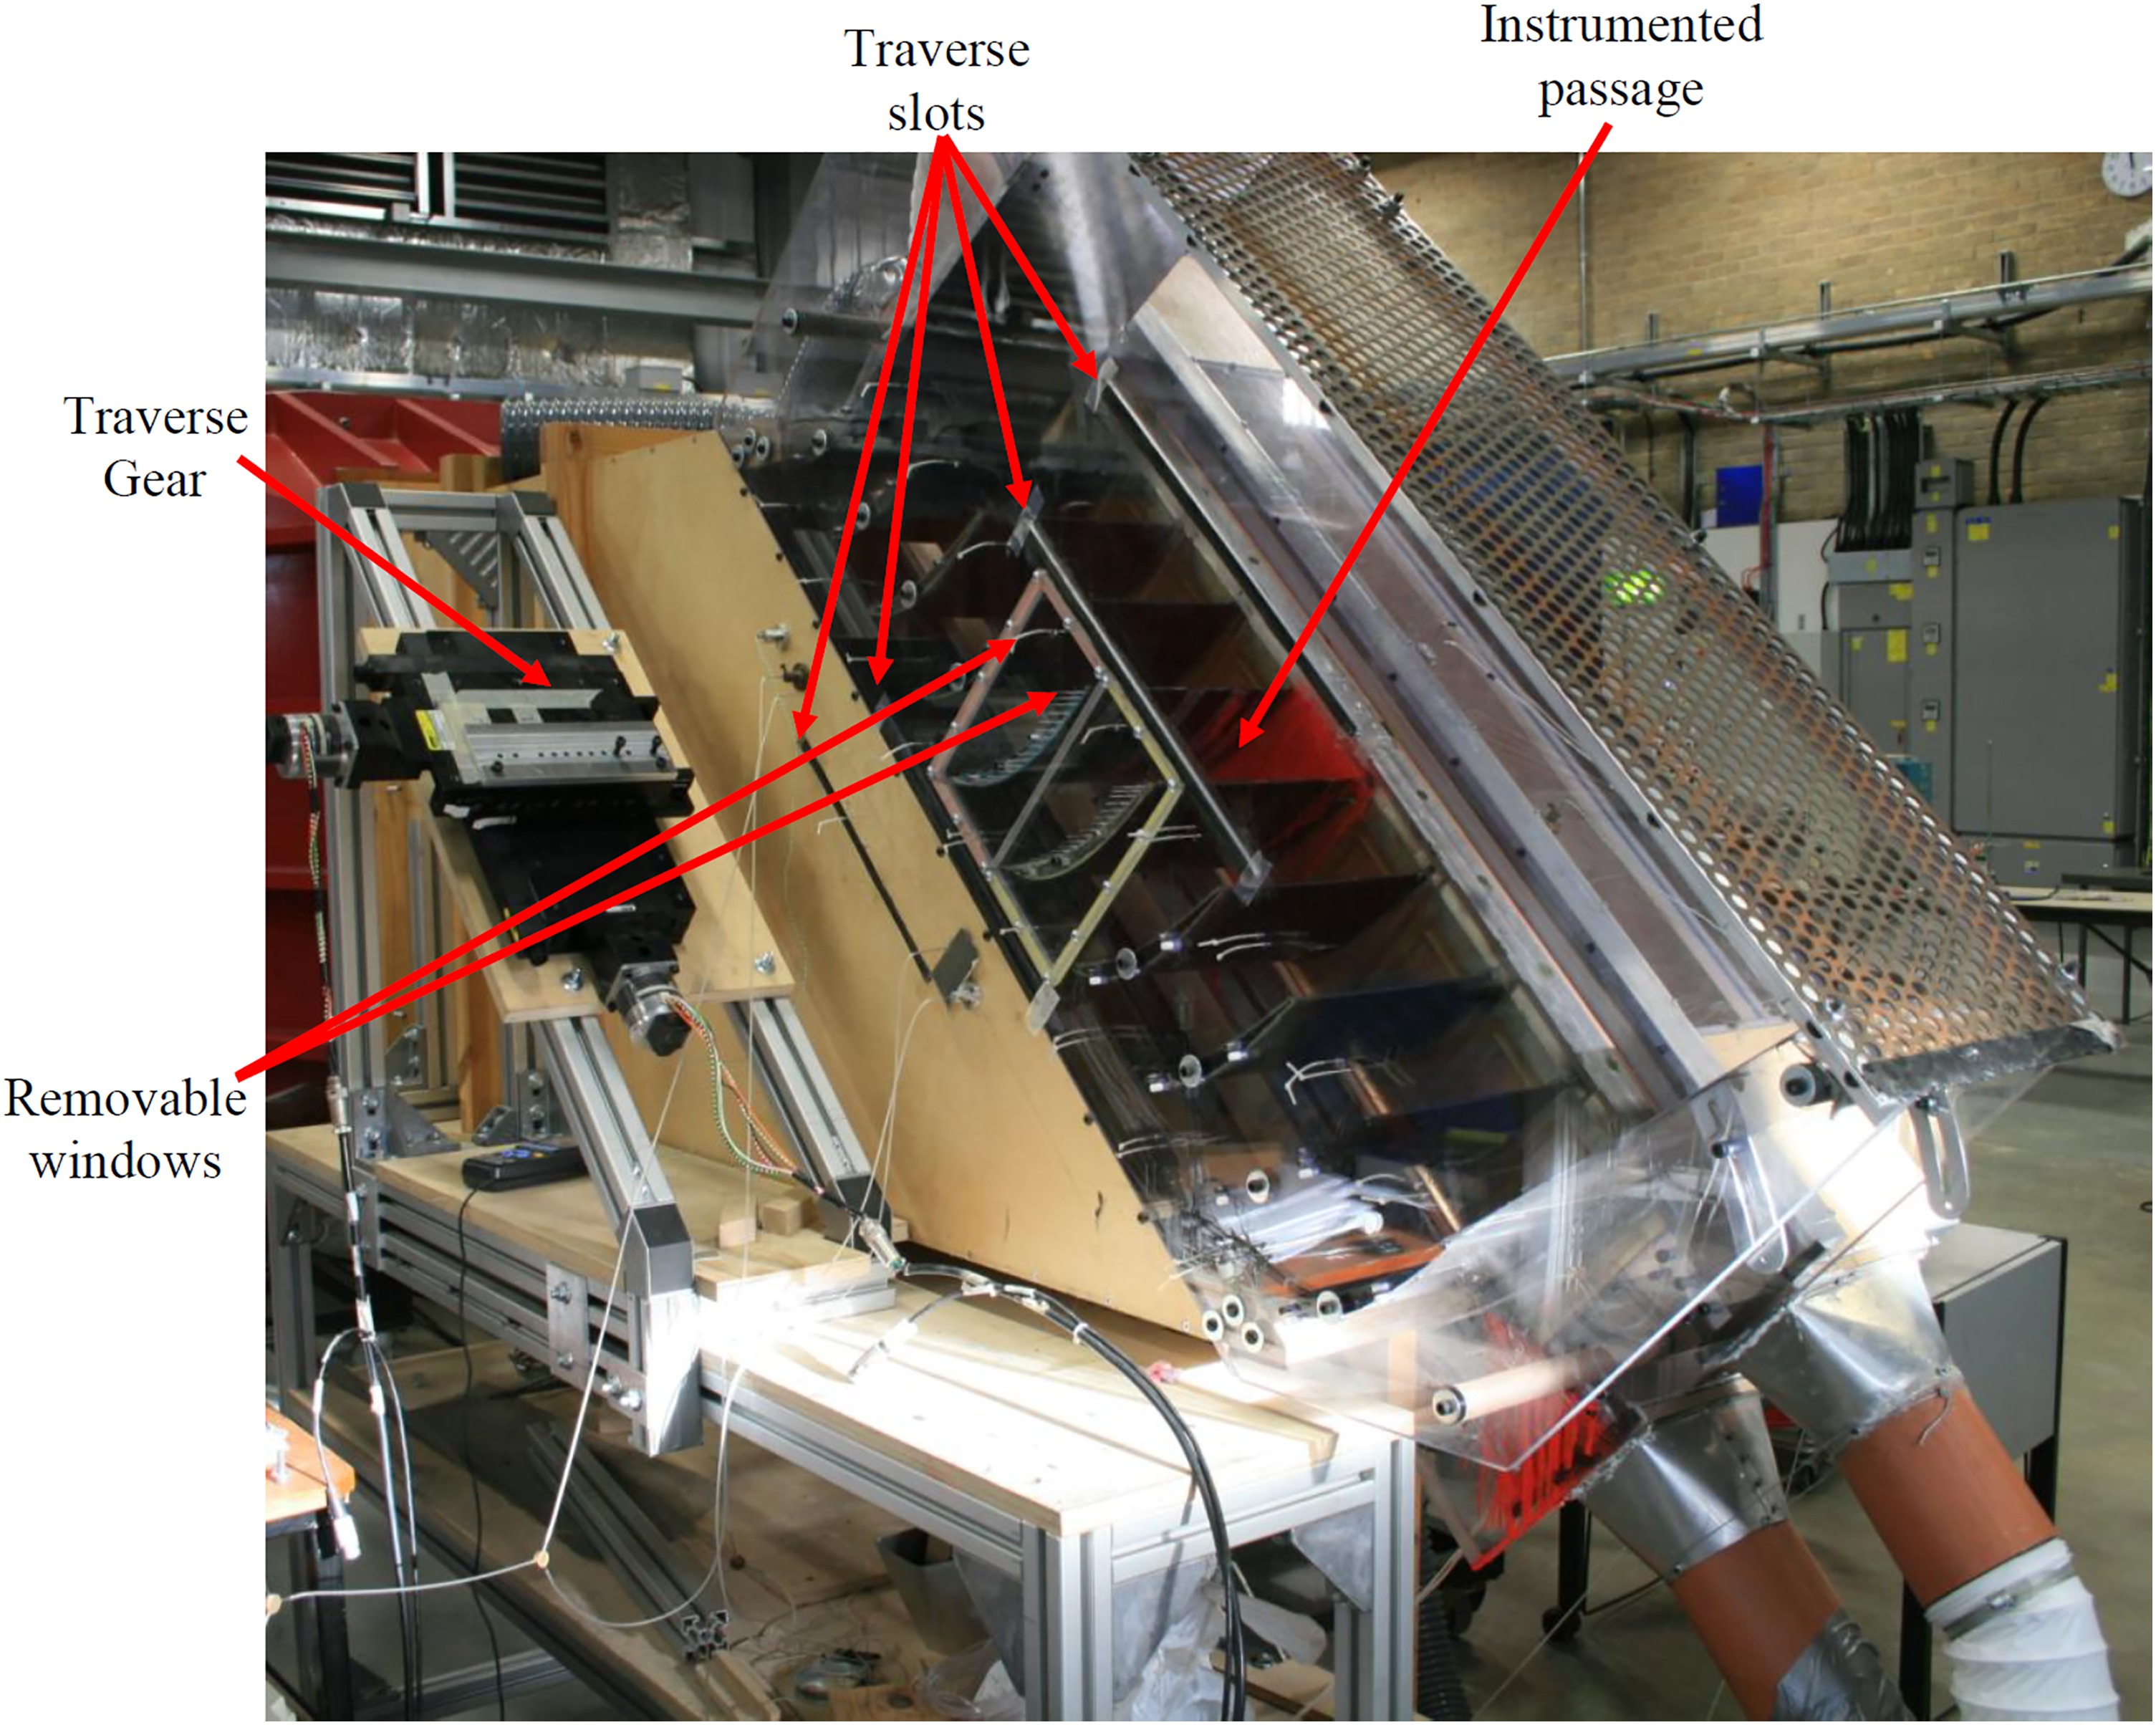
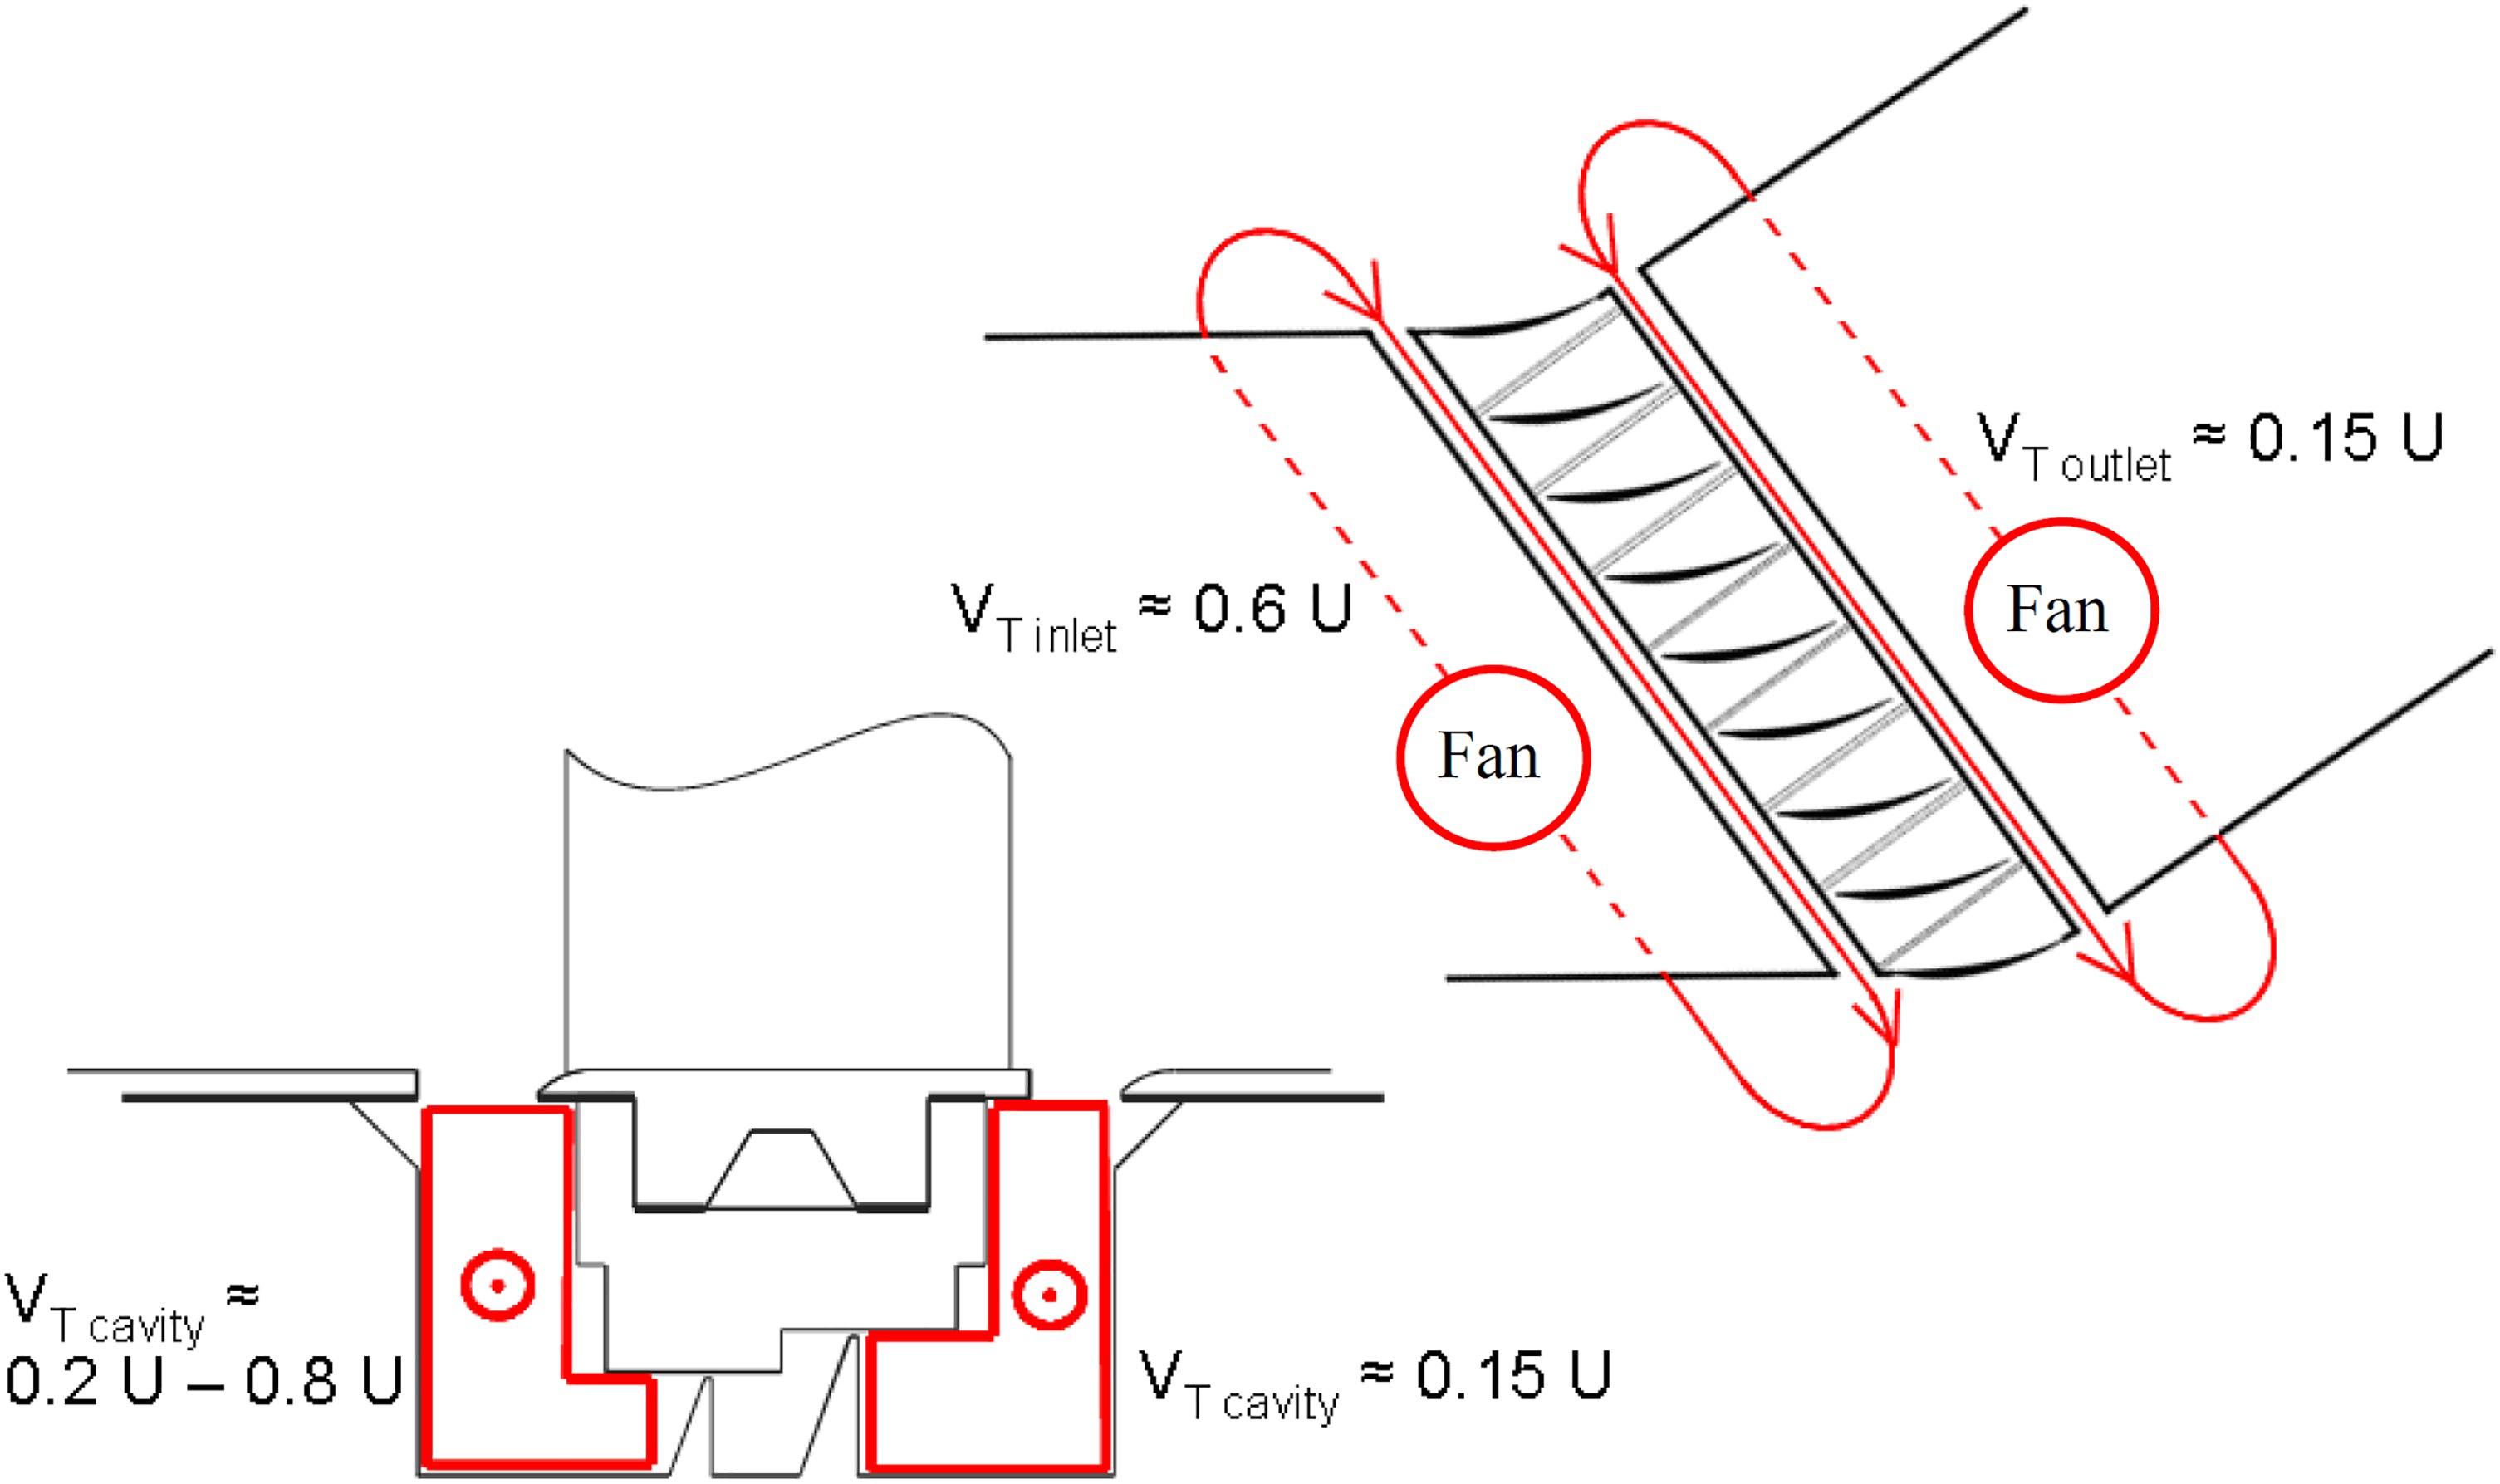
The linear cascade has a shroud leakage cavity with an adjustable fin-seal clearance. Because the shroud walls beneath the stators do not rotate, a method was needed to control the tangential velocities within the shroud cavities to simulate the whirl pick-up. A closed loop recirculation system was fitted which has in-line fans to control the tangential velocity. The leakage flow rate beneath the stator-shroud is determined by the pressure difference across the stator blade row and the fin-seal clearance. The level of whirl pick-up is controlled by the recirculation system. The tangential velocity in the downstream cavity is expected to equal that of the mainstream flow being ingested which, for the compressor design, is roughly 0.15U where U is the notional hub wheel-speed. The tangential velocity in the upstream shroud cavity could be varied between 0.2U to 0.8U. A schematic of the cascade and the recirculation systems is shown in Figure 1 and a picture of the working section of the linear cascade is shown in Figure 2. The cascade also has a novel system for skewing the inlet boundary layer of the mainstream flow upstream of the shroud cavities. This will be discussed in detail later.
The majority of the cascade measurement are area traverses using a calibrated 5-hole probe. Tests of the repeatability of the probe measurements were made both in the calibration wind tunnel and in the linear cascade. The results showed that the stagnation pressure coefficient could be measured repeatedly to within ±0.15% of dynamic head. The area traverses were undertaken upstream of the shroud cavity to capture the inlet flowfield and downstream of the blade trailing edge to capture the resulting blade flowfield.
Computational fluid dynamics
The Rolls-Royce proprietary code, HYDRA (Lapworth, 2004), was used for the computational investigation. This is a general purpose flow solver for hybrid unstructured meshes. The Spalart-Allmaras turbulence model, which was specifically designed for aerodynamic flows, was used for all of the simulations as it has been found to be successful for practical turbomachinery flows (Casey and Wintergerste, 2000).
The computational domains are shown in Figure 3. The inlet boundary to the computational domain matches the location of the upstream traverse plane on the cascade and the measured inlet profiles of total pressure, temperature and flow angles were used. A uniform static pressure, consistent with that measured in the cascade, was used for the exit boundary. Details of the boundaries for the shroud cavities are given below.
Figure 3.
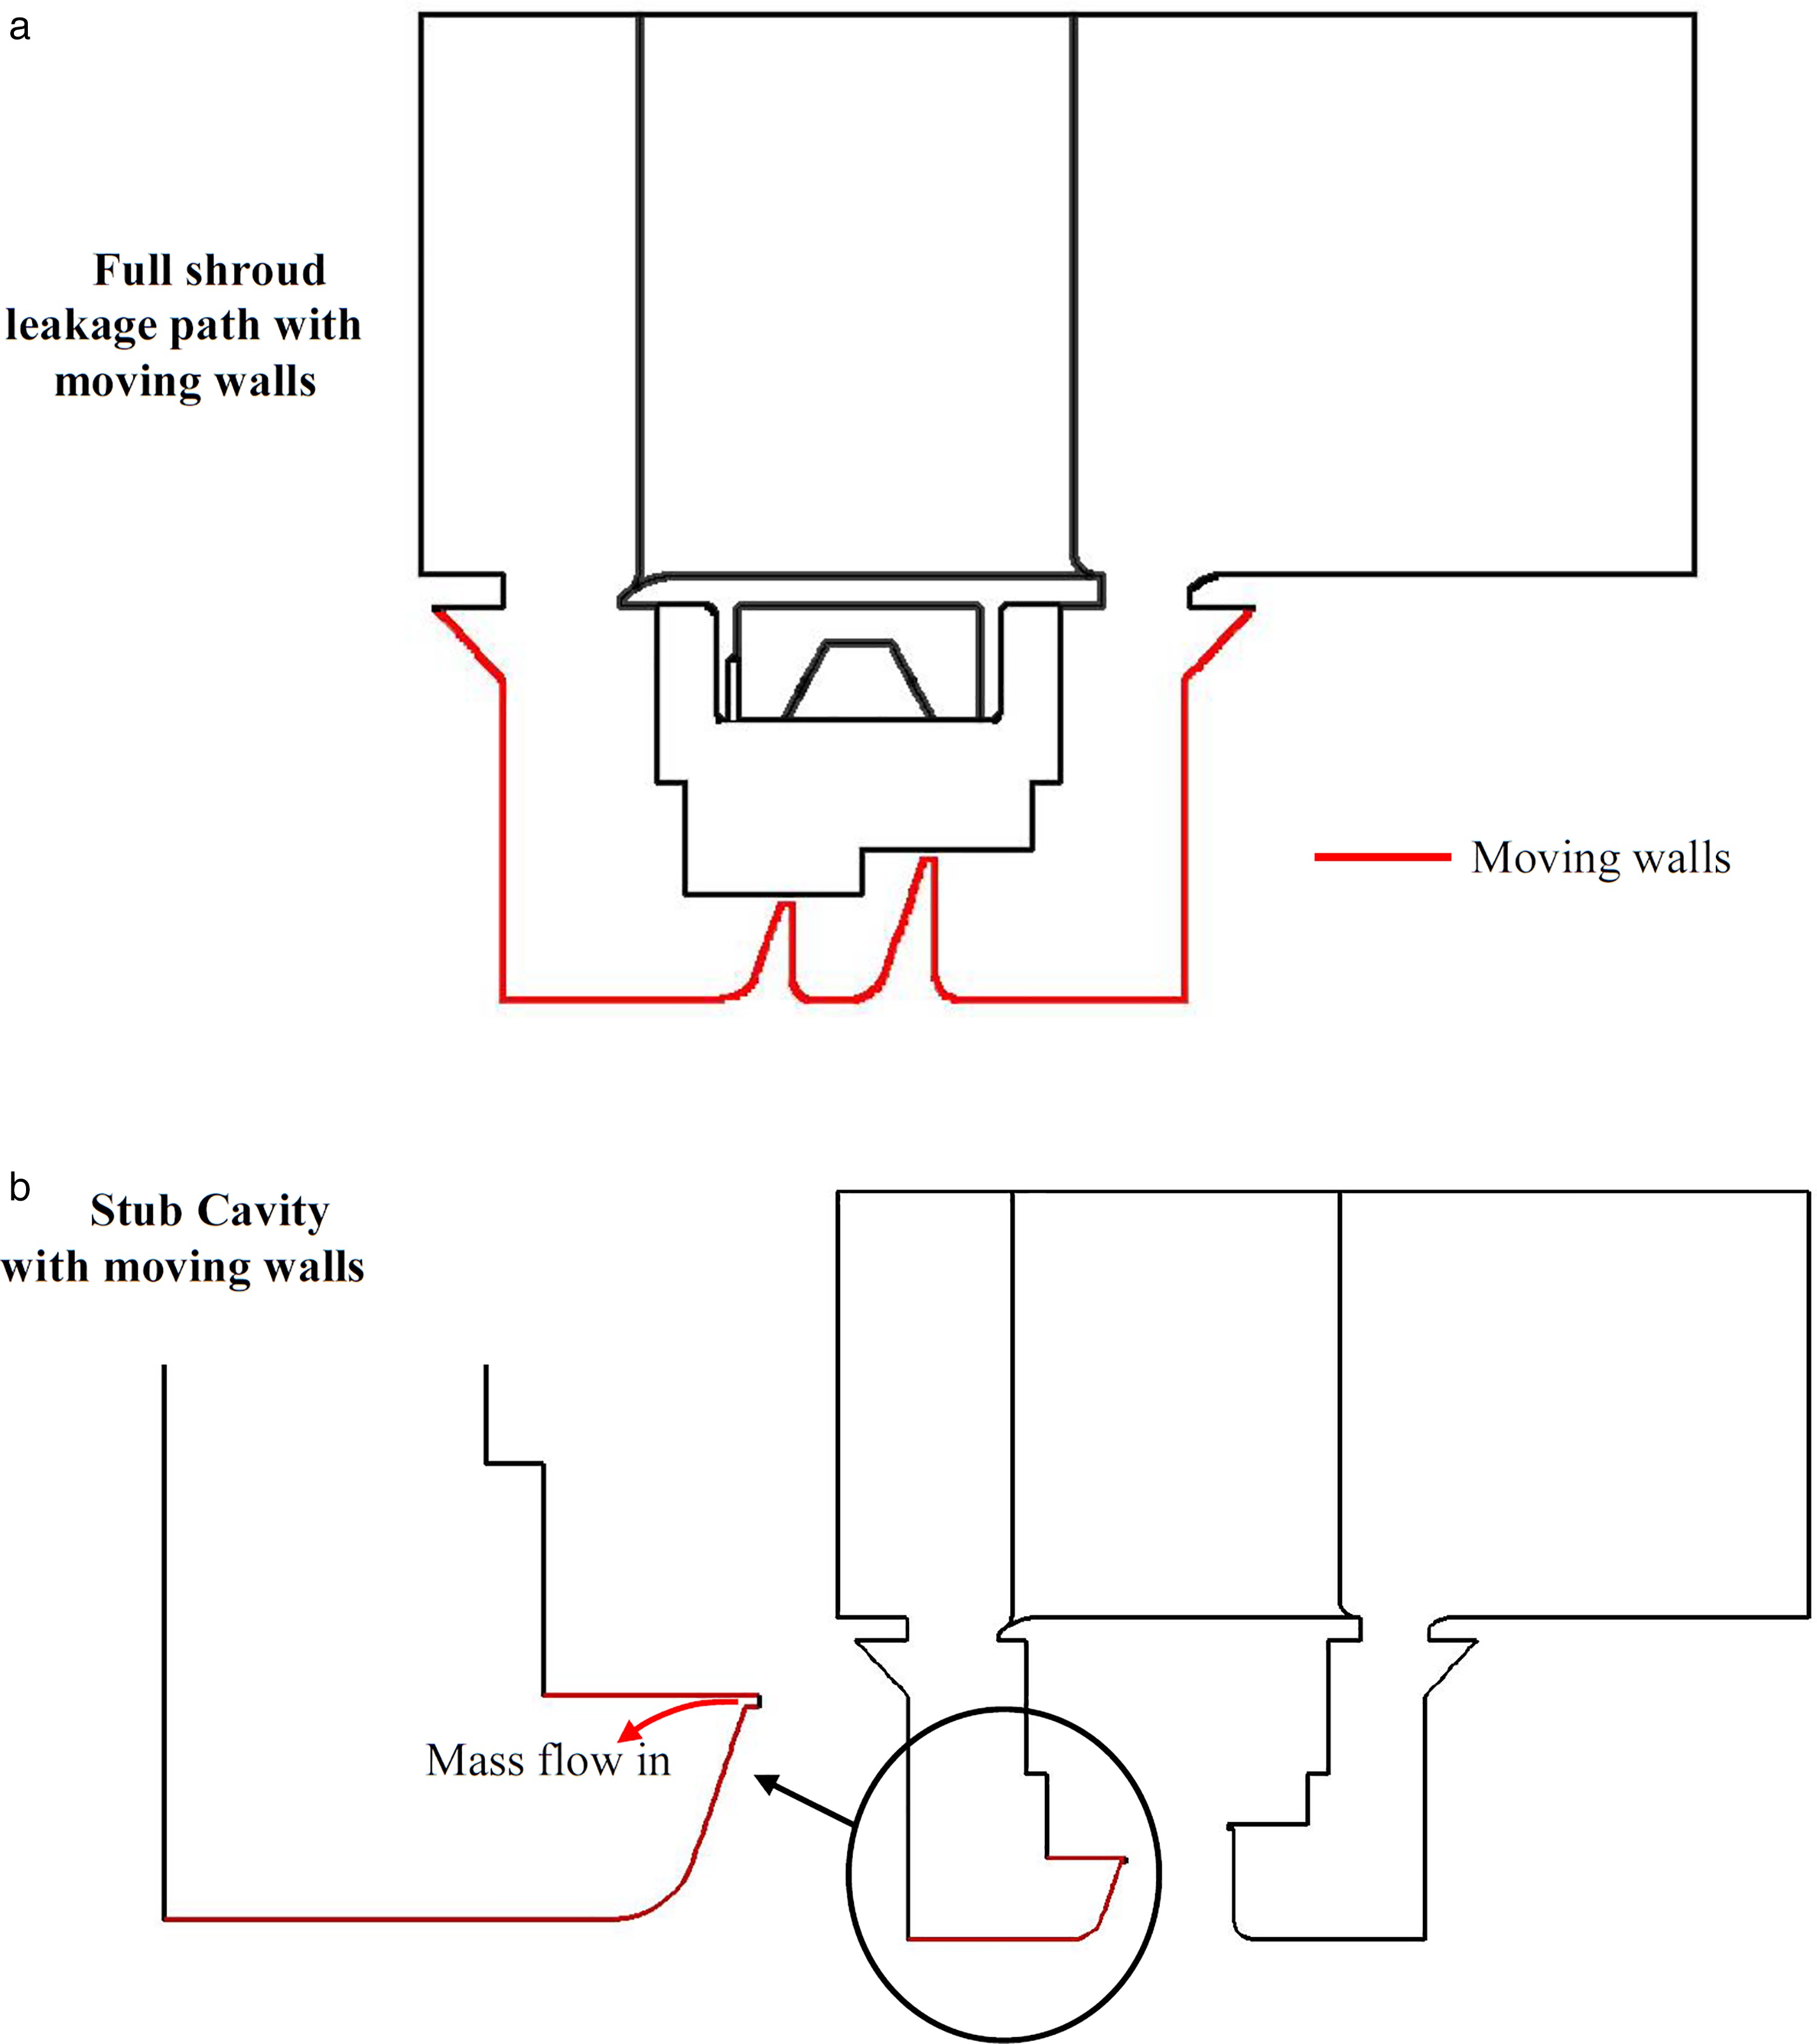
Computational geometry: (a) full shroud cavity to determine the leakage flow rates; (b) stub cavities to specify the leakage flow rate and to set the cavity tangential velocity.
A mesh sensitivity study was performed on the geometry shown in Figure 3a. The solid surfaces are covered with a layer of prismatic cells to capture the boundary layer, while the rest of the volume is meshed with tetrahedral cells. The maximum y+, occurring at peak velocity on the blade surface, was seven which ensured that the boundary layer is resolved. The tetrahedral volume mesh was then refined until no further changes in the solution were seen. The final model contained roughly 14 million elements, comprising of 8.6 million prismatic and 5.5 million tetrahedral cells.
Like the linear cascade, the computational domain has a full shroud cavity and the endwalls are stationary so a method of controlling the cavity tangential velocities was required. To achieve this, one complete domain was calculated at the required fin-seal clearance with a moving wall in the cavity. This was used to determine the leakage flow rate through the fin-seals. The geometry was then modified by removing the two fin-seals to form two stub-cavities. An extra outflow boundary was then added along the front edge of the downstream stub-cavity and an extra inflow boundary was added along the rear edge of the upstream stub-cavity at positions corresponding to where the fin-seal had been. Through these extra boundaries the required mass flow rate was specified and at the inlet boundary, in the upstream stub-cavity, the required tangential velocity was set. This method allows the required cavity conditions to be specified. The complete computational domain and the method for simulating the cavity whirl pick-up are shown in Figure 3.
For the stub cavity calculations, shown in Figure 3b, it was necessary to translate the walls shown in red at a speed equivalent to the tangential velocity specified at the mass flow inlet boundary. Without these moving walls it was found that the prescribed tangential velocity did not advance through the cavity. For the zero fin-seal clearance case the tangential velocity did not wash through the cavity and consequently this case could not calculated.
Boundary layer skew
There have been a number of studies into the effects of boundary layer skew within compressors. Moore and Richardson (1957) showed that the natural skewing of the boundary layer in a compressor acts to off-set the secondary flows by opposing the turning of the flow on the endwall. Walsh and Gregory-Smith (1990) also demonstrated that the loss in an axial compressor is dependent on the level of skew in the inlet boundary layer.
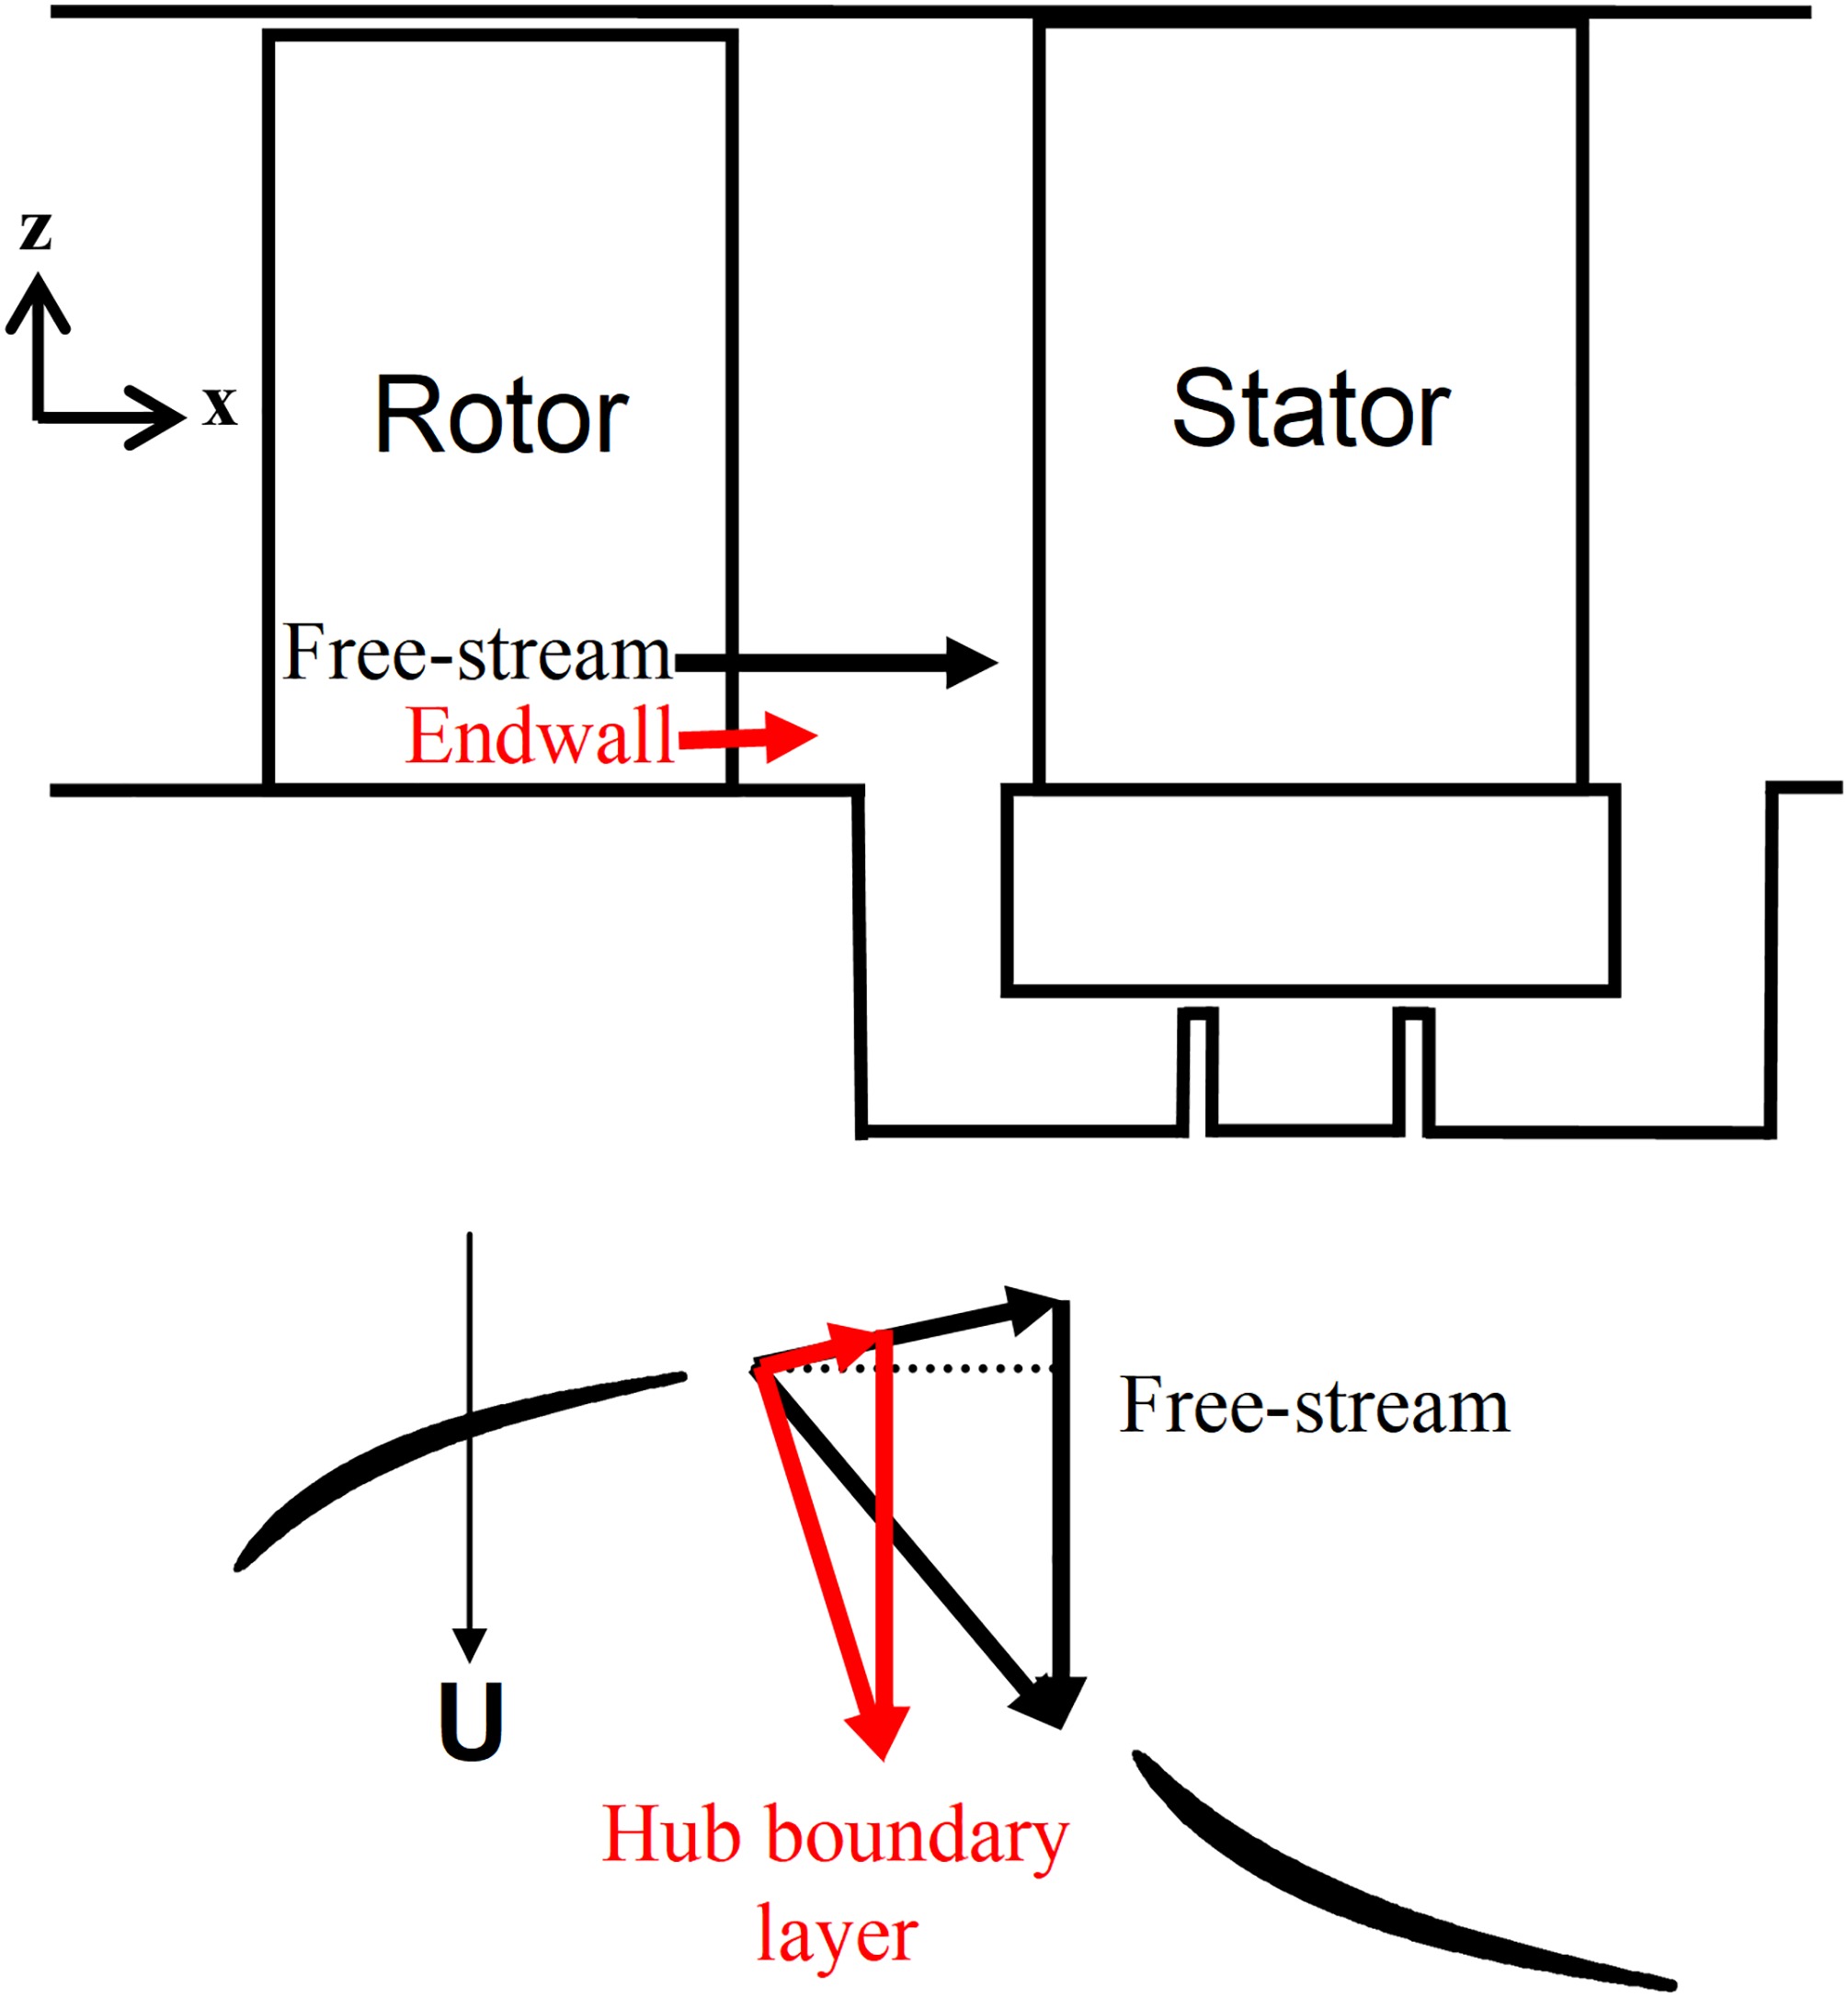
Secondary flows can skew the hub endwall boundary layer relative to the mainstream. However boundary layer skew can also be caused by the change in the frame of reference between the moving and stationary blade rows. For a simplified example, where the rotor exit relative flow angle is uniform along the span, the velocity triangles at the rotor exit/stator inlet in the free-stream, just above the boundary layer, and in the boundary layer just above the hub platform are shown in Figure 4. Through the boundary layer on the rotor hub platform the axial and relative tangential velocities reduce to satisfy the no-slip condition. Combining these changes with the effectively constant wheel speed produces a boundary layer profile in the absolute frame which is skewed at the leading edge of the downstream stator blade row.
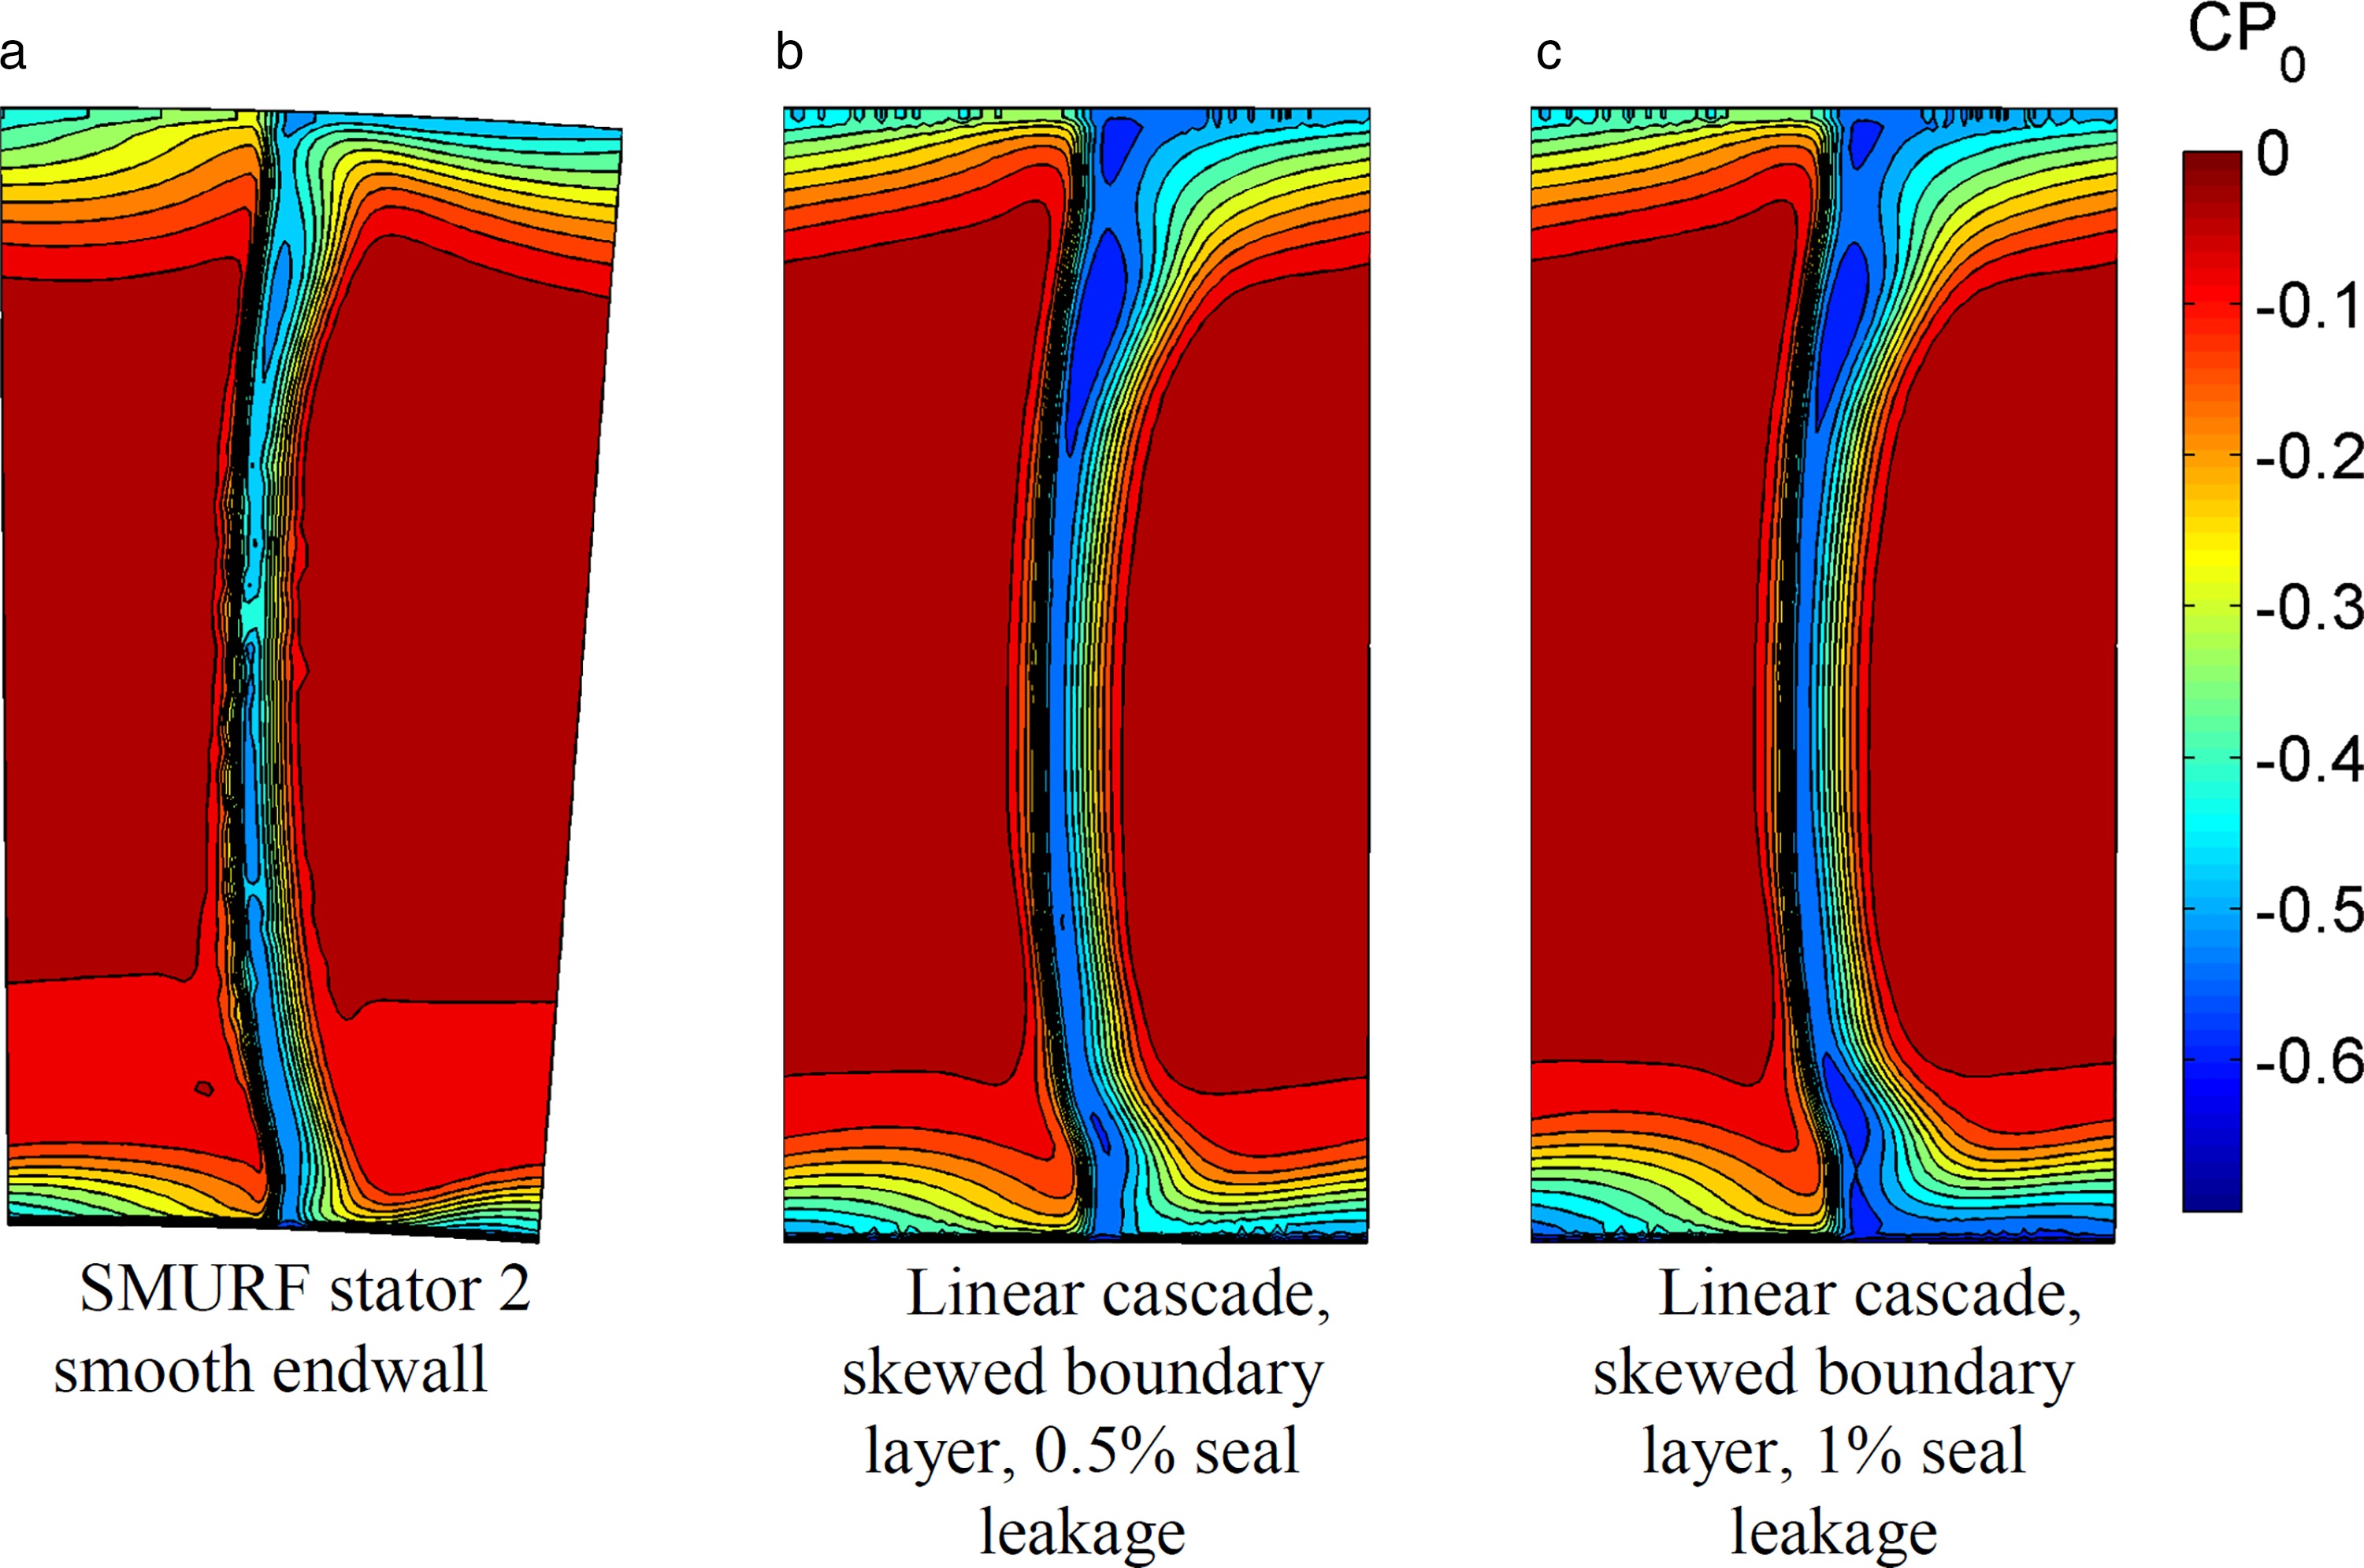
To demonstrate the impact of not modelling the skewed inlet boundary layer, contour plots of the total pressure coefficient at the stator exit for three different calculations will be compared. The design case from the three-stage compressor with a skewed boundary layer is shown in Figure 5a. The same blade when operated in a linear cascade with similar mainstream flow but with the skew removed from the boundary layer (i.e. what would be expected in a standard linear cascade) is shown in Figure 5b. The same linear cascade but with the addition of a shroud leakage flow (0.5% of mainstream flow) injected upstream of the blade row is shown in Figure 5c. These figures show that removing the boundary layer skew has resulted in significantly stronger secondary flows. The addition of low momentum shroud leakage flow onto the stator hub further exacerbates the secondary flows. The result of excluding the skew in the inlet boundary layer is a flowfield which is not representative of a real compressor and therefore any measurements would be of little practical use.
Quantifying boundary layer skew
It is necessary to quantify boundary layer skew in order to investigate its influence and to be able to recreate it within the linear cascade. Mager (1952) presented a series of equations that define a boundary layer in a cross flow, however these were in a coordinate system aligned with the mainstream flow. For this investigation the equations are defined in terms of the axial and tangential velocities. The boundary layer displacement thickness is defined using:
Similarly the axial momentum thickness can be defined:
It is possible to quantify the tangential momentum thickness using a similar equation. However, if the freestream tangential velocity is zero the equation is singular. Instead the following definition will be used:
A set of target inlet boundary conditions for the linear cascade were generated using the calculation of the design operating point of the low-speed three-stage axial compressor on which the stator blade geometry had been based. The boundary layer displacement and momentum thicknesses, calculated using Equations 1–3, are given in Table 2 for the casing (collateral) and hub (skewed) boundary layers. The skewed boundary layer on the hub has a negative tangential momentum thickness which corresponds to a tangential momentum greater than the mainstream.
Skew generation in the linear cascade
A standard linear cascade will produce a uni-directional inlet flowfield such that the flow angle upstream of the blade will be uniform across the span. However, in a compressor the endwall boundary layer flow is skewed relative to the mainstream and this can have a profound effect on the development of secondary flows in the downstream blade row. So, for the linear cascade experimentation to be representative of an aero-engine compressor, the skew in the inlet boundary layer must be included.
Previous researchers have used various methods to introduce boundary layer skew in a linear cascade: Moore and Richardson (1957) used multiple cross-blowing jets and Rushton (2003) used a moving endwall. However, a simpler method was desired for this experimental investigation. The method developed for these studies involves injecting flow through a 5% of span backwards facing step along the hub endwall at an angle to the mainstream such that the injected axial and tangential velocities would give the desired boundary layer.
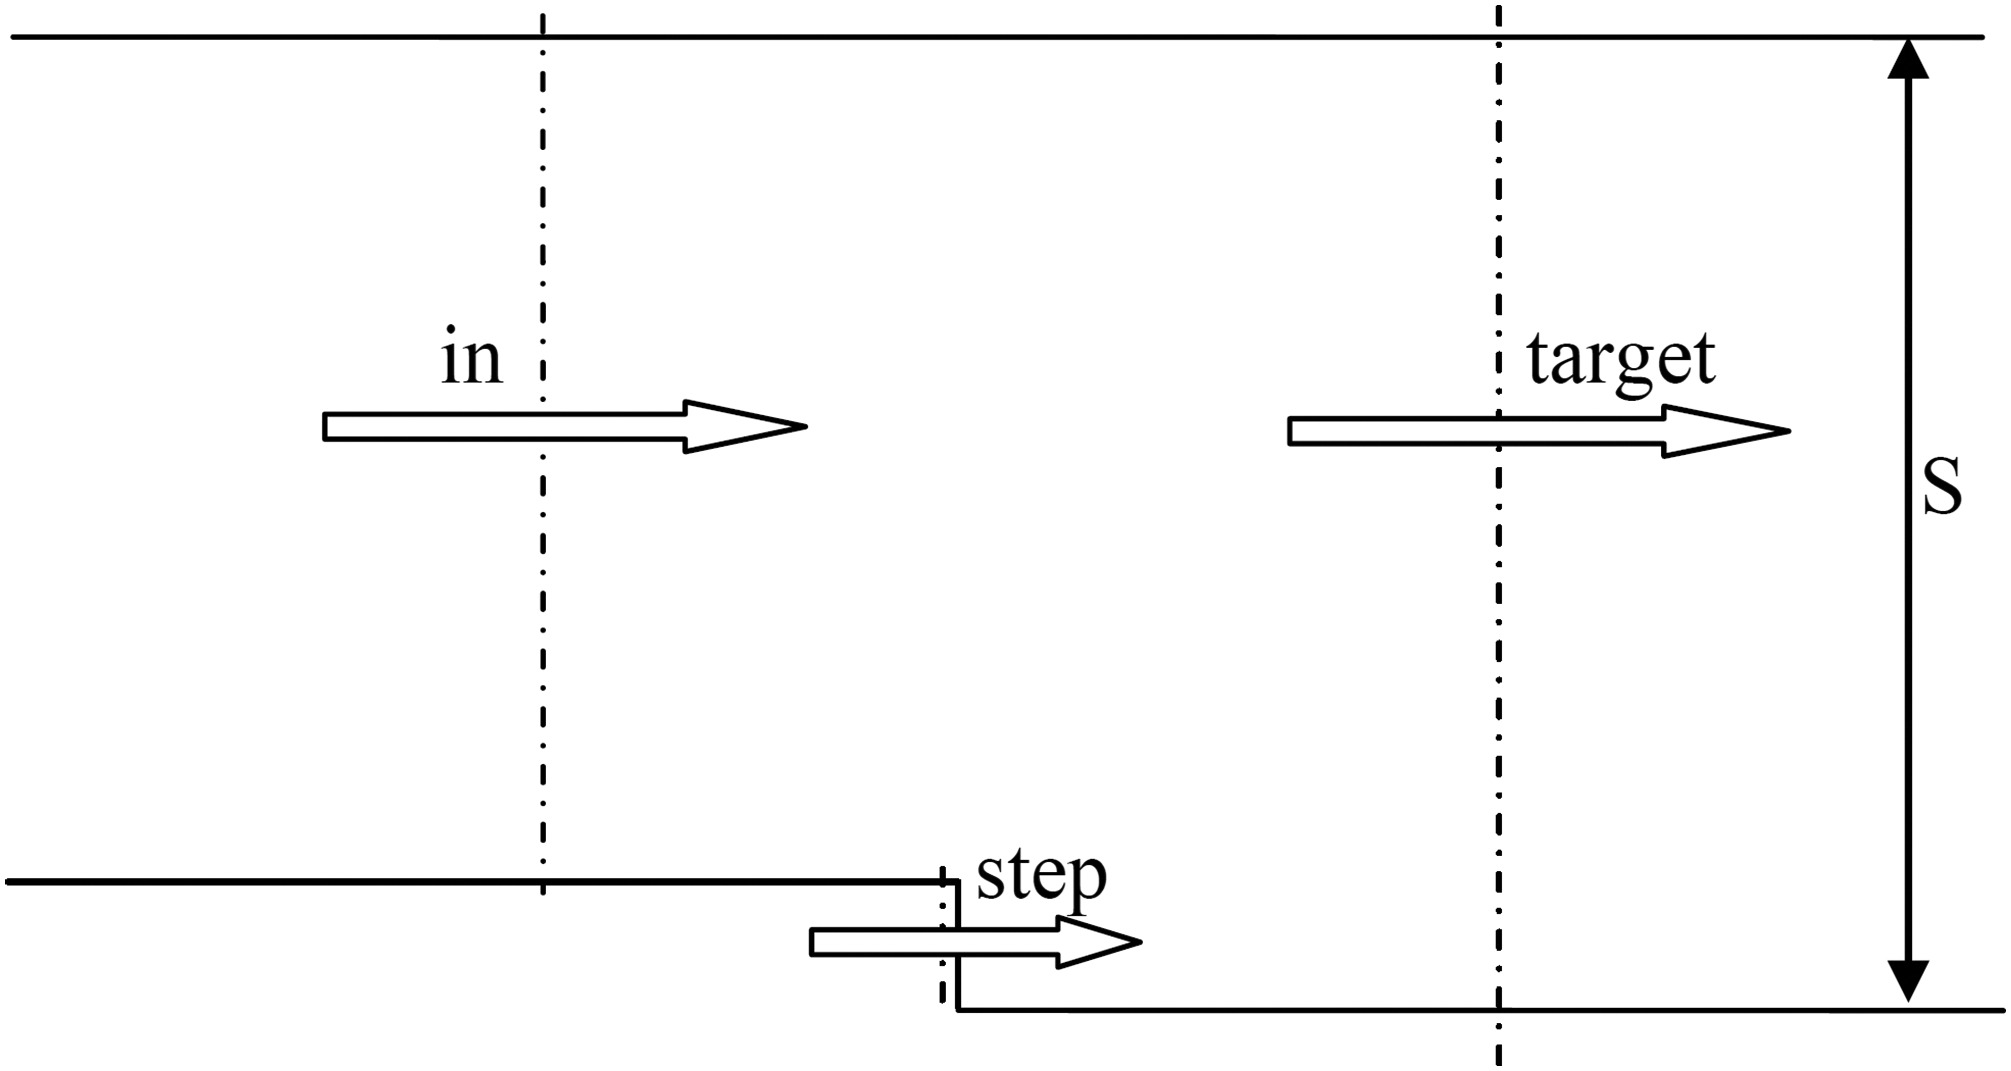
The required axial and tangential velocities through the step can be determined by considering the control volume shown in Figure 6. Using conservation of mass and a knowledge of the displacement thickness of the inlet (“in”) boundary layer upstream of the step and the target conditions, it is possible to determine Vx,step. Also, through conservation of tangential momentum, it is possible to determine the required tangential velocity of the flow injected though the step in order to obtain the target tangential momentum thickness. This ensures that the flow injected from the step gives the correct displacement and tangential momentum thicknesses. The axial momentum thickness cannot be controlled by this method. However, measurements in the cascade showed that the axial momentum thickness was 1.2% of span which is slightly higher than the target conditions of 0.85% of span. While this resulted in slightly higher secondary losses than intended, the flowfield was still representative of the design intent.
Shroud cavity effects
For the datum platform geometry, which included a 1% of pitch inter-platform gap in each passage, the experimental and computational investigation into the impact of shroud leakage and whirl pick-up took the form of a matrix of tests. The experimental and computational investigations were intended to have fin-seal clearances of 0%, 1%, 2% and 3% of span. However, a setup error resulted in the largest clearance tested in the cascade to be only 2.5% and, for reasons stated in the methodology section, it was not possible to obtain a converged calculation with 0% fin-seal clearance. At each of the tested fin-seal clearances, the tangential velocity in the upstream cavity (at 15% of span below the hub) was set to 0.25U, 0.4U and 0.55U.
The spanwise profile between the casing and the bottom of the shroud cavity of the measured and calculated tangential velocity are shown in Figure 7. There is a good match at all upstream cavity velocities, particularly in the region just beneath the hub. As it is this flow that will be injected into the mainstream, Figure 7 gives confidence that the calculations match the experiments. It should be noted however, that the measurements show a higher tangential velocity at the hub line than the calculations. The calculations predict greater mixing of the inlet boundary layer with the cavity flows, which results in a reduced tangential velocity at blade leading edge, whereas the experiments show less mixing and higher tangential velocities at the leading edge. This will result in the calculated flowfield being less able to resist the turning of the secondary flow.

Effect of fin-seal clearance
The first studies presented investigate the effects of varying the fin-seal clearance for a fixed tangential velocity of 0.4U in the upstream cavity. Figure 8 shows contour plots of the stagnation pressure coefficient measured just downstream of the blade trailing edge at three different fin-seal clearances. The first point to note is that the 0% and 1% fin-seal clearances cases show a good resemblance to the design flowfield shown in Figure 5, indicating that the skewed inlet boundary layer is working as designed. It is clear from Figure 8 that as the fin-seal clearance is increased, the strength of the secondary flows are also increased resulting in larger loss cores at the trailing edge. This is due to increasing the amount of low momentum fluid that is being introduced onto the stator hub platform which is then being swept across the blade passage onto the suction surface.

The calculations (not shown) give a similar result, although they show a lower stagnation pressure within the loss cores and along the hub walls. This is due to the calculations being fully turbulent which results in higher boundary layer losses.
Effect of upstream cavity tangential velocity
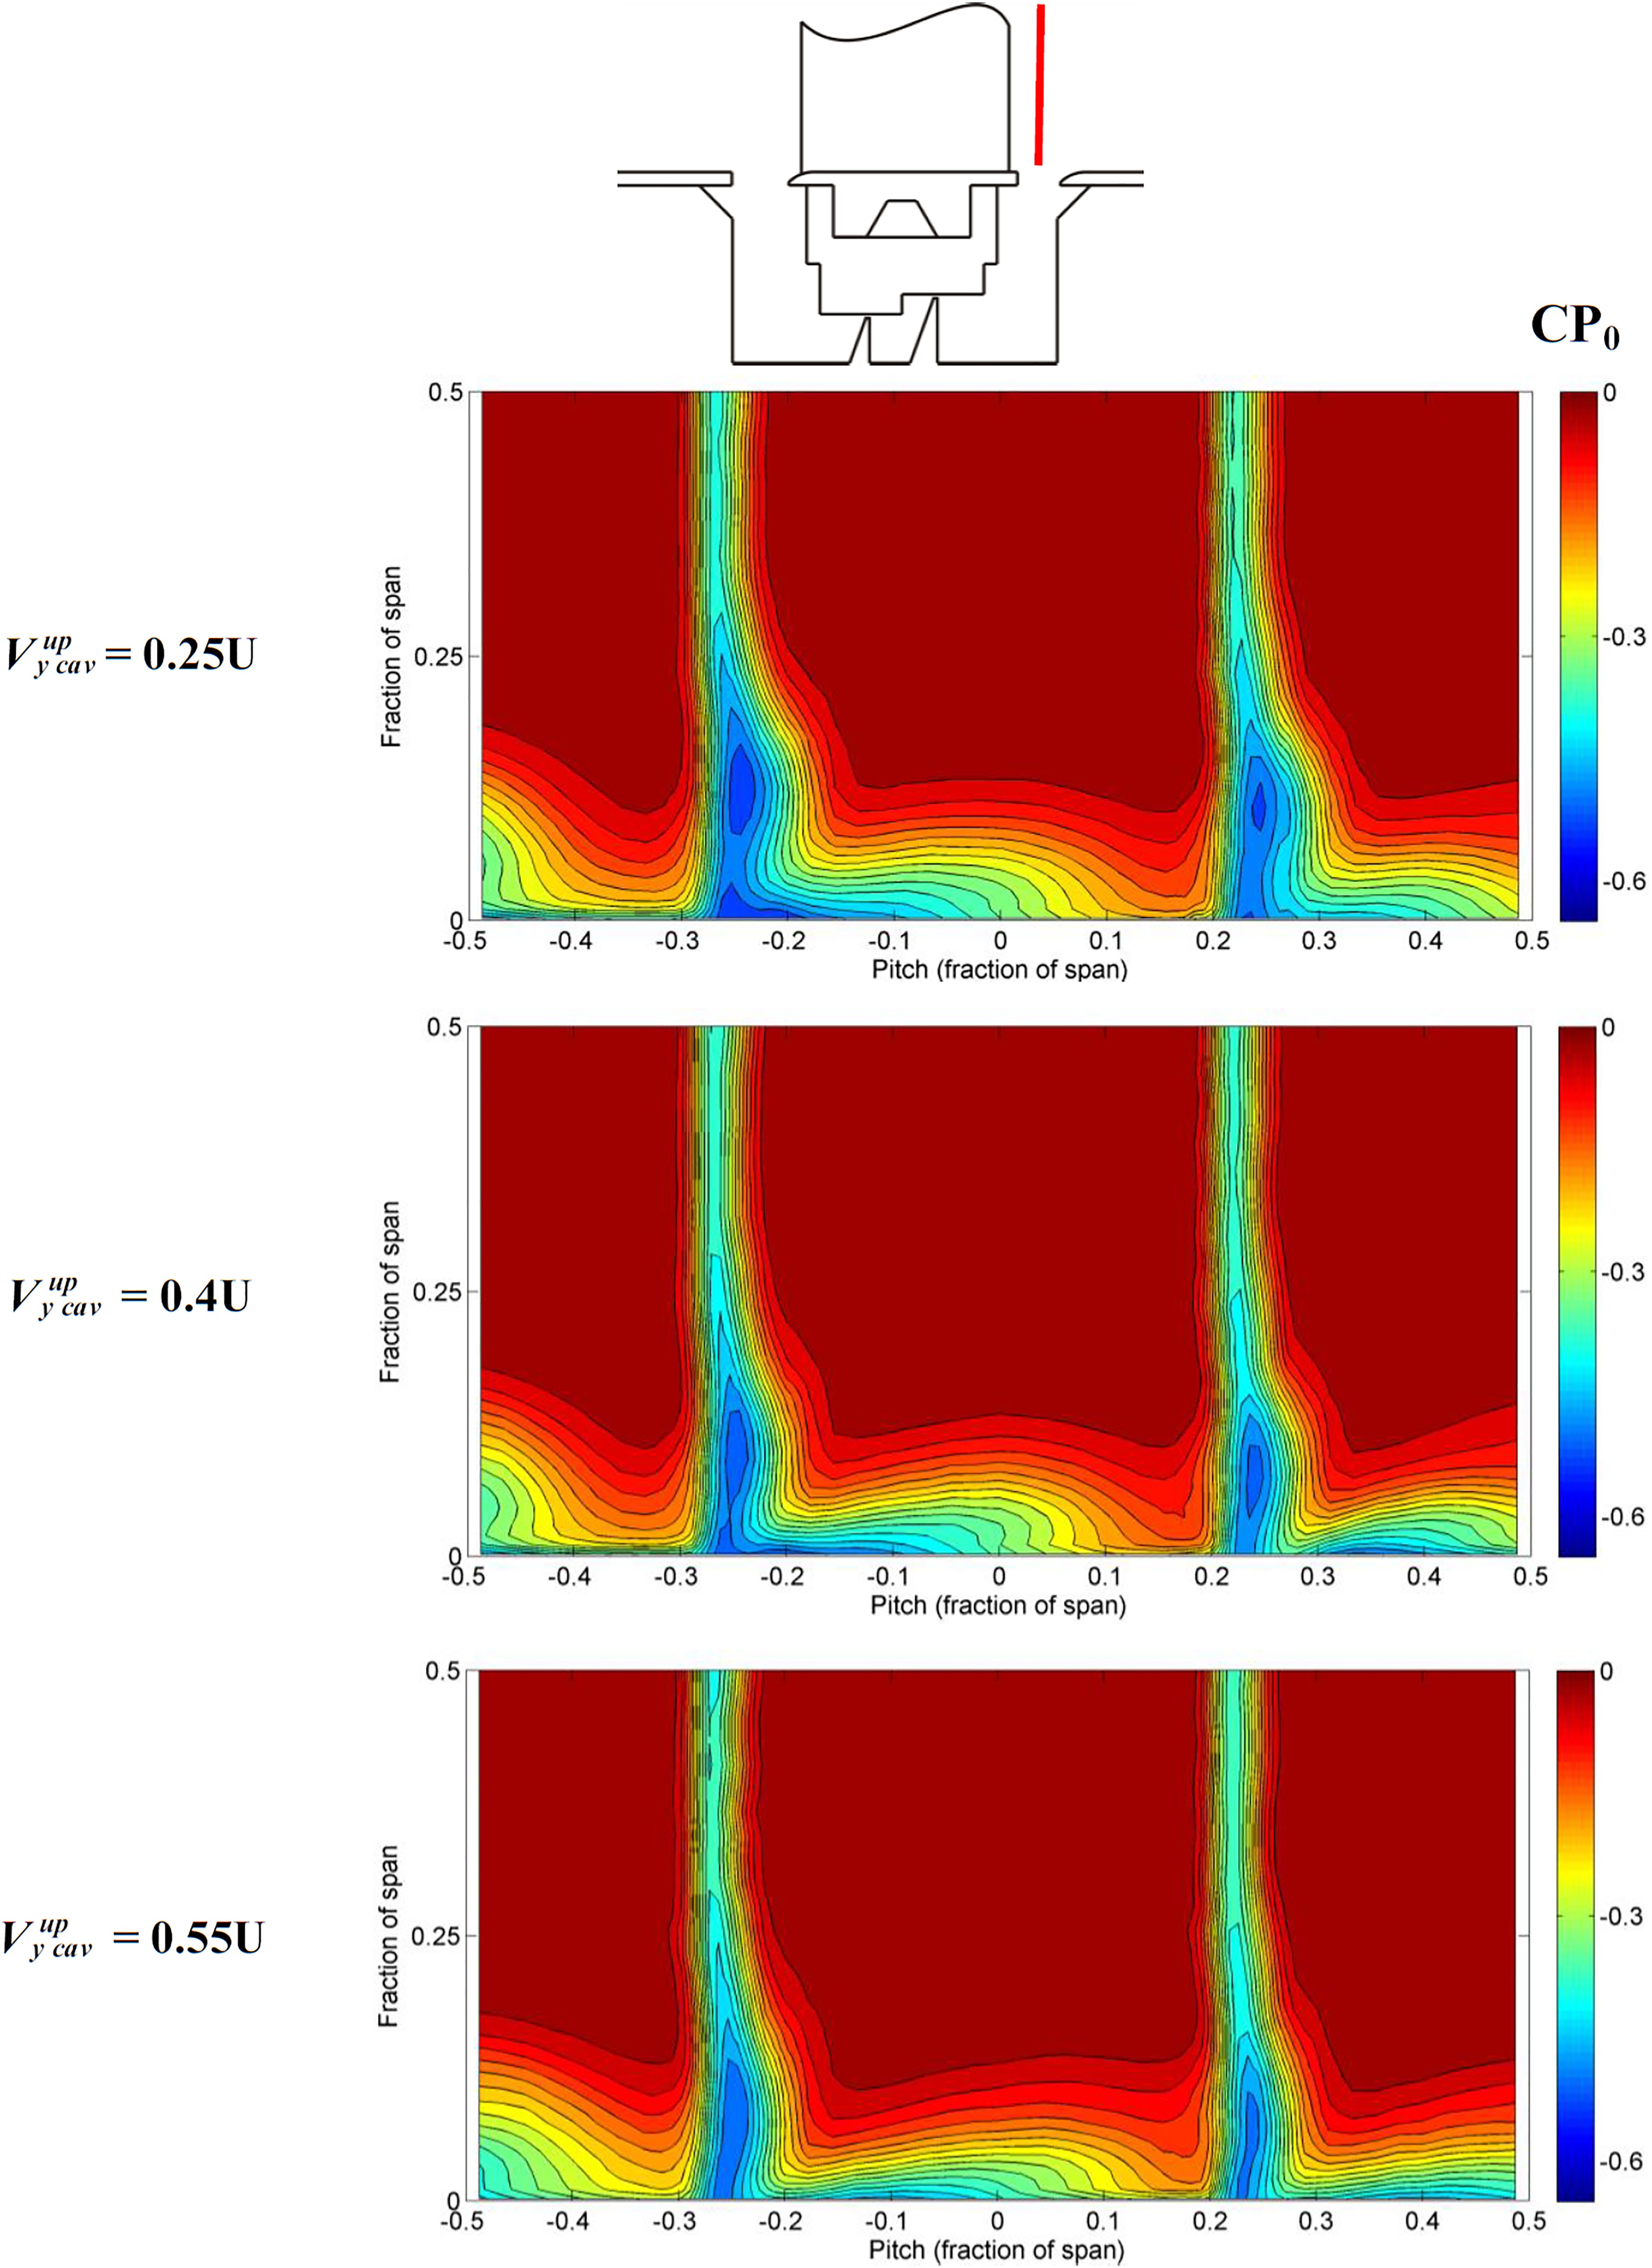
Figure 9 shows the measured impact of changing the tangential velocity in the upstream cavity for a fixed fin-seal clearance (1% of span). The measurements show that as the upstream cavity tangential velocity increases the strength and size of the loss core at the hub corners is reduced indicating that the increased momentum of the injected leakage flow is more able to resist the cross-passage pressure gradient. The largest change is seen between the cases with 0.25U and 0.4U. The calculations (not shown) predict similar changes in the flowfield with increasing cavity velocities, but do not show the levelling off of the improvements seen in the experiments. This is most likely due to the increased mixing in the calculations, relative to the experiments, of the hub flow upstream of the leading edge which reduces the peak tangential velocity.
Figure 9.
Effect on the stagnation pressure coefficient of changing the tangential velocity in the upstream cavity.
Demargne and Longley (2000) saw a similar effect of reduced losses with increasing upstream cavity tangential velocity, although their results did not show any levelling off of the improvement. However the experiments reported in that paper were done in the absence of a realistically skewed inlet boundary layer, and therefore did not have the increased tangential momentum in the inlet boundary layer which is included in this study. It is possible that if the Demargne and Longley experiments had been run to even higher upstream cavity tangential velocities then they may too have seen a levelling off of their results.
Overall impact of shroud cavity flows
The results presented above show the general trends in how the flowfield is affected by changing either the tangential velocity within, or the leakage flow rate out of, the upstream cavity. In this section the measurements and calculations are presented for the whole test matrix where the flux of tangential momentum added into the hub endwall flow ahead of the blade leading edge is varied.
Figure 10 shows the change in stagnation pressure coefficient between the inlet and exit traverse planes. For both the calculations and experiments, the case with 1% fin-seal clearance and an upstream cavity tangential velocity of 0.4U are chosen as datum points. Therefore what is shown is how the change in stagnation pressure alters as the fin-seal clearance and the upstream cavity tangential velocity are changed. It also shows how well the calculations can capture the changes compared to the measurements.
Figure 10.
Change in the stagnation pressure coefficient between the inlet and trailing edge traverse planes for the calculations and experiments.
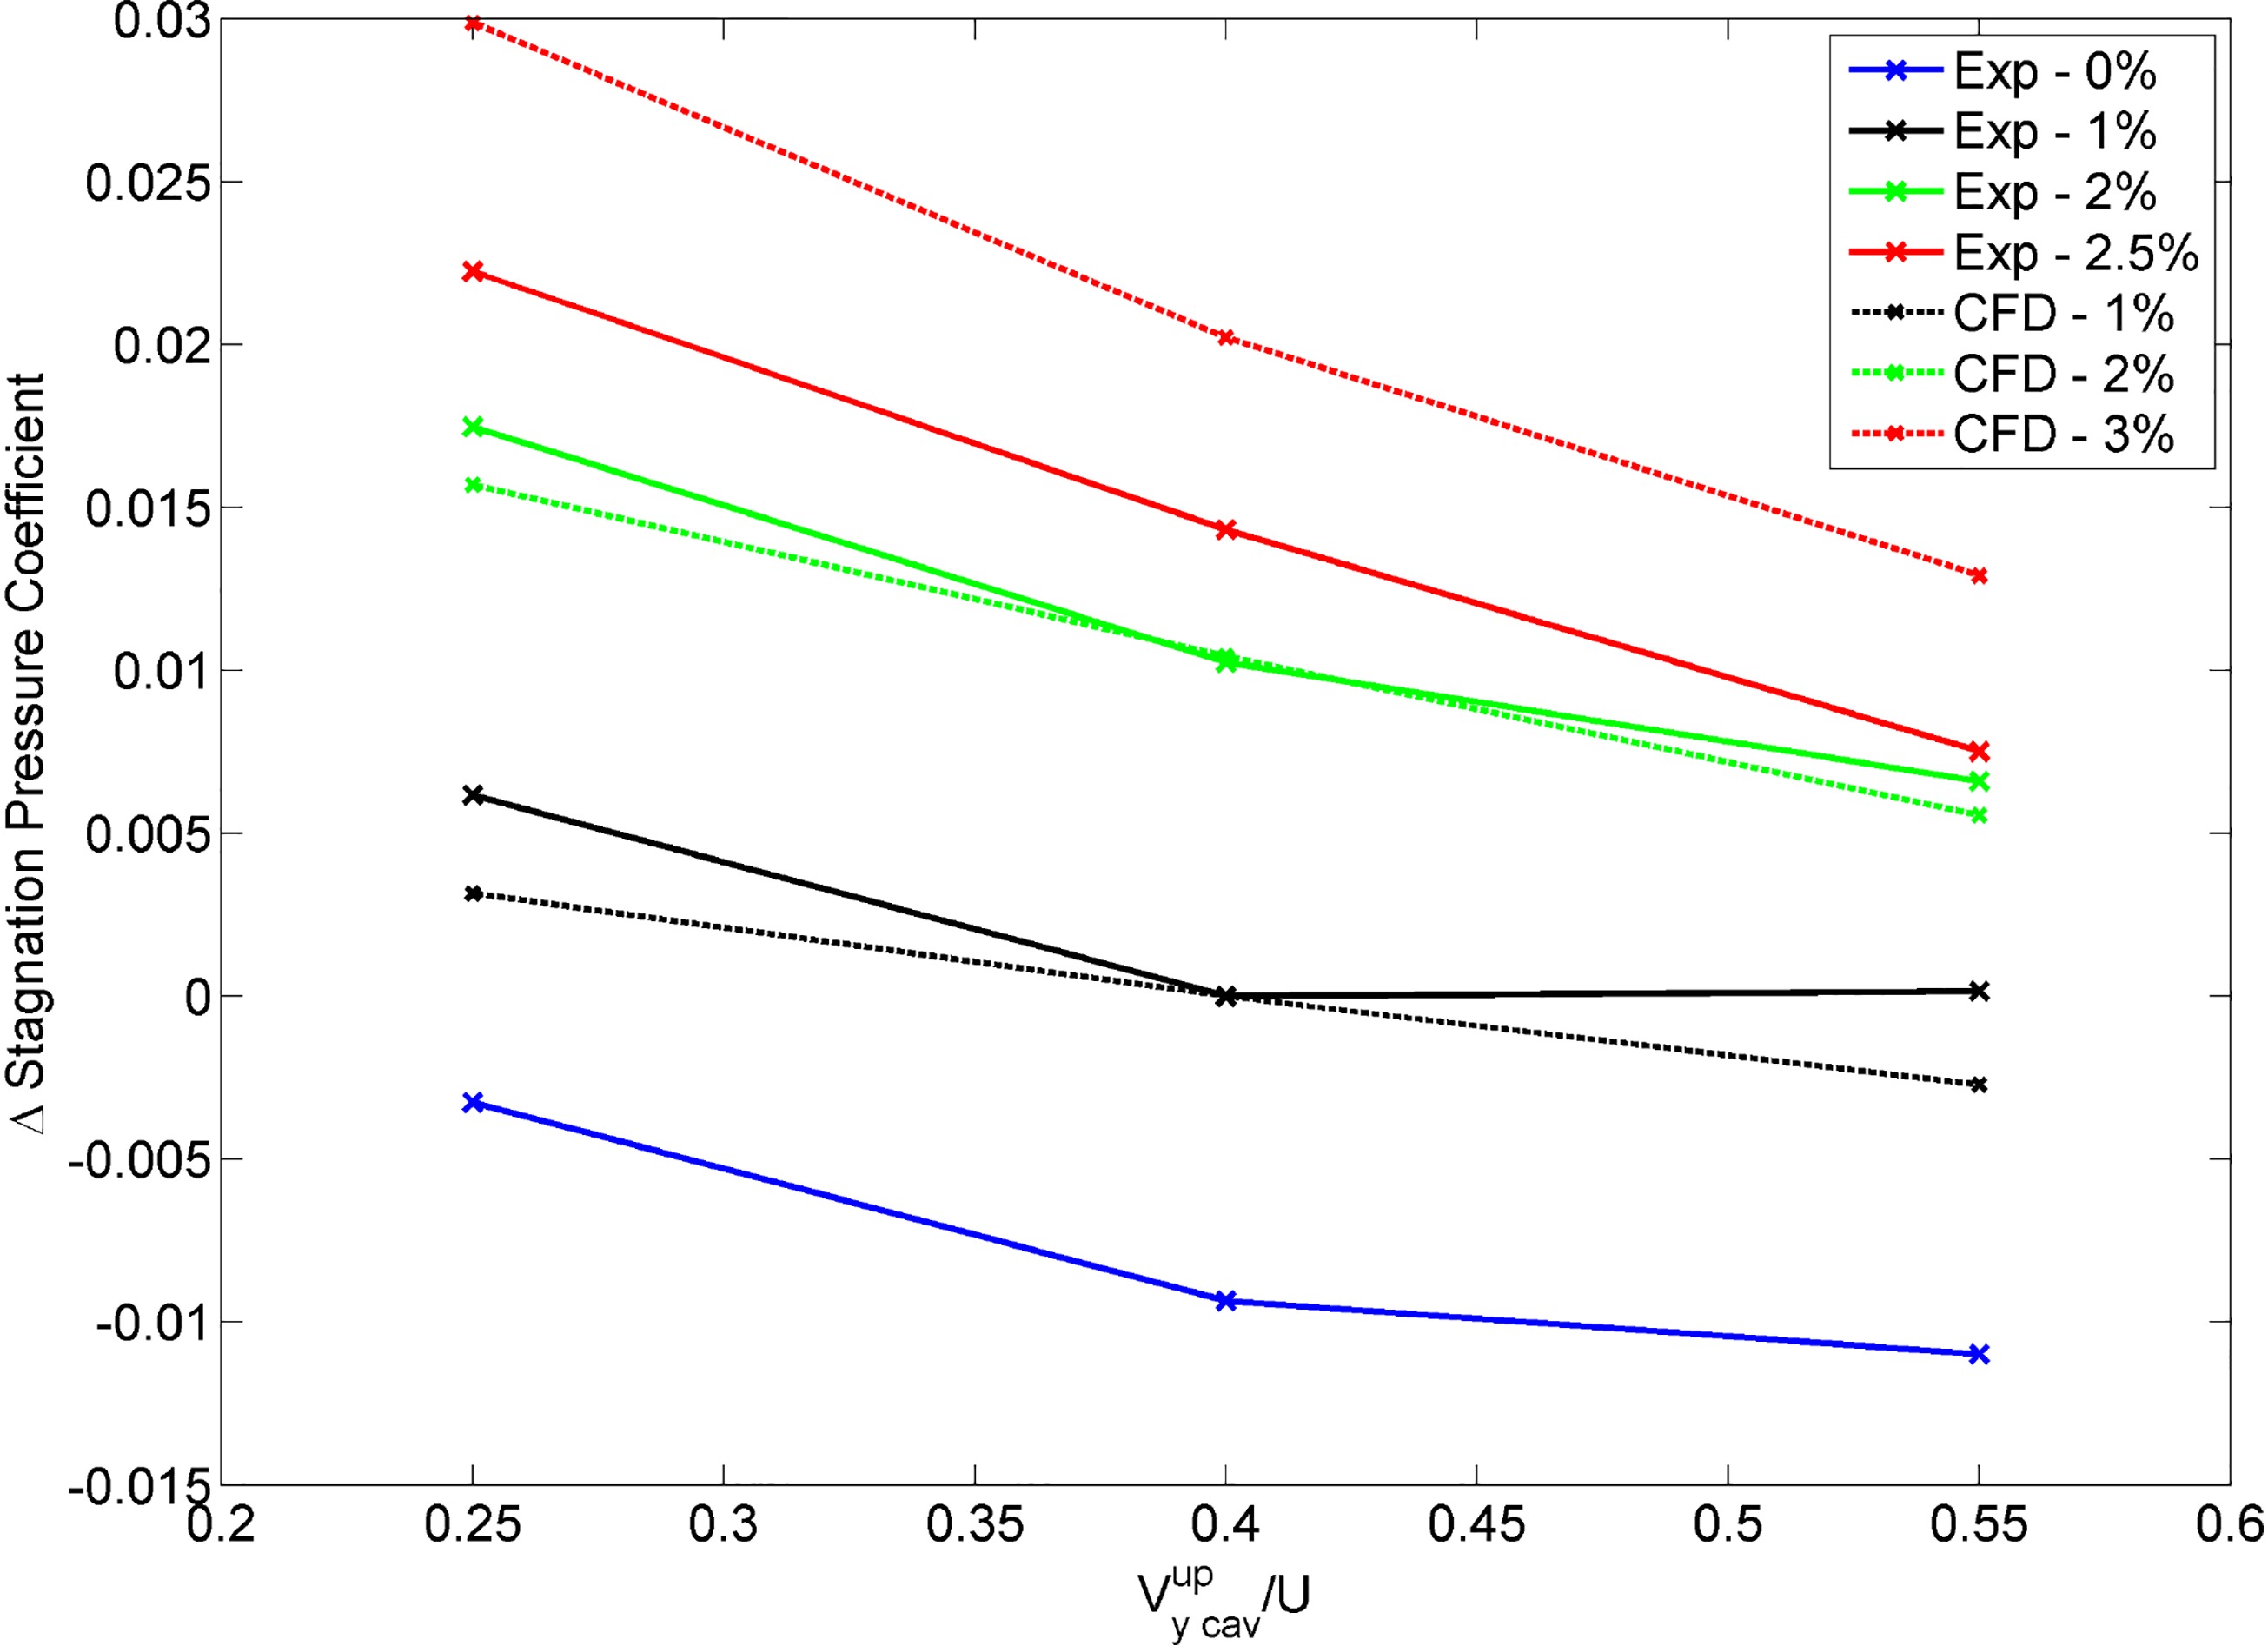
At an upstream cavity tangential velocity of 0.4U, both the measurements and calculations show a 1% of dynamic head increase in stagnation pressure coefficient per 1% change in fin-seal clearance. At 0.25U, the calculated increase in stagnation pressure change is slightly higher than the experiments at 1.15% of dynamic head, compared to 1% from the experiments. This trend does not hold at the highest cavity tangential velocities, as the shape of the curves changes for difference clearances. Between 0.25U and 0.4U the experiments show that the stagnation pressure change reduced by approximately 0.6% of dynamic head for all fin-seal clearances. A similar change is seen between 0.4U and 0.55U at the largest fin-seal clearance. The calculations captures the trend of the reduced stagnation pressure loss with increasing upstream cavity tangential velocity, however the magnitude of the change is less. At low fin-seal clearances, a distinct levelling off of the change in the measured stagnation pressure coefficient can be seen at between 0.4U and 0.55U. The calculations do not show a linear change and the levelling off is significantly less pronounced than in the experiments.
The reason for the different shapes of the curves can be explained by the thicker boundary layer seen within the blade passage for the calculations. As mentioned above the turbulent calculations over predicts the growth of the endwall boundary layers, so the calculations will see a larger amount of low momentum flow on the endwall leading to stronger secondary flows. Higher upstream cavity tangential velocities would be required (relative to the experiments) in order to offsets these secondary flows, hence the calculated curves would only be expected to start to level off at higher upstream cavity tangential velocities.
Platform geometry effects
The hub platform geometry tested in the previous section included in each passage the 1% of pitch inter-platform gap, which is considered to be the datum geometry. The effect of different gaps and steps in the hub platform geometry will now be investigated. For simplicity, only the tangential velocity in the upstream cavity will be varied (0.25U to 0.55U) as there is greater uncertainty in this quantity in an aero-engine than the size of the fin-seal clearance which will be held constant at 1% of span in these investigations.
Inter-platform and vane-pack gaps
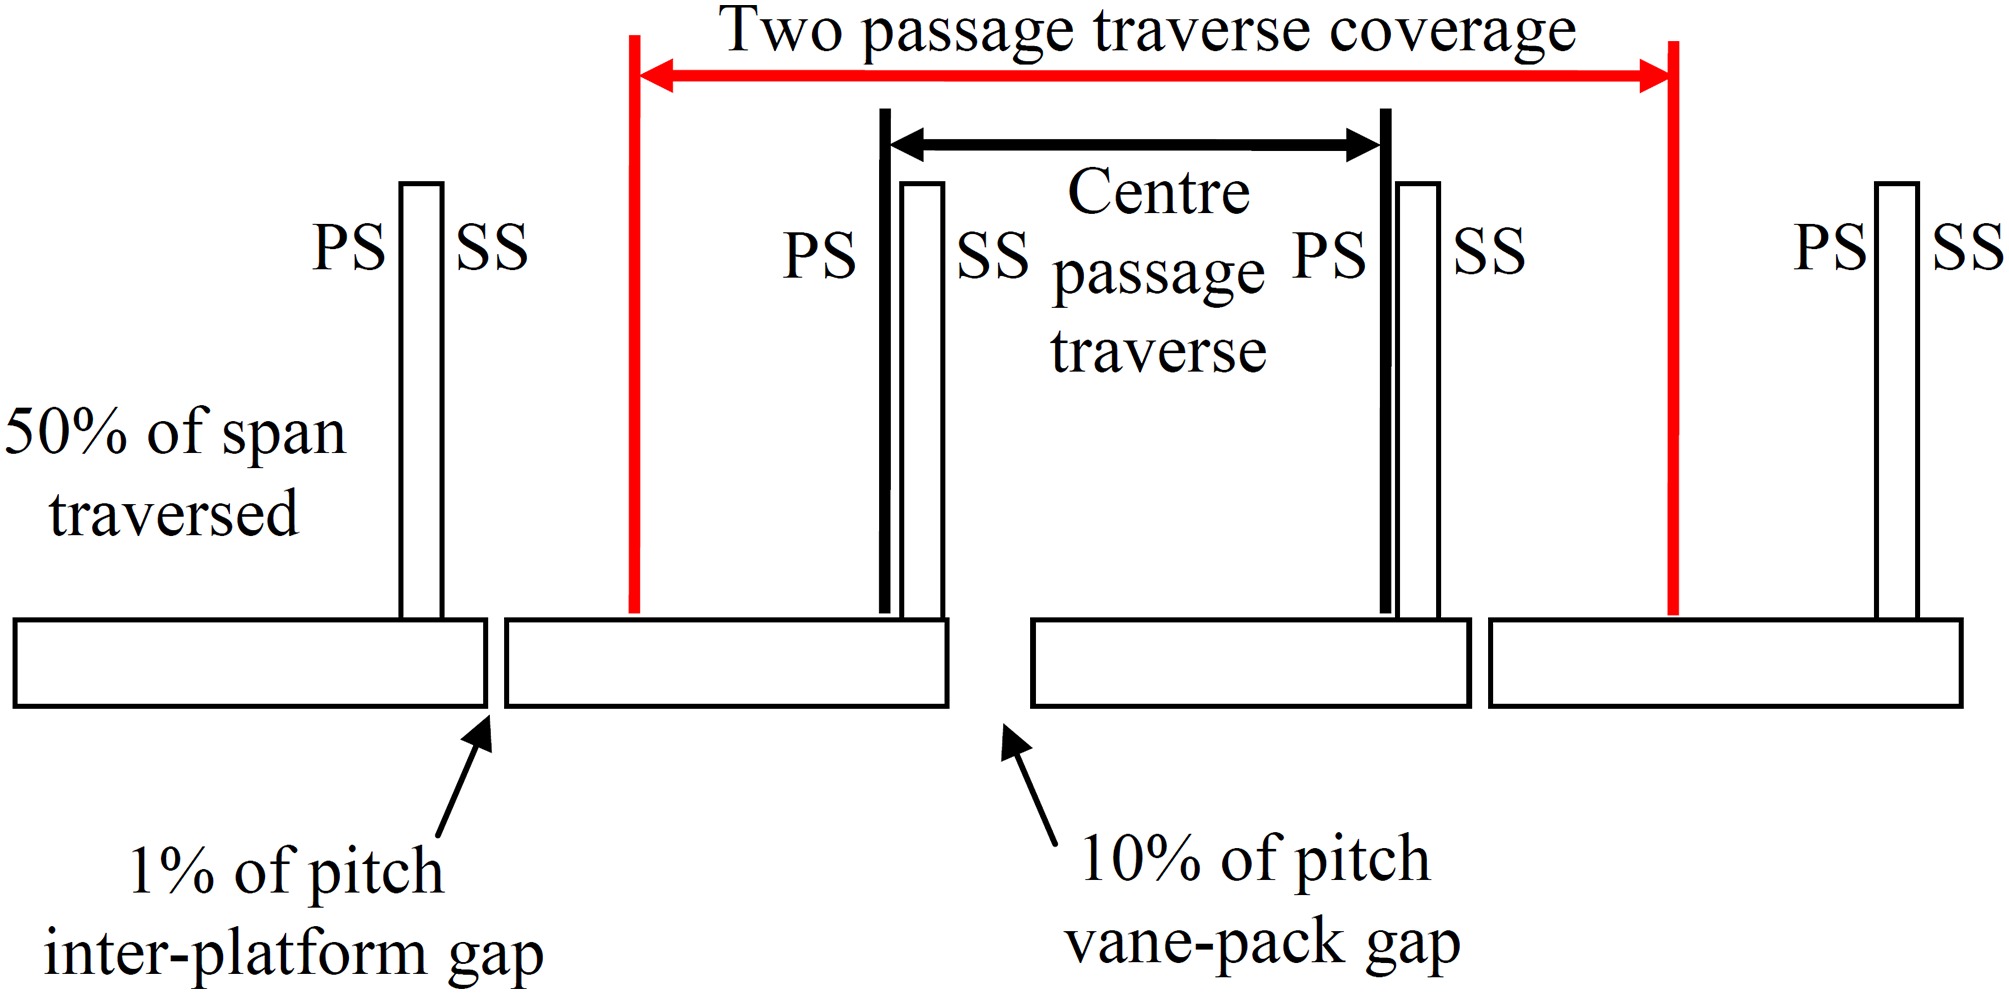
The effects of different gaps in the hub platform will be investigated by comparing three geometries: the smooth endwall (where the gap was covered over), the 1% of pitch inter-platform datum case and the 10% of pitch vane-pack gap. In an aero-engine, the vane-pack gap does not appear in every passage so only one was included in the linear cascade. For all previous cases, the change in the stagnation pressure coefficients has been calculated using an average from a traverse spanning two blade passages. For the vane-pack gap the average is calculated both for the two-passage traverse, and for just the centre passage as shown in Figure 11.
Figure 11.
Location of the vane-pack gap relative to the coverage of the traverse system as seen from the trailing edge of the cascade.
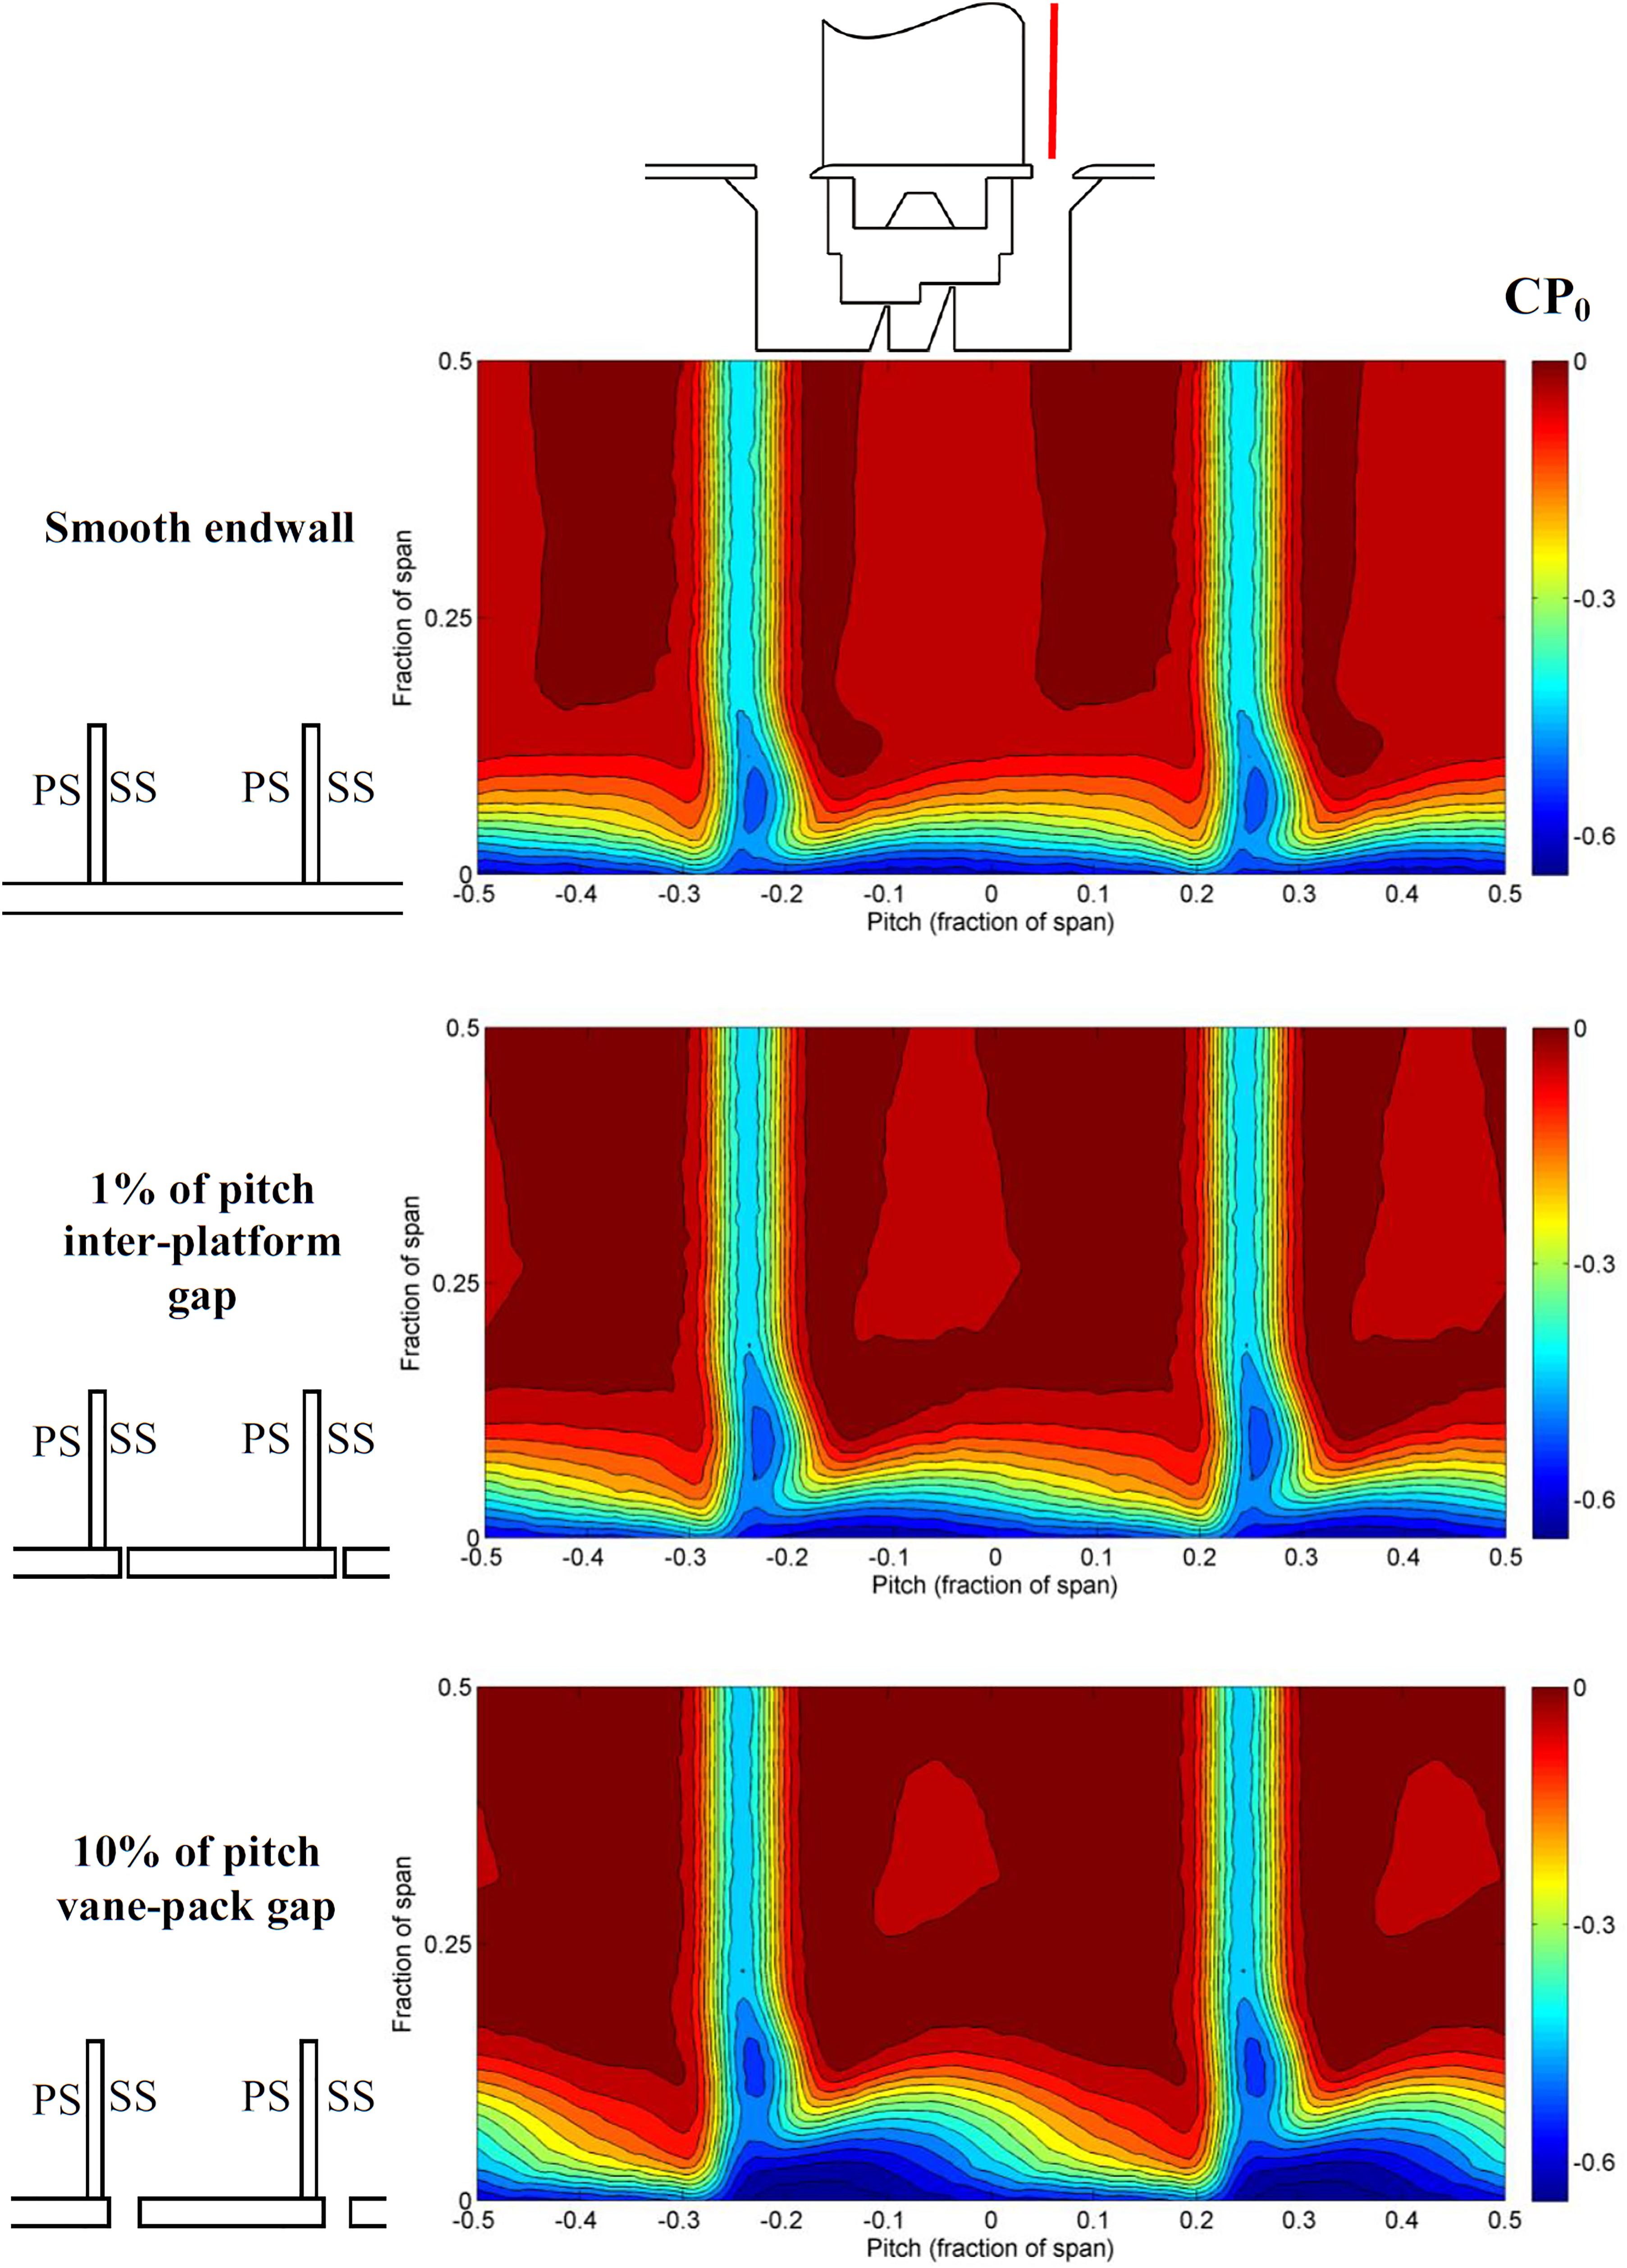
The measured contours of the stagnation pressure coefficient for the cases of a smooth endwall, a 1% of pitch inter-platform gap in each passage and a 10% of pitch vane-pack gap in the centre passage are shown in Figure 12. The differences between the smooth endwall and 1% inter-platform gap cases are difficult to see, however there is a small area of low stagnation pressure coefficient centred just above the 1% inter-platform gap that is not present on the smooth endwall case. Comparing the 10% vane-pack gap case against both the smooth endwall and 1% inter-platform gap cases reveals three main differences. The first, and most obvious, is the change to the hub corner loss cores on the left hand wake (at a fractional pitch of −0.25 in Figure 12). For the 10% vane-pack gap the loss core is not as well formed as it is for the case with the 1% inter-platform gap and the intensity of the low stagnation pressure coefficient regions is reduced. The second change to note is the shape and position of the low stagnation pressure region along the hub endwall in the centre passage of the traverse. For the 10% van-pack gap this region of the flow has moved closer to the suction surface than for the 1% inter-platform gap. The intensity of the low stagnation pressure region has also increased directly above and just to the right of the 10% vane-pack gap. The third change to note is in the hub corner loss cores of the right hand wake (at a fractional pitch of 0.22). The size and intensity of the loss core for the 10% vane-pack gap has decreased relative to the 1% inter-platform gap case. This indicates that the presence of the 10% vane-pack gap affects not only the passage in which it is located, but also the passage adjacent to the pressure side of the passage with the large gap. However, it would require further work, possibly using multi-passage CFD, to complement the trailing edge traverses to identify the mechanism which affects the flow in the adjacent passage.
Figure 12.
Measured stagnation pressure coefficient at the trailing edge for a smooth hub endwall, a datum 1% of pitch inter-platform gap and a 10% of pitch inter-platform gap (1% fin-seal clearance and Vy, cav = 0.4U).
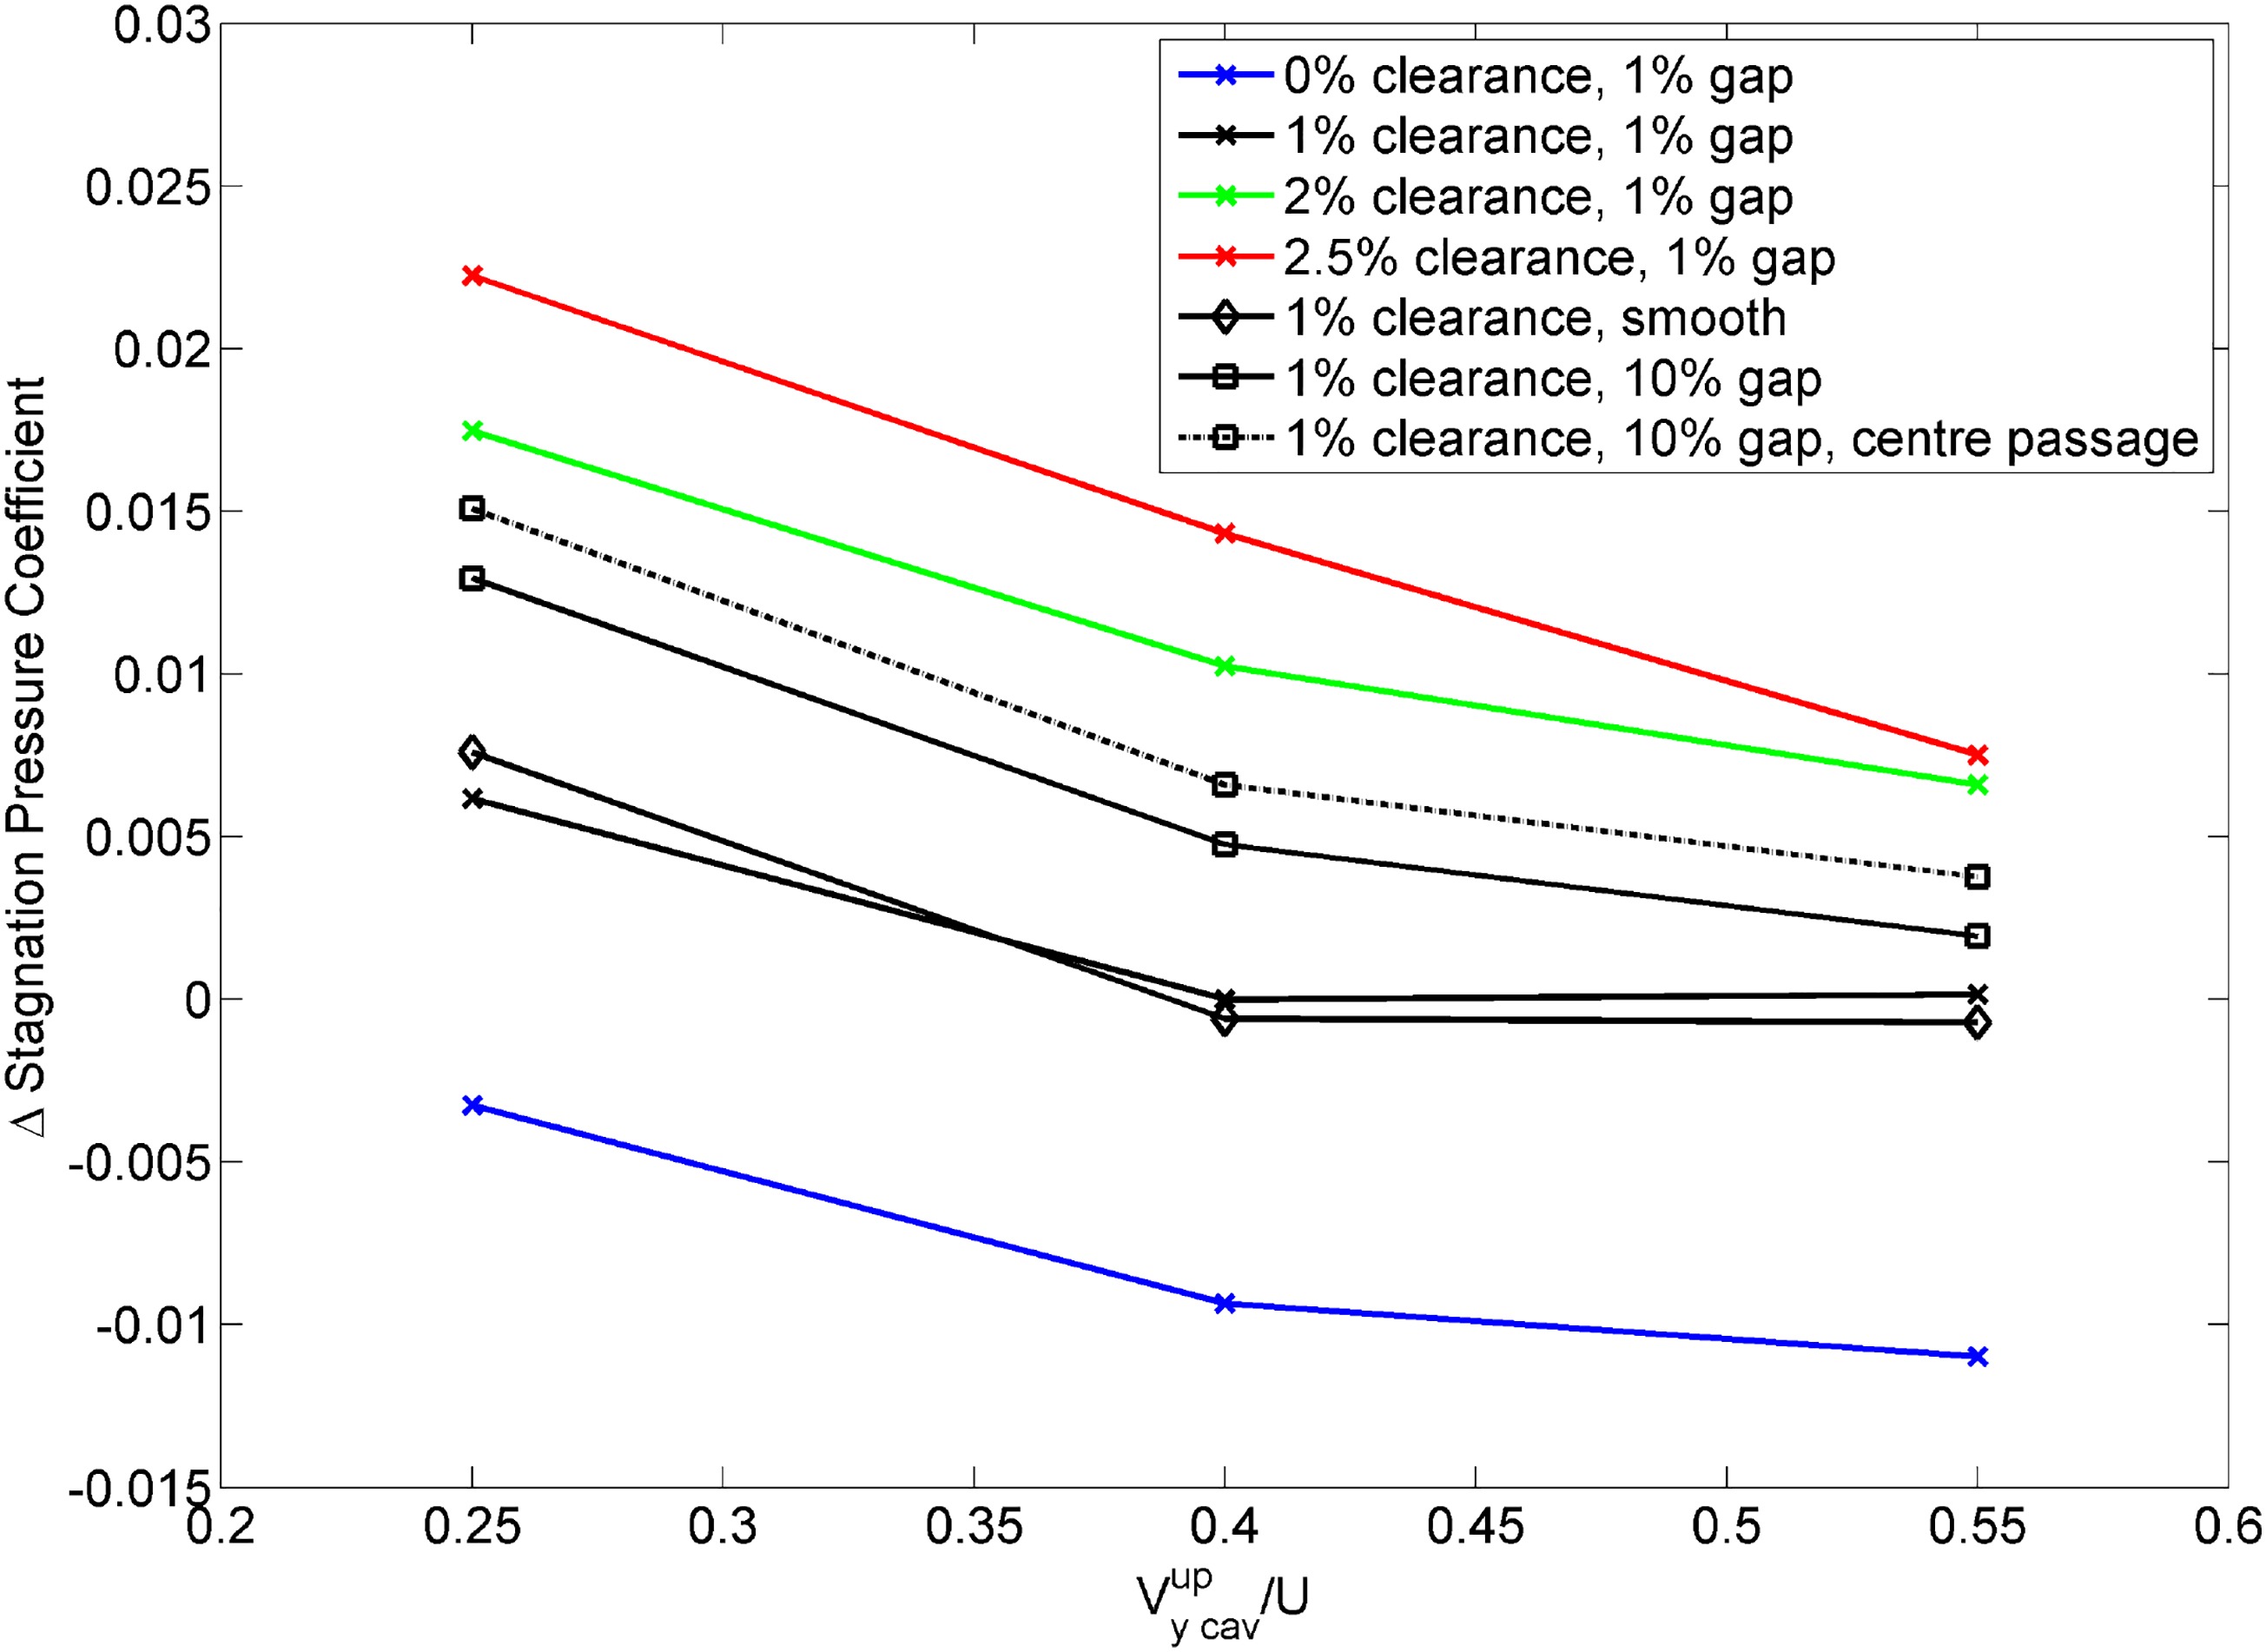
The effect of varying the tangential velocity in the upstream cavity on the stagnation pressure coefficient measured at the downstream traverse plane for the smooth, 1% inter-platform gap and 10% vane-pack gap cases will now be investigated. The results are shown in Figure 13 and, for convenience, are presented relative to the datum geometry of the 1% of inter-platform gap case with a tangential velocity of 0.4U in the upstream cavity. Although the smooth and 10% vane-pack gap cases investigated were at a 1% fin-seal clearance, the datum 1% inter-platform gap cases are shown for a range of fin-seal clearances to indicate the likely effect of changing the leakage flow beneath the stator-shroud. The smooth endwall cases at 0.4U and 0.55U are slightly better (about 0.1% of dynamic head) than the 1% inter-platform gap case. At 0.25U the smooth endwall is slightly worse (about 0.2% dynamic head) than the 1% inter-platform gap case. Whilst the measurements show a consistent trend, it should be noted that the levels of change between the smooth and 1% of pitch inter-platform gap are comparable to the measurement accuracy of the 5-hole probe. The 10% van-pack gap case is worse than the 1% inter-platform gap for all upstream cavity tangential velocities. It corresponds to approximately half way between the 1% and 2% fin-seal clearance for the 1% inter-platform gap case.
Calculating the effects of gaps
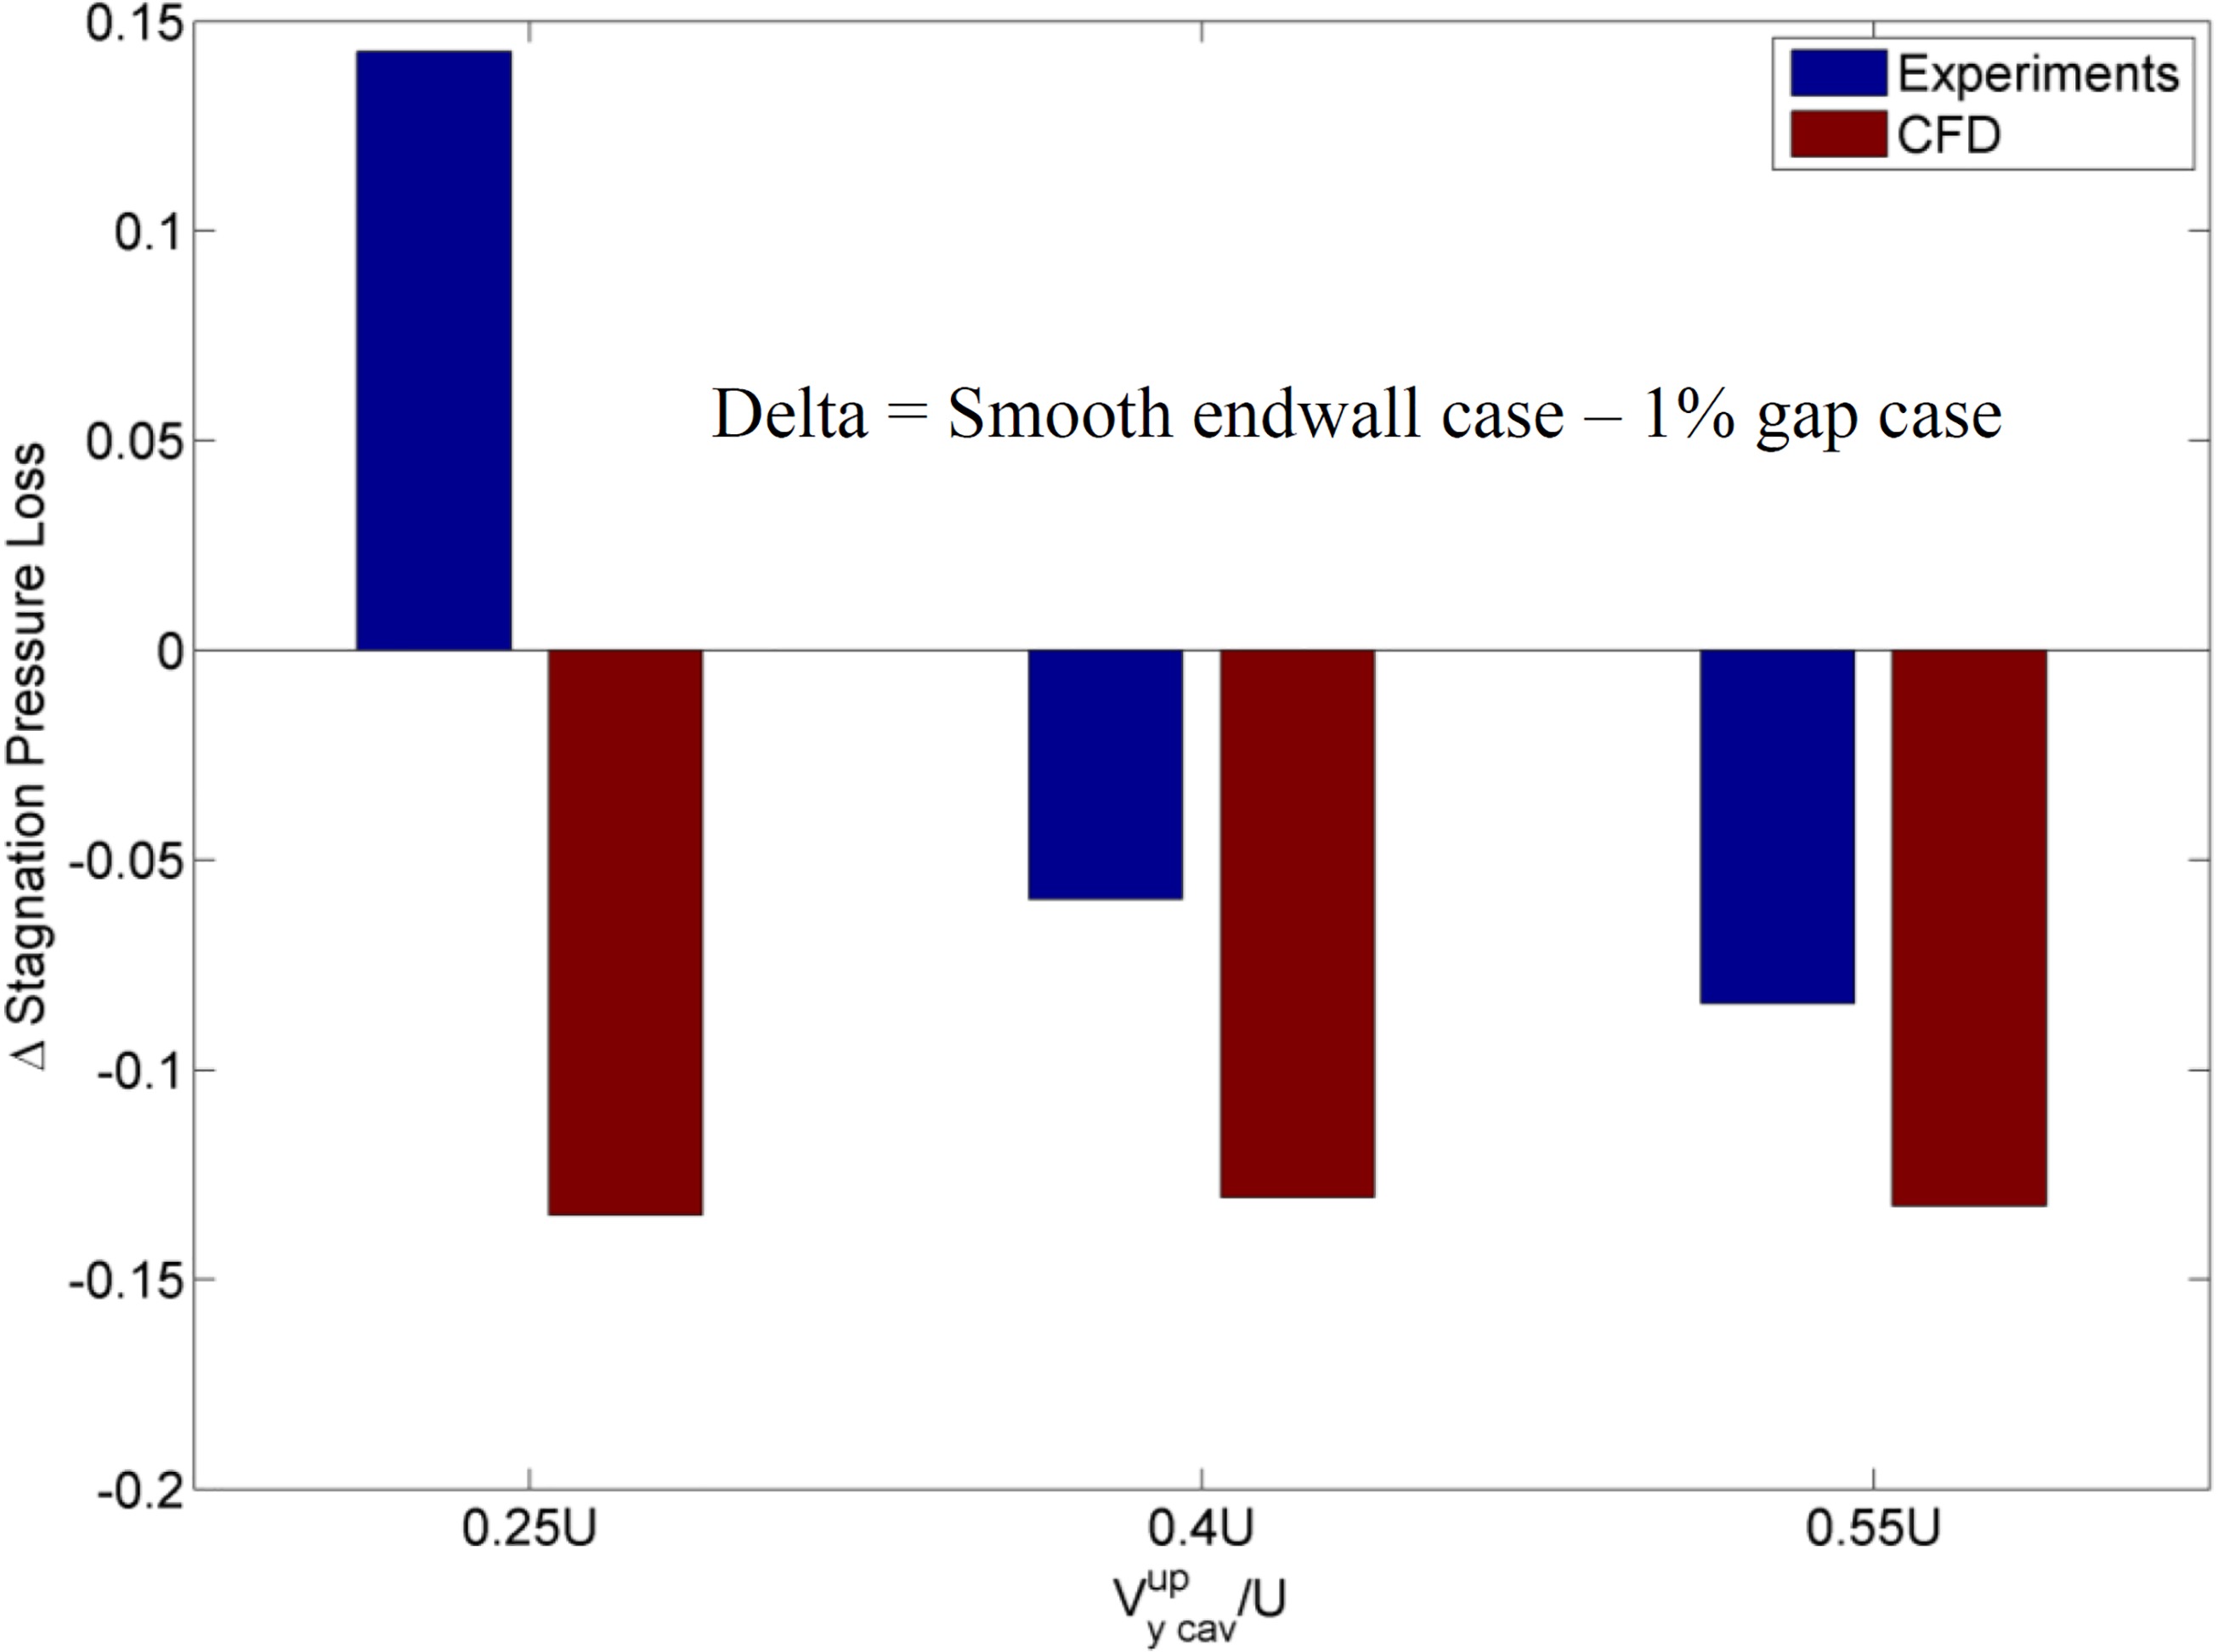
It has been shown, Figure 10, that the computational method is able to capture the effects of both varying the tangential velocity in the upstream cavity and changing the fin-seal clearance beneath the stator on the stagnation pressure coefficient at the downstream traverse plane for the datum platform geometry of a 1% inter-platform gap in each passage. Those changes are quite large, covering a range of −1% to +3% of dynamic head. In this section the platform geometry is being changed and it is worthwhile to ascertain if the computational method can identify smaller differences. The measured and calculated differences between the smooth endwall and the 1% inter-platform gaps are shown in Figure 14 for a range of tangential velocities in the upstream cavity. Whilst there is a consistent trend in the measured difference (+0.14% to −0.08%), the computational method does not identify any effect of the tangential velocity but does calculate that the smooth endwall is worse (−0.13%) than the 1% inter-platform gap case. Although these differences are comparable to the measurement accuracy, they do suggest that the smooth endwall is slightly worse (∼0.1%) than the datum geometry of 1% inter-platform gaps in each passage.
Figure 14.
Comparison of the change in the stagnation pressure coefficient between calculations and experiments for cases with and without inter-platform gaps.
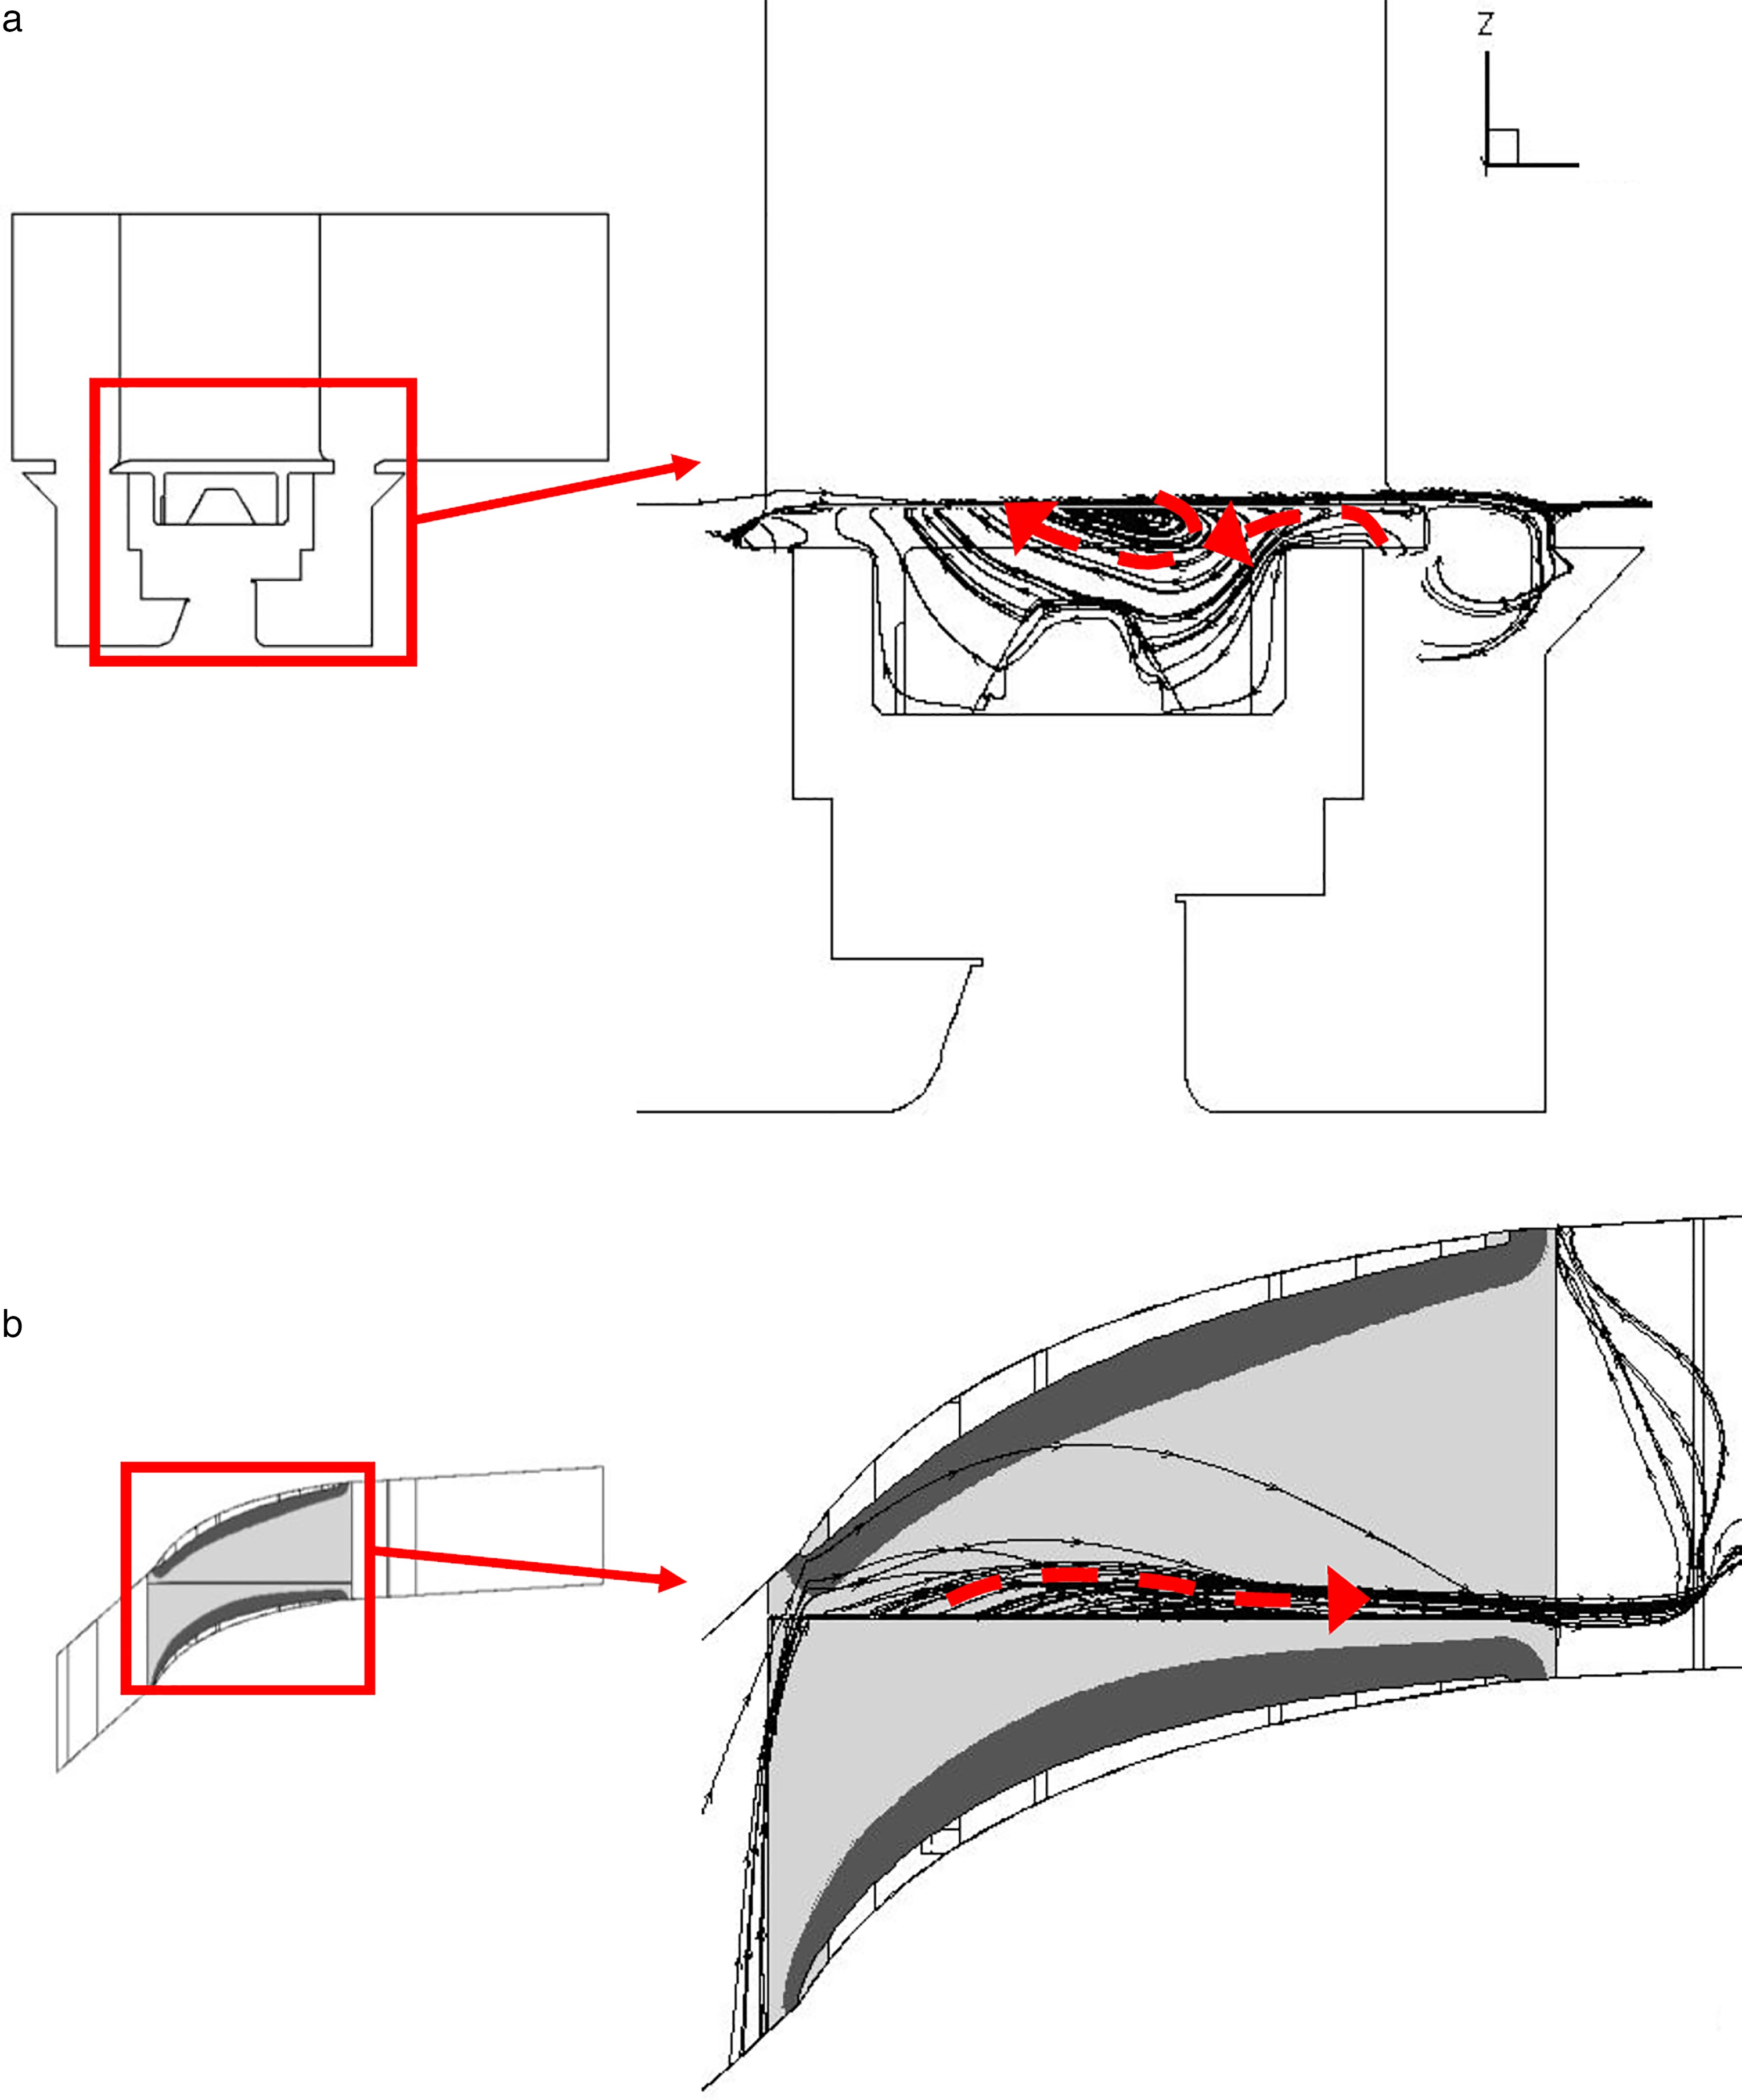
The computational method will now be used to investigate the flow structure for the datum platform geometry (1% inter-platform gap within each passage) for a tangential velocity of 0.4U in the upstream cavity. The calculated streamlines are shown in Figure 15. The flow enters the inter-platform gap from both the downstream cavity and from the last third of the axial chord of the passage, Figure 15a. It is then driven upstream along the gap by the adverse pressure gradient within the blade row. The flow re-enters the passage in the first third of axial chord. It then interacts with the passage flow and is turned into the downstream direction, Figure 15b and interacts with the gap region again towards the trailing edge. This process of the gap flow entering the passage in the first third of the axial chord and then re-entering the gap in the last third of the axial chord will be used to interpret the flow structure.
Figure 15.
Calculated streamlines showing the progress of the leakage flow through the inter-platform gap.
To understand how the gap flow affects the development of the passage flowfield, contour plots of the stagnation pressure coefficient are extracted from the calculations at four different axial positions as shown in Figure 16. This has been done for the smooth endwall, 1% inter-platform gap and 10% van-pack gap cases. In Figure 16, the first row shows the evolution of the hub flows for the smooth endwall case. With no discontinuities in the endwall the flowfield is smooth and there is a steady growth of the endwall boundary layer. With the presence of a 1% of pitch inter-platform gap, second row in Figure 16, a region of low stagnation pressure fluid can be seen to accumulate on the pressure surface side of the gap. This is the fluid that has exited the gap and re-enters the mainstream. The size of this region grows between the first and second slice planes as more fluid exits the gap. Progressing further down the passage the size of this low stagnation pressure region begins to reduce as fluid is being drawn down into the inter-platform gap. At the final slice plane the region has almost completely been removed and the flowfield is very similar to that of the smooth endwall case. This is the reason the two cases show similar results at the trailing edge traverse plane, shown in Figure 12.
Figure 16.
Calculated contours of the stagnation pressure coefficient at various axial location within the passage for the three different gap cases.
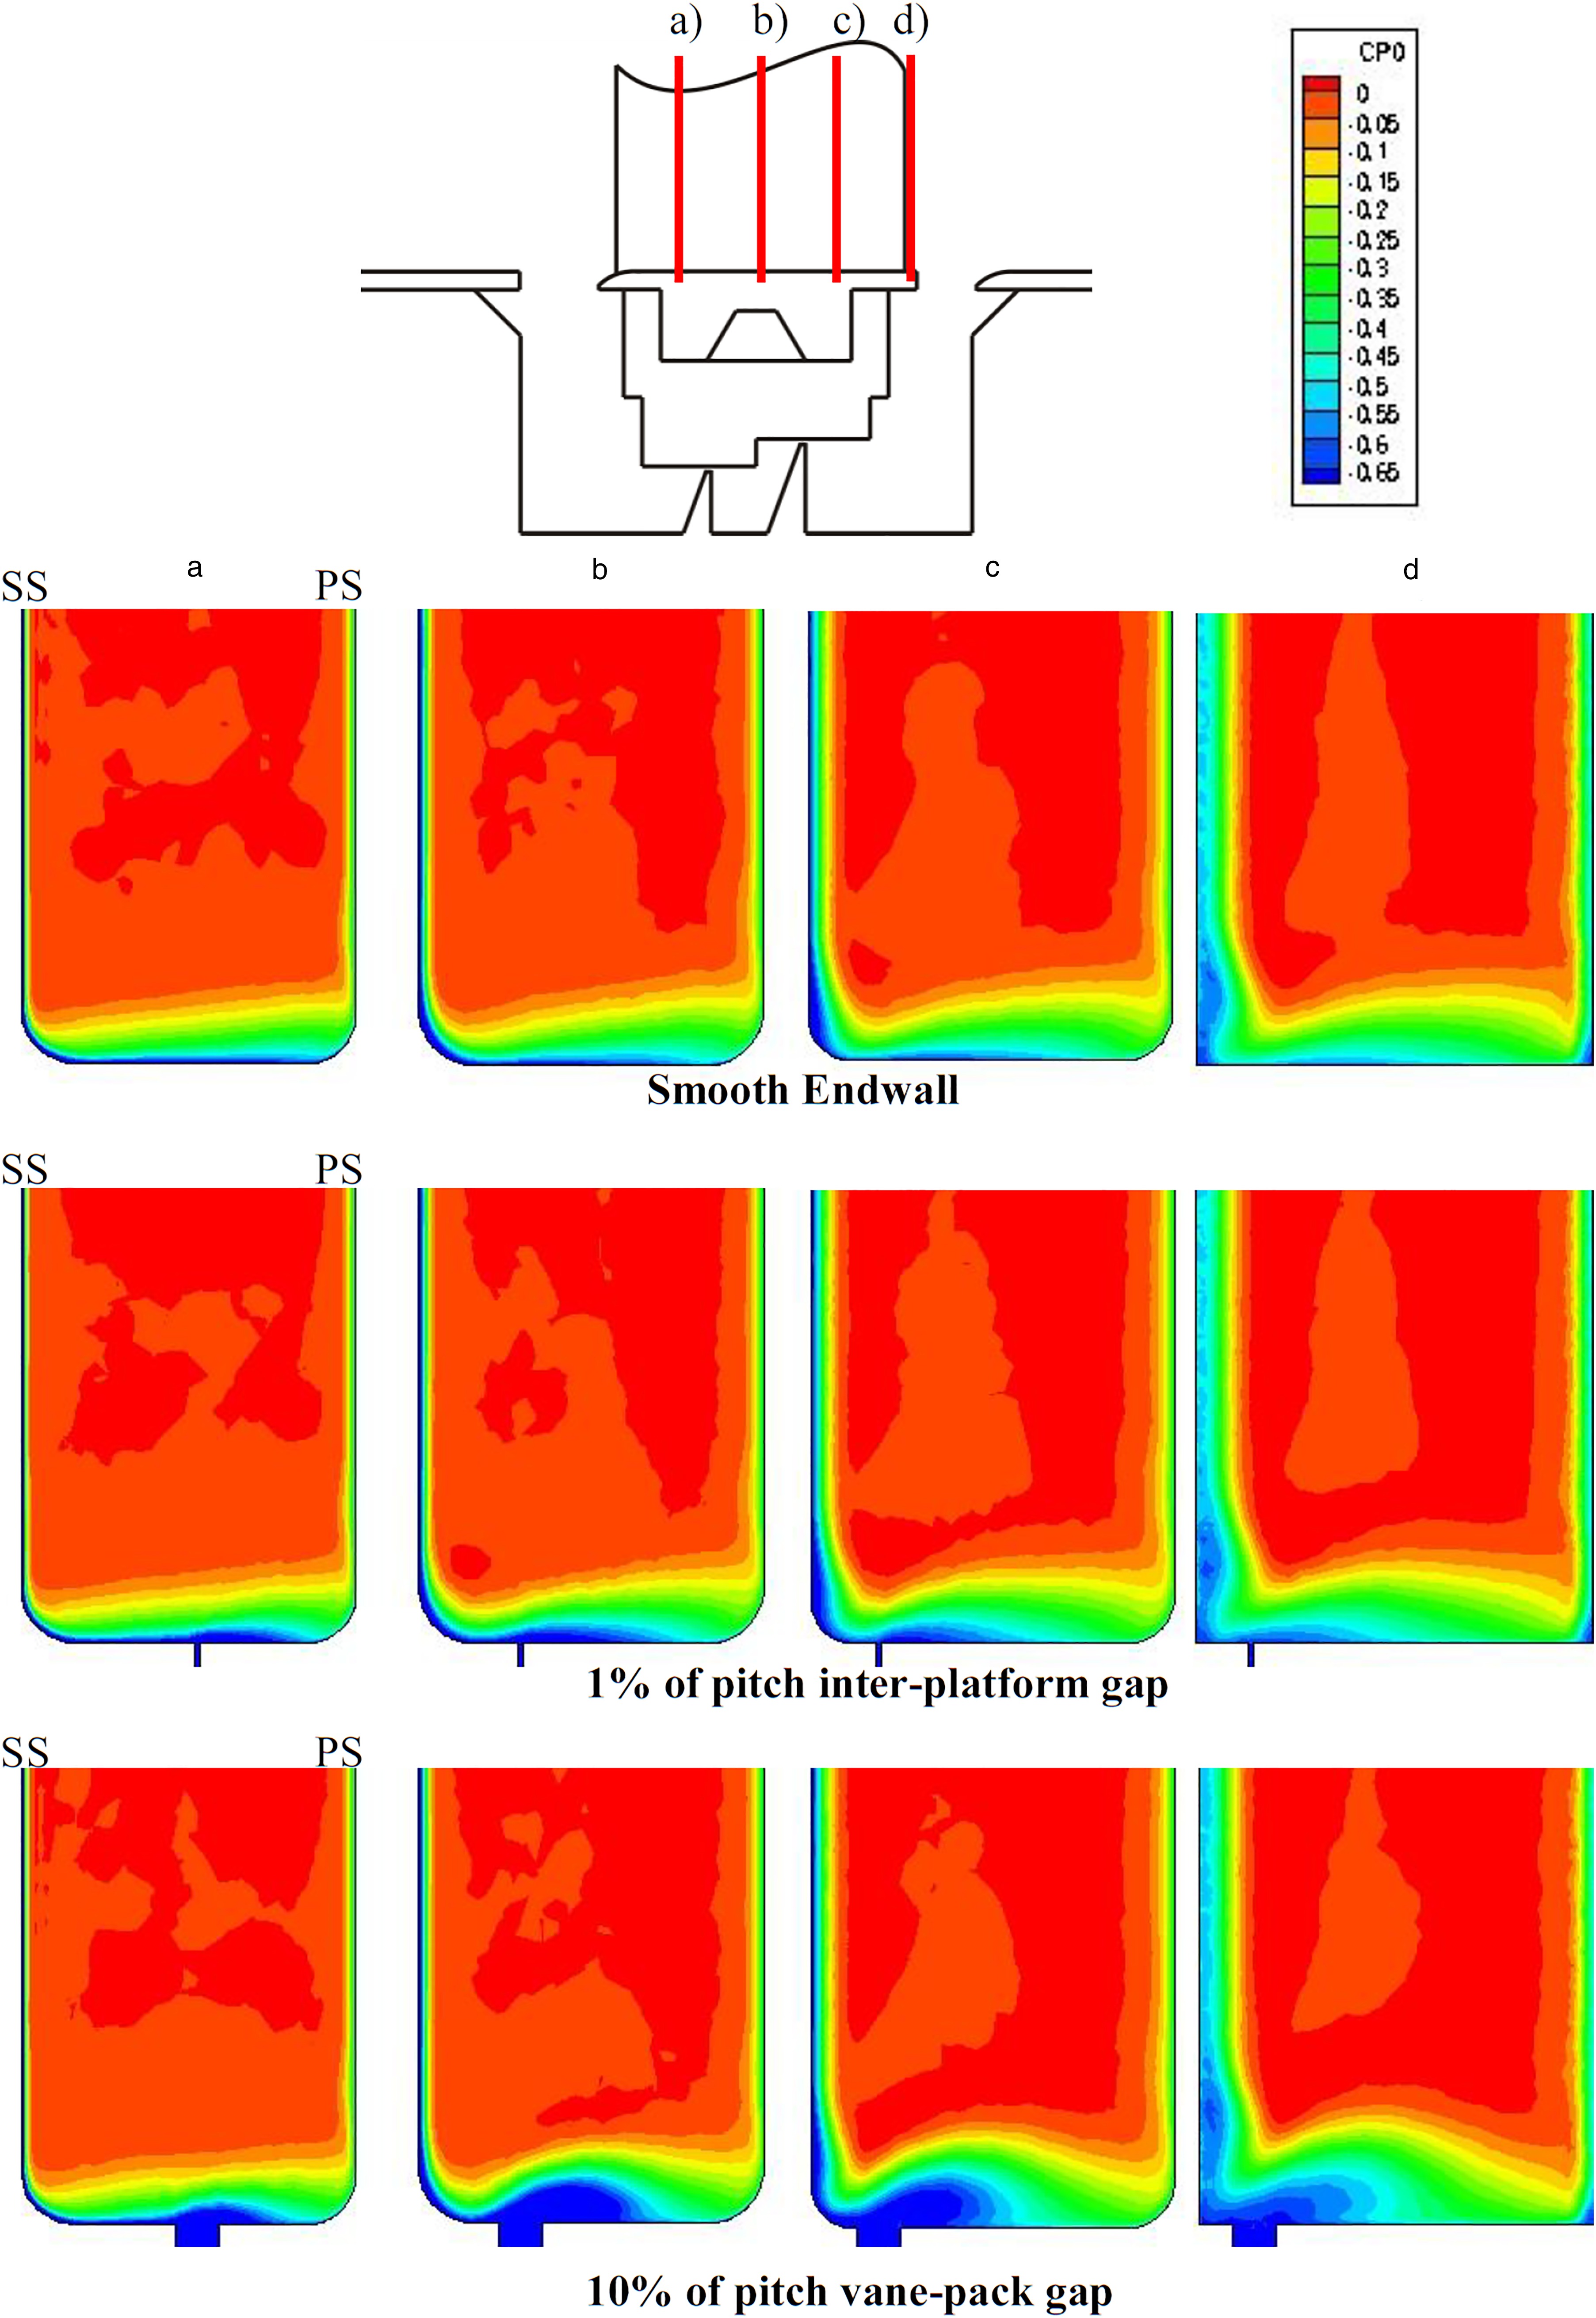
The third row of Figure 16 shows the calculated contours of stagnation pressure coefficient for the 10% of pitch vane-pack gap. It has a larger effect than the smooth endwall and 1% inter-platform cases, due to the fact that more flow is able to move along the gap. Tracking the changes of the endwall flows in Figure 16 shows a large region of low stagnation pressure above and to the right of the gap. As with the 1% of pitch gap, this region grows in the first half of the passage but reduces in size towards the trailing edge. However as the volume of flow through the gap is much greater in this case, it is reinjected higher into the mainstream and hence it has a greater presence at the trailing edge. Near to the trailing edge the 10% vane-pack gap is very close to the suction surface. Hence, in the last third of the axial chord the fluid that enters the gap has been prevented from feeding into the loss cores. This movement of the flow provides an explanation as to why the measurements showed a reduced strength of the loss cores in Figure 12 for the 10% of pitch van-pack gap case.
Misaligned hub platforms
Because of the manufacturing process, it is possible for the hub platforms to be misaligned relative to one another. This misalignment is estimated to be up to 1% of span and results in a step between pressure surface and suction surface sides of the inter-platform gap. Ideally in order to maintain the blade passage area in the linear cascade, one side of the inter-platform gap should be raised by 0.5% of span while the other reduced by the same amount. However this would involve changing all of the hub platforms in the cascade. As only the centre two blade platforms could be easily changed, the steps were introduced by increasing the platform height uniformly across the pitch for one of the two central platforms in turn. The stagnation pressure coefficient measured at the trailing edge are shown in Figure 17 with adjacent cartoon indicating the platform configuration. It should be noted that the pressure surface high (PS High) case actually shows both step configurations with the right passage corresponding to the suction surface high (SS High) case.
Figure 17.
Contours of the measured stagnation pressure coefficient for misaligned and aligned hub platforms.
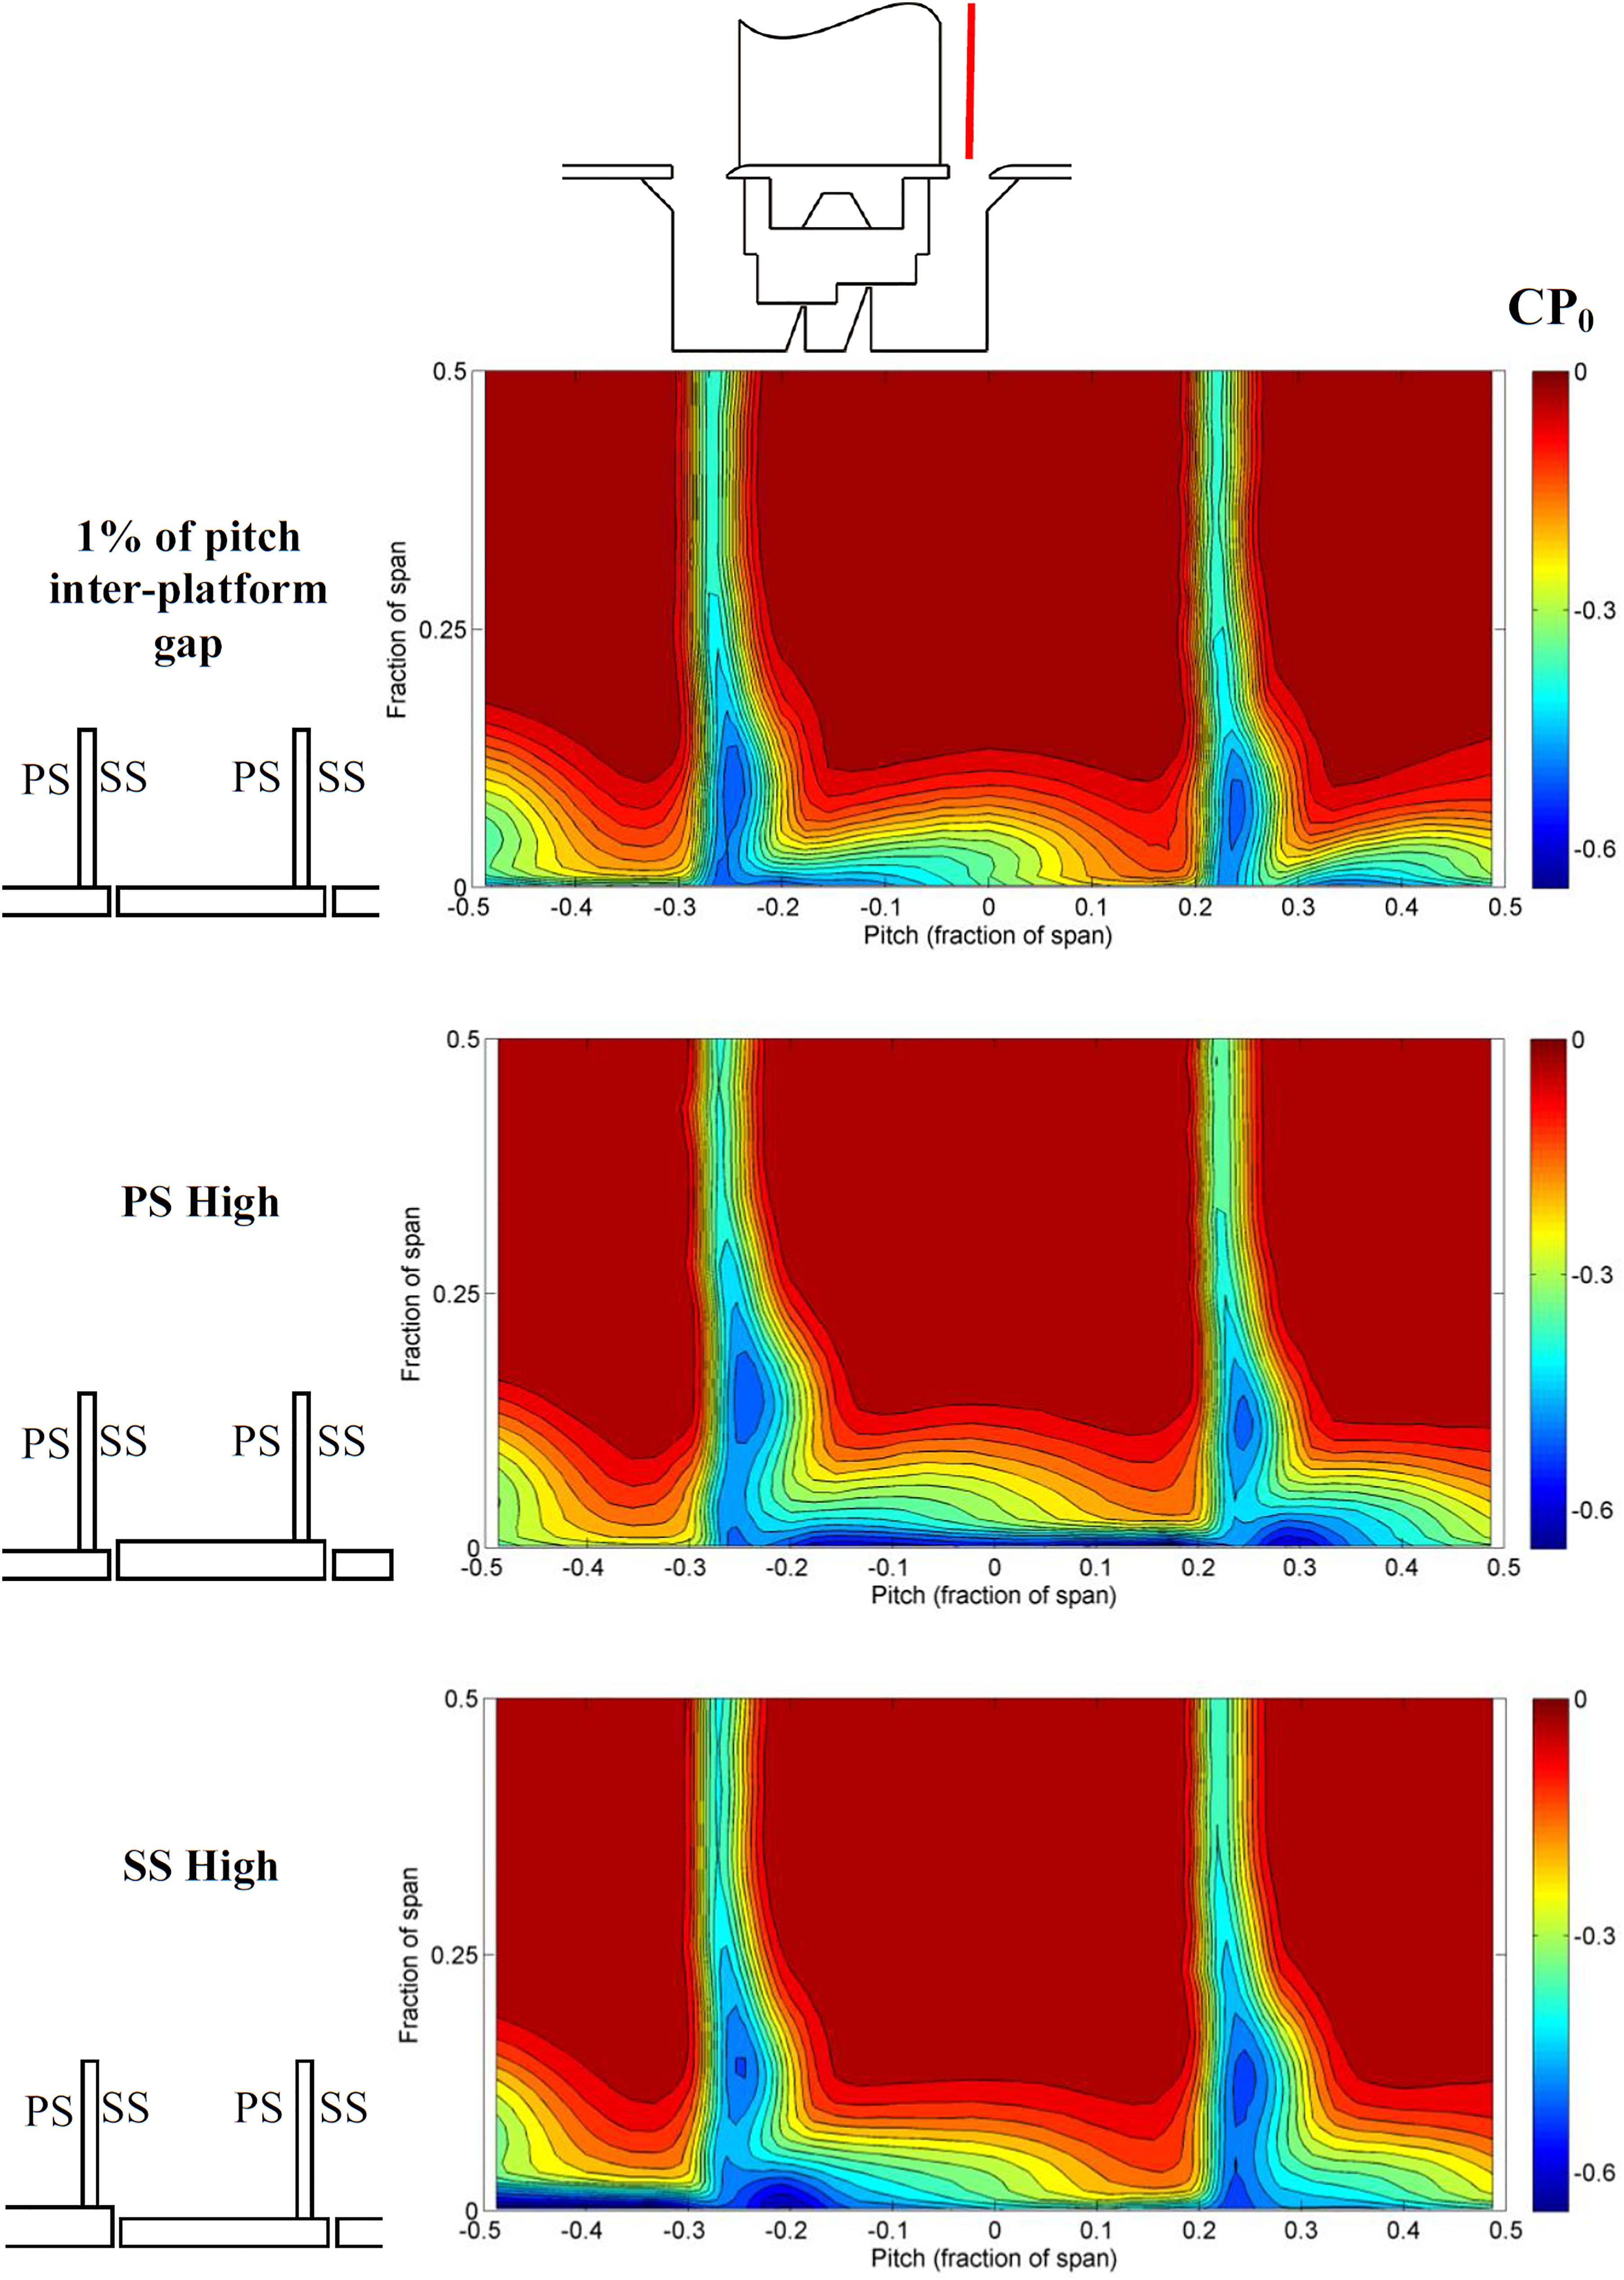
Comparing the contour plots, Figure 17, of the pressure surface high case against the datum platform (1% gap) shows an increase in the size and spanwise extent of the loss core on the wake on the suction surface side of the centre passage. Across all of the hub platform there is an intense region of low stagnation pressure coefficient which is due to the increased hub line (the probe is reading below the level of the hub). Figure 17 also shows the change between the suction side high and the datum cases. This shows that the loss core has slightly increased in size relative to the datum case and has also increased in spanwise location (although some of this increase is due to the hub platform being raised in this area). The changes seen for this configuration are not as pronounced as for the pressure side high configuration. The most obvious change is the intense region of low stagnation pressure coefficient accumulated up against the face of the step at a fractional pitch value of 0.2 of span. This lines up with the location of the step in the hub platform at the trailing edge. The same feature can be seen on the right hand passage of the pressure side high case which has the same orientation step as the suction side high case.
The effect of the tangential velocity in the upstream cavity on the measured change in stagnation pressure coefficient for the PS High and SS High cases are shown in Figure 18 (the previous results for the datum case at different fin-seal clearances are included for comparison). The results show that a step of either alignment increased the change in stagnation pressure coefficient relative to a smooth hub platform. The tests show that the PS High case has the larger deleterious effect of the two configurations, however this observation may be slightly affected by the region of low stagnation pressure present where the traverse is just below the hub line.
Figure 18.
Overall change in the stagnation pressure coefficient as a result of misaligned hub platforms.
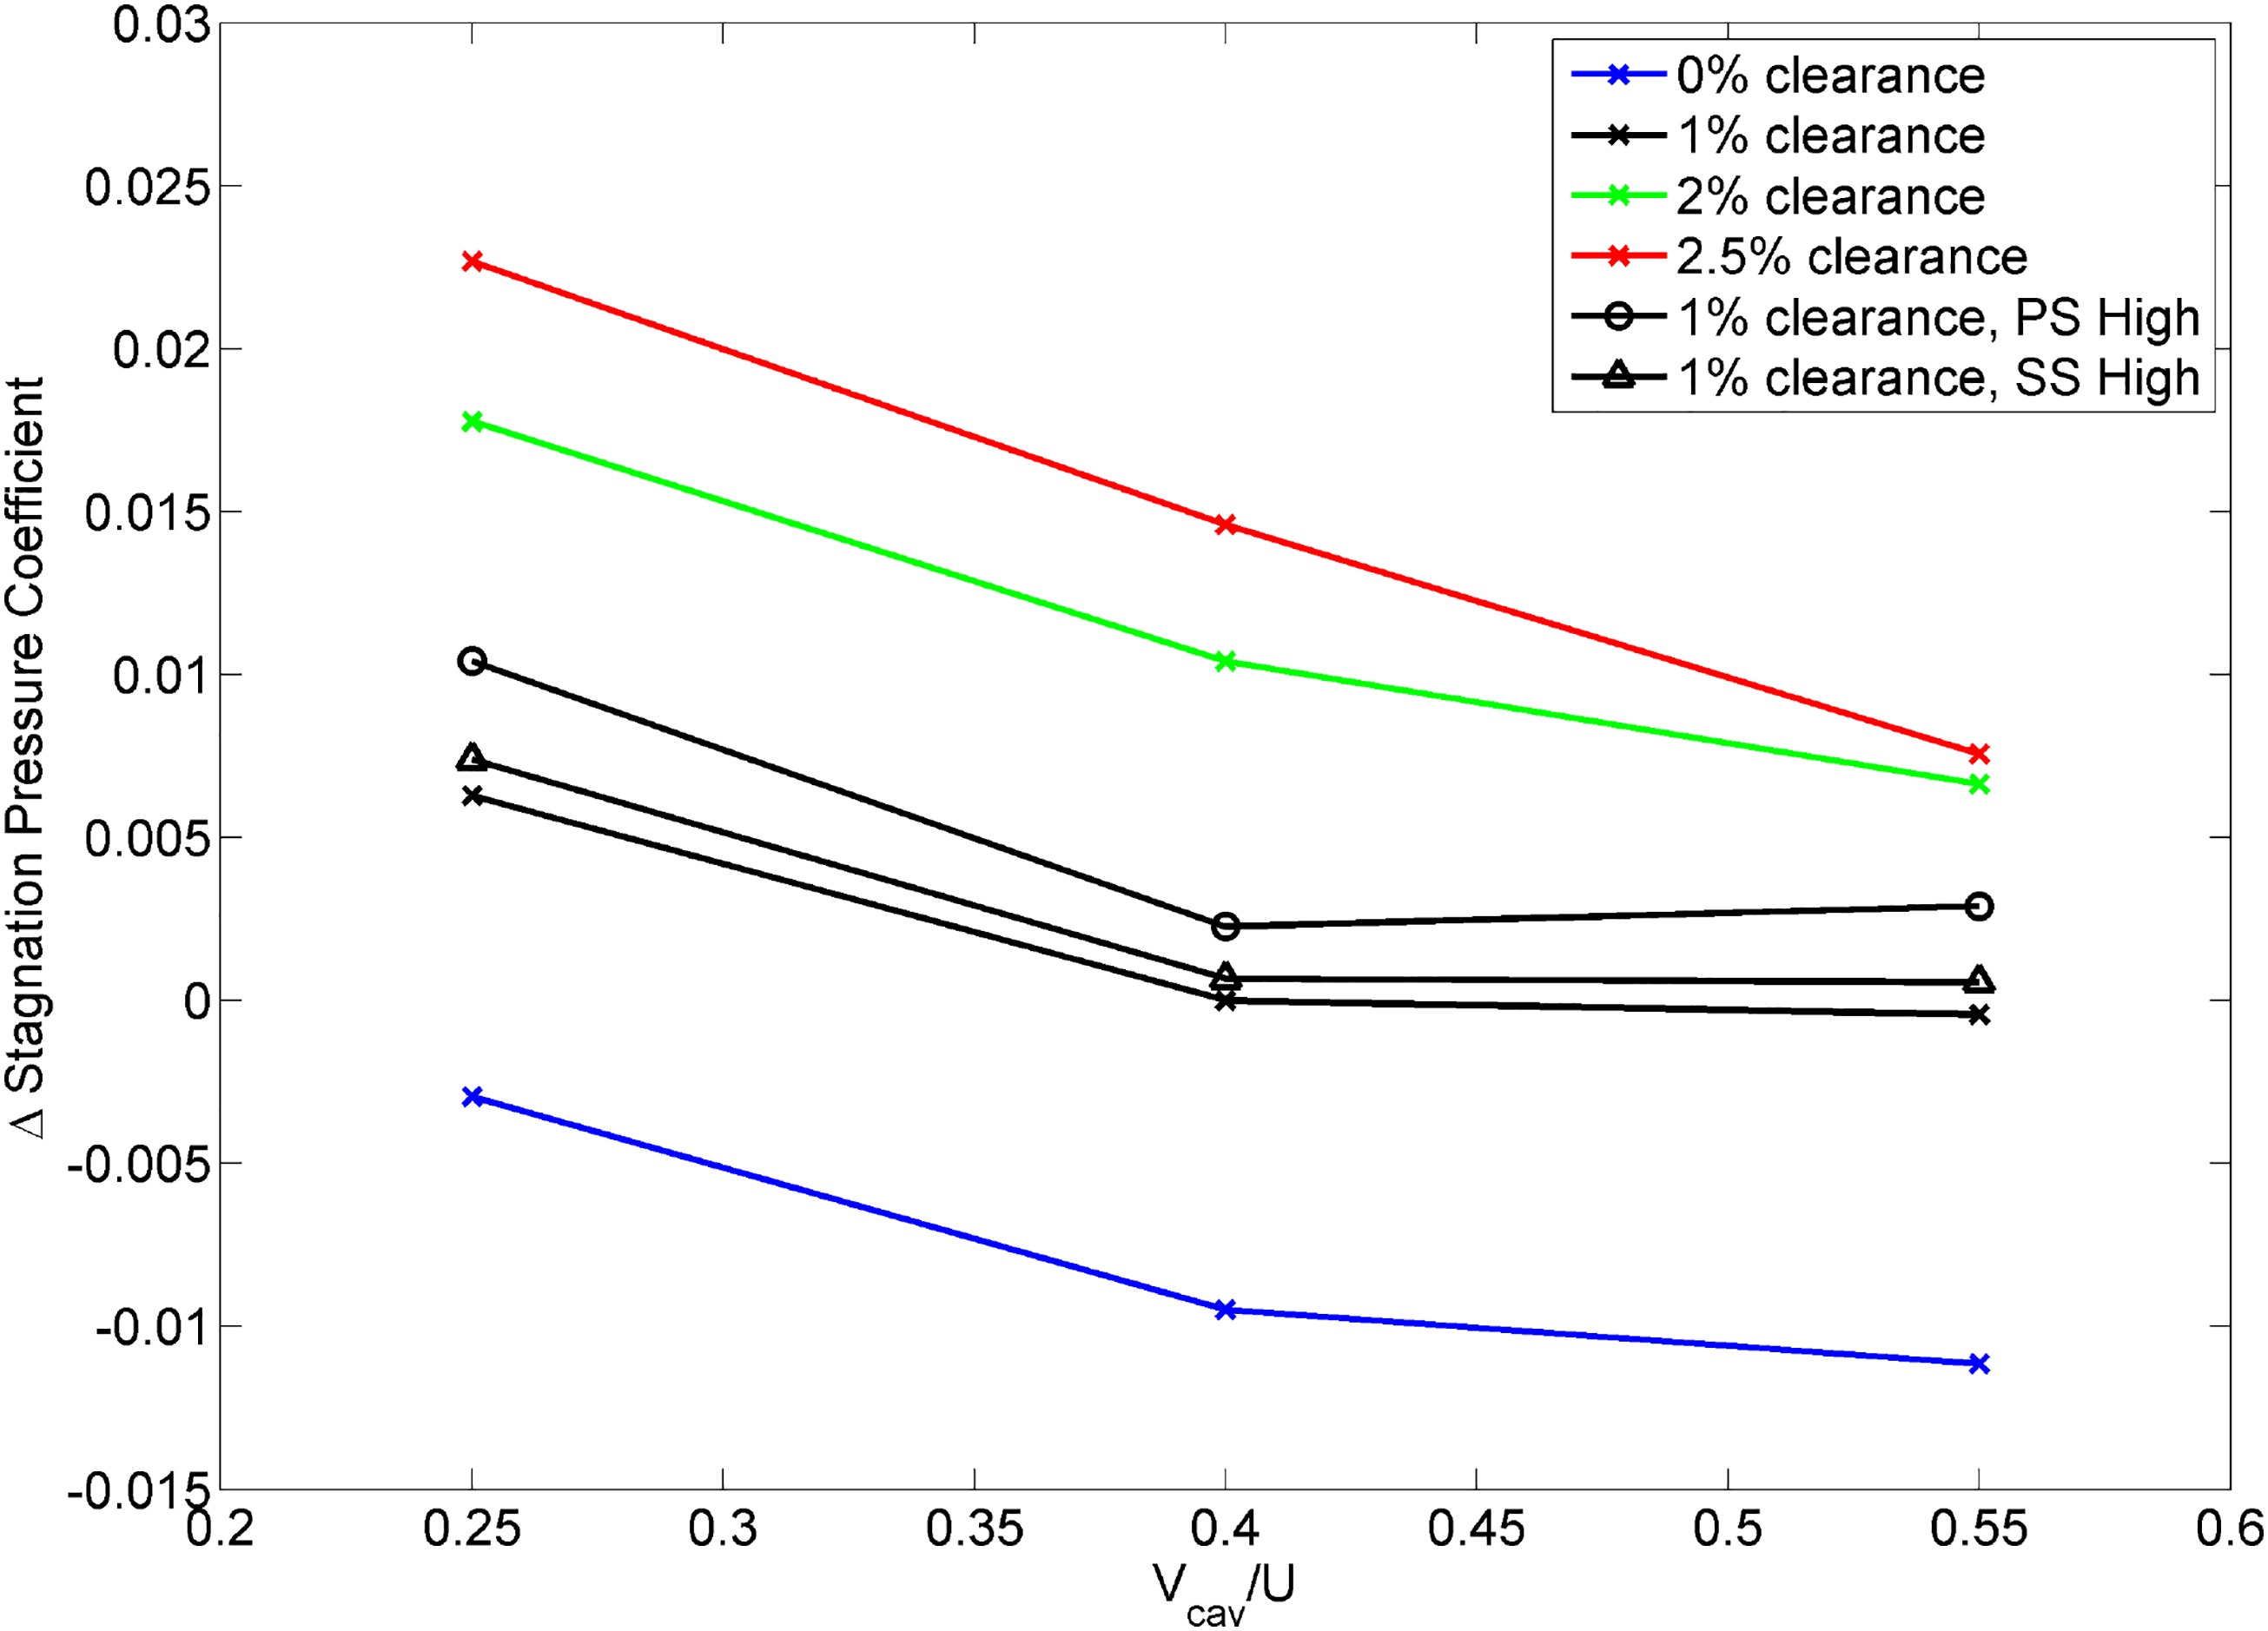
The computational investigation of the platform misalignment (not shown) also predicted a larger reduction in the stagnation pressure through the passage for both configurations when compared with the datum case but the ranking of the misalignments is reversed relative to the measurements. The change in the order of the ranking may be due to the calculation being fully turbulent or due to the calculations being a single passage with an inclined hub platform rather than multi-passage.
Conclusions
While the primary focus has been to investigate the impacts of real geometry features on the performance of a blade row, the investigation highlighted the importance of boundary layer skew. The natural skewing of a boundary layer in a compressor helps to offset the secondary flow. Typical linear cascades would feature a collateral boundary layer and would therefore have larger secondary flow structures than would be seen in a compressor. For realistic endwall flow structures a novel method was developed to introduce a skewed boundary layer. The method involves injecting flow along the endwall at an angle to the mainstream flow. Careful selection of the flow rate and the blowing angle allowed the boundary layer displacement and tangential momentum thicknesses to be controlled.
While the deleterious effects of increased shroud leakage are well known, the results presented in this paper show the combined effect of leakage and whirl pickup. For the majority of cases tested, a 1% increase in the fin-seal clearance results in a 1% increase in the change of stagnation pressure coefficient. Increasing the tangential velocity in the upstream shroud cavity has the effect of offsetting the secondary flows and as a result reduces the change in the stagnation pressure coefficient. Increasing from 0.25U to 0.4U results in a 0.6% of dynamic head reduction in the change of stagnation pressure coefficient. This is seen at all fin-seal clearances. At higher upstream cavity tangential velocities, and at small fin-seal clearances (≤1% of span) the reduction of the change in stagnation pressure coefficient starts to level off as the endwall flows are kept on the hub and their interaction with the suction surface is reduced. Increased fin-seal clearances result in higher leakage flows but also lower upstream cavity tangential velocities, both of which are detrimental to blade row performance.
The experiments and calculations shown that steps and gaps on the endwall have a deleterious effect on the blade row performance. Within the gaps, flow is able to recirculate upstream where upon reinjection it causes a change to the local flowfield enhancing the secondary flow. Table 3 shows a ranked list of the impacts of the different real geometry features discussed within this paper. This table shows that fin-seal clearance and the resulting shroud leakage dominates the losses within a shrouded stator blade row. As at higher clearances, the whirl pickup will also be reduced, so maintaining as small as possible fin-seal clearance must remain a priority. Misaligned endwalls cause the next largest increase of loss within a blade row and therefore minimising variations in manufacture and assembly must be emphasised. While the impact of gaps on the endwall is the smallest effect, keeping the gaps as small as possible, and reducing the number of vane-pack gaps, will help improve overall efficiency.