Introduction
Steam turbine manufacturers want to realize the highest turbine and cycle efficiency for power plants. The aim is to reduce the green house gas output as much as possible to reduce environmental impacts. This aim can be achieved by optimizing the blades and flow paths, reducing leakages between stationary and rotating components, using improved seals or by increasing the main steam conditions like pressure and temperature. Since turbine components such as casings or rotors are highly stressed e.g. by thermal gradients in the materials, the temperatures in each load case have to be known as accurately as possible. The more precisely the stress distribution is known in the design process, the more exact the components life time can be predicted.
A contra directional effect can occur in labyrinth seals optimization: windage heating occurs due to rotor rotation. Windage heating leads to a temperature increase of the steam that flows through the labyrinth. The smaller the radial clearance of the seal, the lower the mass flow through it is, which can result in large temperature increases. The effect is strong in case where the labyrinth is long with many fins, e.g. in labyrinth seals on a thrust balance piston. If the design goal is to minimize leakage mass flow by use of such types of seals in combination with higher inlet temperatures, then the effect of windage heating may become an important design consideration.
Current state of research
The first law of thermodynamics describes the effect of rotor rotation on total enthalpy increase ∆ht:
Due to rotor rotation with the frequency ω, a torque M acts onto the steam mass flow
For a given mass flow and labyrinth geometry, the most important value to be calculated is the rotor torque to predict the temperatures in the labyrinth. The link between M and the circumferential shear in the flow τu can be expressed as:
with the rotor radius r and the wetted rotor surface A. τu describes the wall shear in circumferential direction, which can also be expressed by a friction coefficient cfu according:
The variables ρ and cu shown in represent fluid density and circumferential flow velocity.
Different windage heating models are available in the literature; the models of e.g. 05 and 08 are most popular.
The model of 05 is based on the momentum balance in each labyrinth chamber; at a given inlet momentum the rotor and stator torques as well as the exit momentum can be calculated chamber wise and iteratively. The friction coefficients at rotor and stator are expressed by equations, which depend on a local circumferential Reynolds number.
08 give an empirically determined relationship for the circumferential friction coefficient to be used for calculation of the rotor torque. In addition to the geometry the friction coefficient also depends on the mass flow and circumferential Reynolds number.
Also, equations are available in the literature which model the temperature increase in a rotating labyrinth by approximating it to a single rotating shaft and discs. Sources for information are the publications of 04, 10 and 12.
02 summarize parameters, which influence the windage heating effect and the leakage in a labyrinth seal. They carried out an analytical and a numerical study on short stepped labyrinths to find out that e.g. pressure ratio, geometry, axial Reynolds number, circumferential Mach number and fluid parameters mostly influence the windage and leakage behavior.
13 analyze the influence of honeycomb structures, applied to the stator, on windage heating behavior numerically. The labyrinth investigated is again a stepped labyrinth with four fins. They point out that the windage heating effect increases with the pressure ratio. It is observed further that the gap width between stator and the fins influences the temperature in such a way that it becomes high in case the gap width is low. Finally the numerical calculations are validated against measurements.
In a further study 14 simulated the flow in a stepped labyrinth seal using CFD with and without honeycombs applied to the casing wall. They varied pressure ratio, pre swirl in front of the labyrinth and the honeycomb design. The result shows that the pre-swirl has a weak influence on the leakage flow, while the windage heating is influenced strongly by it. Another result is that the honeycomb design influences leakage.
09 analyze the influence of grooves in the casing of a see-through-labyrinth due to rotor stator contact. The aim of this study is to explore the windage heating effect numerically and experimentally. The authors analysed honeycombs applied to the casing. The results are compared to results from the McGreen and Ko model. One result is that it is possible to increase the leakage by up to three times in case of no honeycombs with wear grooves and a small radial clearance. In the case of small radial clearances, the contact grooves result in lower windage heating in labyrinths with honeycomb applied.
03 calculate the windage heating in a stepped labyrinth with three fins and diabatic wall conditions with CFD. In addition, thermal models of the rotor and the stator are included in the simulations. They also focussed on a labyrinth with honeycomb structures applied to the casing. One major outcome is that pre-swirl strongly influences windage heating, which is more pronounced in case of smooth walls. It is also observed that the pressure ratio influences windage heating.
The literature review shows that many authors analyze very short and stepped labyrinths numerically as well as experimentally. Further, many authors state that the pressure ratio, pre swirl, circumferential Reynolds number and the state of the fluid are the important parameters, which most influence windage heating. To the authors knowledge no models are available which capture the influence of all these parameters for different types of labyrinth seal geometries.
Windage heating correlations
The present paper describes an analytical method for predicting the windage heating effect in long labyrinth seals, by using friction and contraction coefficients calculated with CFD:
It is assumed that the circumferential flow velocity in a single chamber cu does not change in axial direction z:
In each chamber of the labyrinth the average circumferential flow velocity is approx. 50% of the rotor surface velocity:
This relationship is exact for laminar Couette flow and sufficiently exact for describing fully turbulent Couette flow 12.
Since the axial velocity component influences the windage heating effect 08, 02, 13, a maximum axial flow velocity cax between rotor and fin is calculated from:
with the pressure in front and behind the labyrinth p1 and p2, the density in front of it ρ1, the number of fins n and the average density of the fluid ρ 06.
The absolute wall shear τ at the rotor surface in rotating frame of reference quantifies all acting shear forces, whereas the circumferential component of the wall shear τu is the crucial component for windage heating. Figure 1 gives the geometrical relationships.
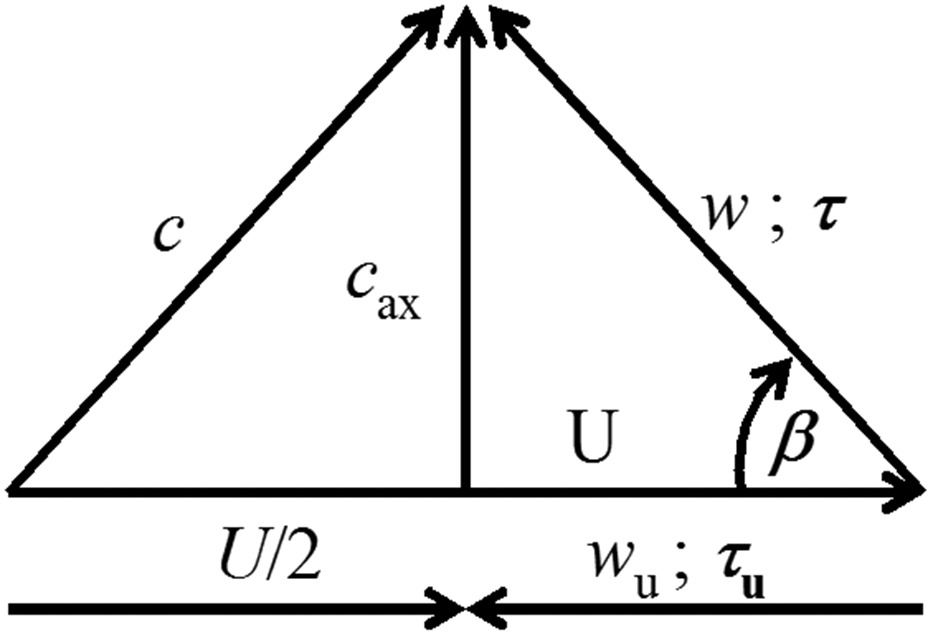
τ is aligned with the relative flow velocity w, which can be calculated according to:
with the absolute flow velocity c, which is equal to w in case of fully developed circumferential flow.
It is assumed that the friction behaviour of the boundary layer can be expressed by:
The circumferential component of the wall shear τu is calculated by geometric relationship with the equation:
It is observed that the windage heating behaviour depends on the Reynolds number in the labyrinth 10, 12, 05, 04, 08, 02. So a Reynolds number relationship between the friction coefficient cf and the Reynolds number is used in the form:
to capture this effect; with a constant A, the hydraulic diameter Dh, the dynamic viscosity η and an exponent B. The equation is based on the assumption that the friction behaviour is equivalent to the friction behaviour on a flat plat with a boundary layer development in each labyrinth chamber. B is chosen as B = −0.2 as proposed by 11. can be rearranged to:
The combination of and leads to an expression for the circumferential wall shear, depending on flow velocity, fluid properties and labyrinth geometry:
If the friction behaviour as well as the hydraulic diameter is a function of the labyrinth geometry, then can be rewritten to:
with a windage coefficient C(Geom), to be calculated e.g. numerically or via measurements for each labyrinth configuration.
Furthermore, the torque M of each single chamber is calculated with help of . The torque of the whole labyrinth can be computed by summation of the torques at each chamber.
It is necessary to compute the mass flow
with the contraction coefficient α(Geom) and the free gap width under the fins Agap 06.
The windage coefficient C(Geom) and the contraction coefficient α(Geom) of each labyrinth chamber, which depends on geometric parameters, is calculated by CFD. The detailed presentation of the numerical model follows below.
Numerical models
CFD simulations are carried out to gain necessary information about C(Geom) and α(Geom) to compute and . Further information can be found in 01 and in the following:
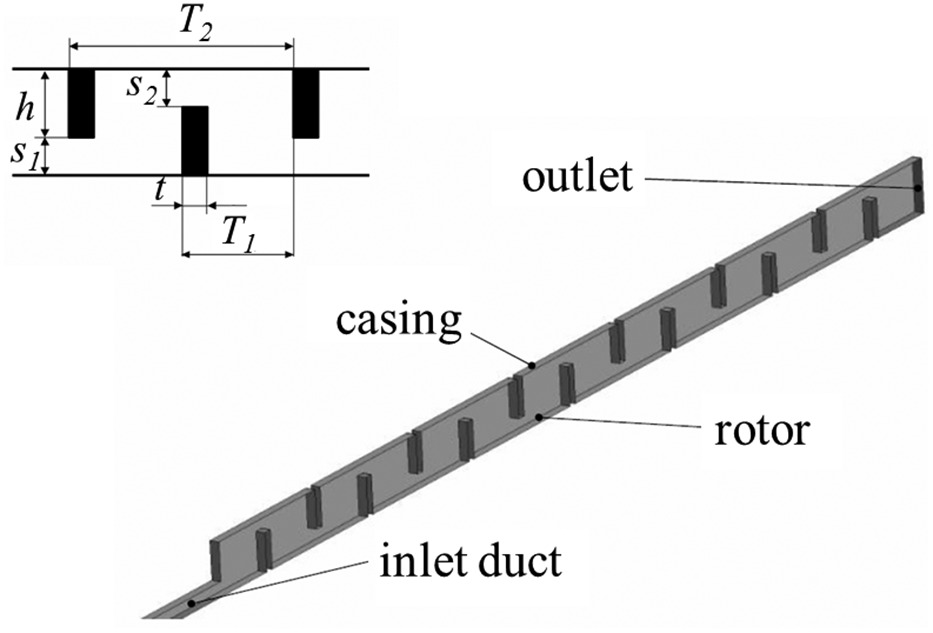
The CFD model of the labyrinth as depicted in Figure 2 contains 14 labyrinth fins; seven of them are applied at the rotor, the remaining at the casing. All surfaces of the rotor, including the rotor fins are treated as rotating walls. An inlet duct in front of the first fin with the rotating rotor wall is modelled to guarantee that the circumferential flow velocity is fully developed in front of the first fin and constant along the labyrinth, so that no further flow acceleration in circumferential direction occurs in the chambers. The CFD model represents a small sector of the whole labyrinth using a circumferential-cyclic interface.
Total pressure pt1 and total temperature Tt1 are set at the inlet of the model; the pressure p2 is prescribed at the outlet.
The steam is modelled as real gas, since varying steam parameters or thermodynamic effects such as the Joule-Thomson effect, are desired to be taken into account.
The Menter baseline (BSL) eddy-viscosity-turbulence model 07 is used to simulate the influence of turbulence on the velocity, pressure and temperature fields.
A second order accurate iteration scheme is used to calculate the flow field.
The numerical grid used is a quad dominant mesh, extruded in circumferential direction. The boundary layer is resolved by 20 nodes leading to y+ lower than 30 at the rotor.
The geometry of the numerical model is built up parametrically (Figure 2). So various labyrinth geometries can be investigated with the aim to parameterize the windage coefficient C(Geom) and the contraction coefficient α(Geom). The chamber can be described geometrically by the radial clearances s1 and s2, the axial distances between the fins T1 and T2 as well as the fin thickness t. t is set to a constant value for this investigation. The casing fin height is h. Modelling one chamber and patterning the model seven times in the axial direction leads to the 3D-model as shown in Figure 2.
An automatic sequence for model and mesh generation as well as flow computation is observed: at first 100 different geometry designs are chosen by a Latin Hypercube sampling method. The mesh generator meshes each model afterwards. The CFD solution process using Ansys CFX is carried out after mesh generation. The final result is reached in less than 1,000 iteration steps for each labyrinth with use of a proper start solution. The main convergence criterion beside maximum residuals being lower than 5·10–4 is a negligible variation of local pressure, temperature and velocity at single monitor points in the domain from step to step of the solver run.
The characteristic output parameters of the flow field are calculated automatically, which are then stored together with the geometry parameter describing the calculated labyrinth. These characteristic output parameters are the contraction coefficient and the windage coefficient.
A hybrid meta model is used to parametrize the contraction and the windage coefficients depending on s1, s2, T2 and h. So the influence of different labyrinth geometries on flow behaviour is approximated by analytical relationships. This method replaces further CFD simulations and gives the opportunity for optimization 01. The meta model is able to compute the importance of single influence parameter on the objective criterion. Since T1 is less important in the observed range of variation for the desired criteria 01, the equation calculated by the meta model does not include this parameters, but the most important ones.
Calibration of the algebraic model
The windage power P of the labyrinth is analyzed for one geometry configuration. In the upper diagram of the Figure 3, P is shown relative to Pbase of the reference configuration; depending on different pressure ratios at different rotor speeds. For each rotor speed, the circumferential Reynolds number is kept constant, since the average pressure is constant for all conditions.
Figure 3.
Windage power relative to power of base configuration for different pressure ratios and rotor speeds. The dots represent CFD results, the lines come from the analytical model.
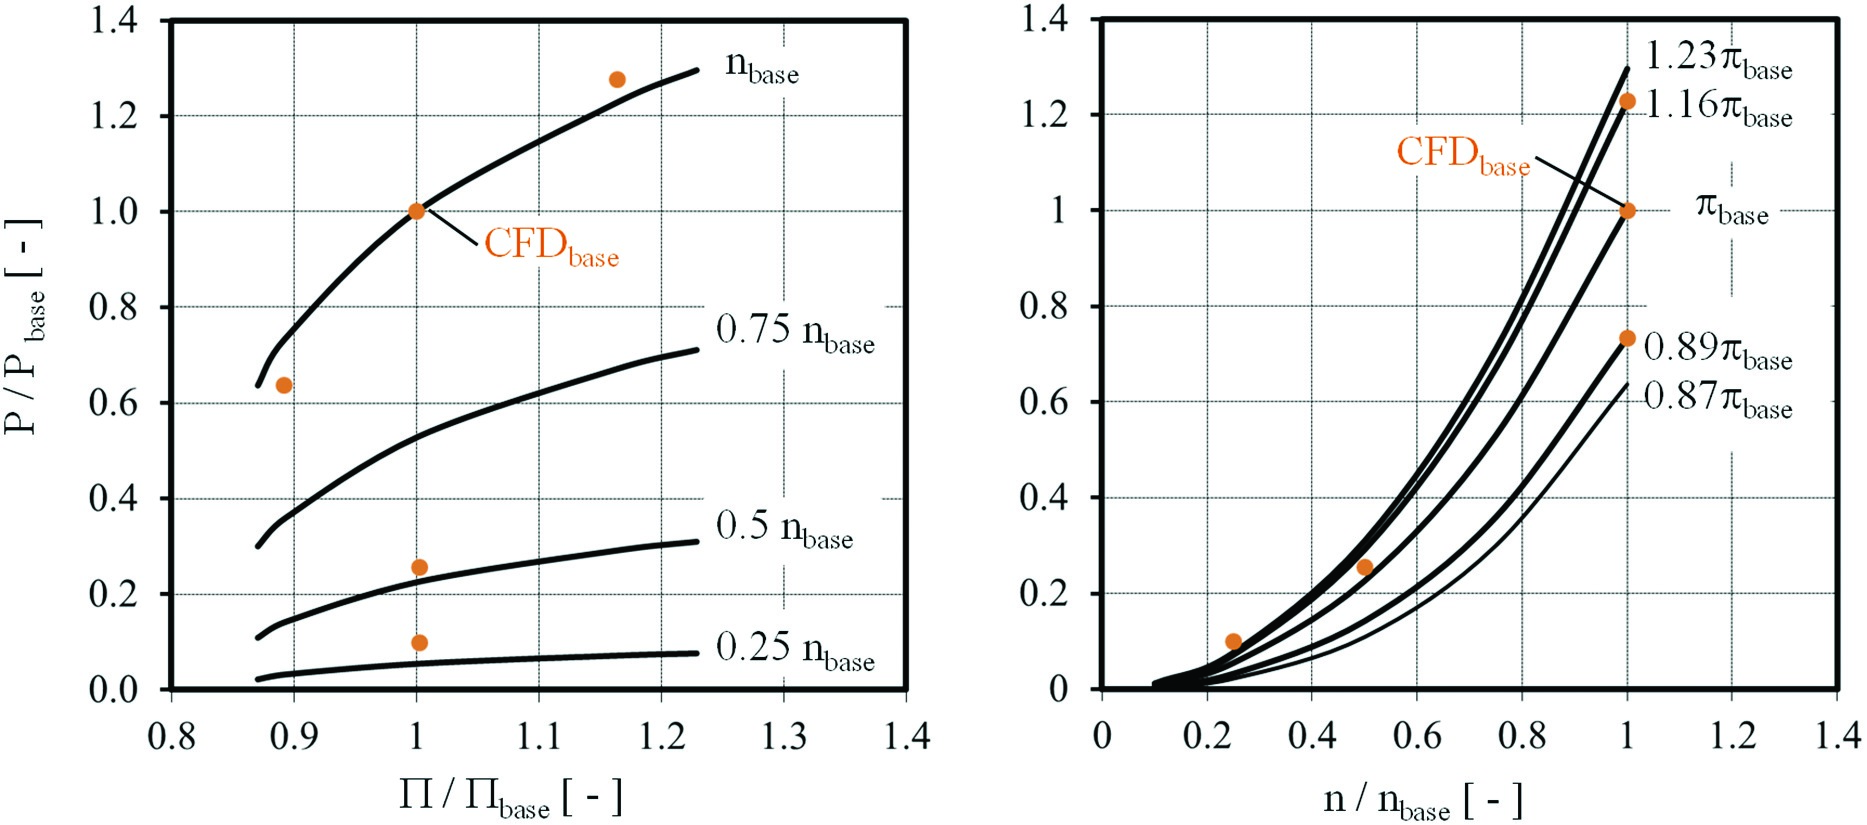
The pressure ratio π influences the windage heating: the presented correlation shows that the windage power is increased at higher pressure ratios. This is in agreement with 13. The reason for this behaviour is that the square of the flow velocity influences the wall shear. This effect is compensated to a certain degree since the flow angle β is increasing with elevated pressure ratio, leading to a reduction of τu. Additionally, the friction coefficient cf reduces with increasing absolute Reynolds number, since the exponent B is negative.
The windage heating strongly increases with higher rotor speed as expected (bottom diagram in Figure 3). At a given pressure ratio, the flow angle β decreases with increasing rotor speed; leading to a flow vector pointing increasingly towards the circumferential direction. Additionally, the absolute flow velocity increases, leading to higher circumferential shear force.
The symbols shown in Figure 3 show the CFD results of one labyrinth configuration at different thermodynamic boundary conditions. One of the simulations represents the base design and delivers the windage coefficient C(Geom), which is then kept constant in the algebraic model.
The discrepancy between the results for the algebraic model and the CFD results is less than 15%. The largest difference is at low Reynolds numbers (low rotor speed and/or small pressure ratio). The reason for this is the strong gradient of the function cf(Re) at low Reynolds numbers. Since the function cf(Re) becomes nearly constant at very high Reynolds numbers, the accuracy increases if high Reynolds number flow exists.
Extension to arbitrary geometries
The hybrid meta model delivers the model coefficients C(Geom) and α(Geom) as explained above. To assess the accuracy of the meta model used, Figure 4 shows the named coefficients for three labyrinth configurations; calculated with the meta model and with CFD.
Figure 4.
Windage and contraction coefficient for different labyrinth geometries at constant Reynolds number.

Labyrinth configuration 1 is the one used for calibration of the thermodynamic correlations. Labyrinth 2 has 35% smaller radial clearance at the casing s2 compared to labyrinth 1; and the casing sided fin height h of labyrinth 3 is 25% smaller compared to h in labyrinth 1. All parameters not mentioned are kept constant.
The meta model predicts the contraction coefficient α(Geom) with a deviation smaller than 6% compared to CFD. The windage coefficient C(Geom) is predicted with a deviation smaller than 3%. The comparison therefore shows sufficiently high prognosis quality.
Validation against measurements
The verification using a short labyrinth for calibration shows good agreement between CFD results and the model at various thermodynamic conditions. Since the most significant windage heating effect in seals of real steam turbines occurs in long labyrinth seals where gas dynamic effects play a major role, a comparison between the analytical model, CFD and experimental data is shown for this type of labyrinth seal in the following:
The measured labyrinth exit temperature at a HP steam turbine thrust compensation piston is available at various load points for different power plants. The inlet temperature measurement in front of the labyrinth is located a certain distance upstream of the labyrinth. Since parasitic heat fluxes exist, which influence the inlet temperature, a fully coupled aero-thermal CFD simulation (Fluid-Solid-Interaction CFD) is done to determine the deviation between measured upstream temperature and steam temperature directly in front of the labyrinth (Figure 5). The difference between actual labyrinth exit temperature Texit and labyrinth exit temperature in case of no rotor rotation Texit,0 (isenthalpic throttled inlet temperature) is used to quantify the windage heating effect since it is proportional to the total enthalpy increase ∆ht in :
Figure 5.
Measured turbine and the CFD procedure to capture parasitic heat fluxes, which influence measurement of labyrinth temperatures.
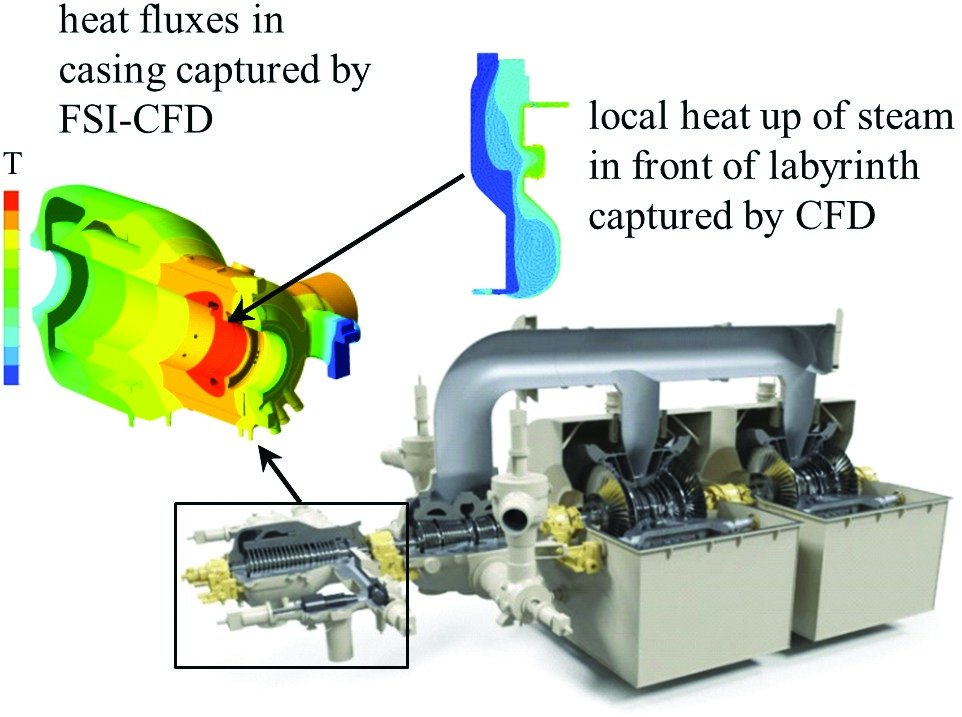
The analysis shows that the measured values of ∆T are influenced by approximately 30% by the heat fluxes through the casing walls and side effects such as windage heating on the piston front face in this case. This reinforces that the parasitic heat fluxes must be taken into account in the analysis of measurements of this kind. So the measured ∆T in the three different turbines investigated are corrected by the calculated temperature influence, in order to make a direct comparison between the calculated and the measured windage heating effect. For typical steam turbine applications, ∆T is in a range of approximately 5 to 30 K depending on labyrinth geometry and steam conditions.
The comparison between computed and measured temperature increase ∆T is given for different load cases (i.e., Reynolds numbers) in the seals of three turbines of nearly similar type (Figure 6).
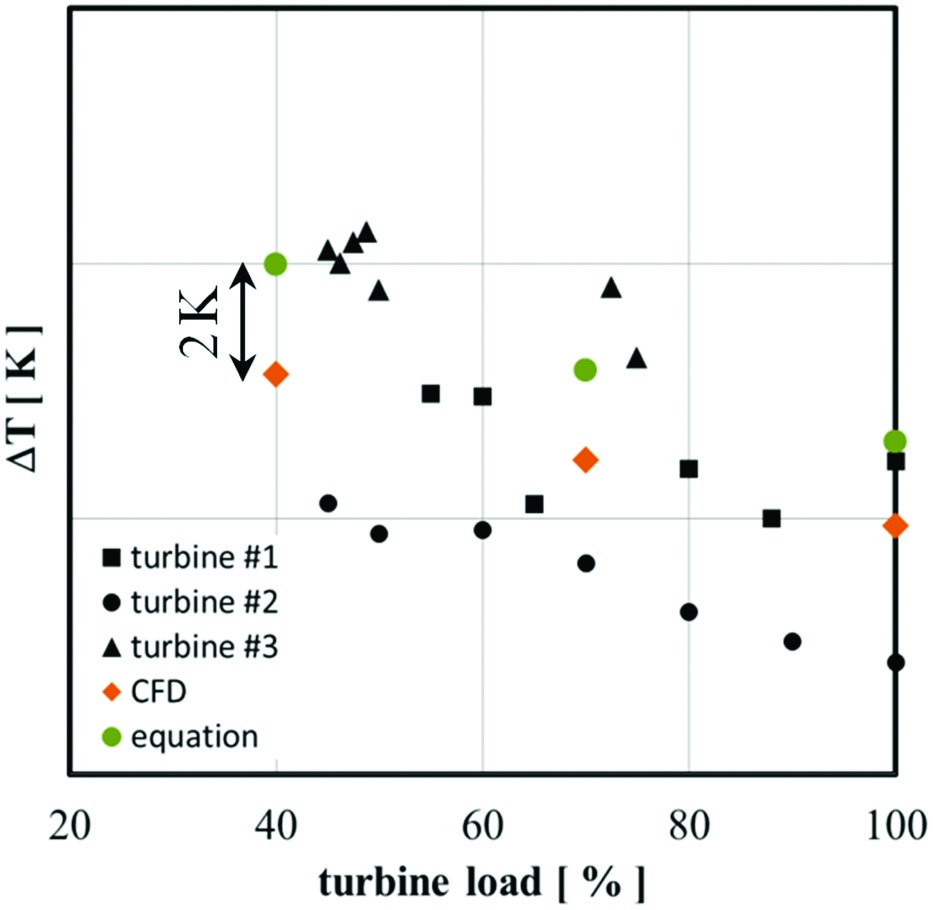
The presented model calculates the temperature increase ∆T in the whole turbine load spectrum with a deviation of less than 2K compared to CFD. The increase of ∆T from high to low turbine load as a result of cf(Re) is captured with both calculation methods.
The calculation results are in very good agreement with the measurements. The absolute temperature and the increase of ∆T from high to low load are measured as predicted. The prediction accuracy of the analytical model is high since the calculation results are in the scatter band of less than 2K compared to the measurements.
Measurements have been performed in a labyrinth seal test stand and compared to the predictions of the model. The chamber geometry differs from the geometry used in the turbines presented before. So the capability of computing various geometries with the analytical model can be proven.
Figure 7 shows the temperature drop along the labyrinth with the length l. The temperature is normalized by the total decrease of the inlet temperature Tin by isenthalpic throttling:
Figure 7.
Comparison between computed and measured temperature profiles along a labyrinth seal in a test stand.
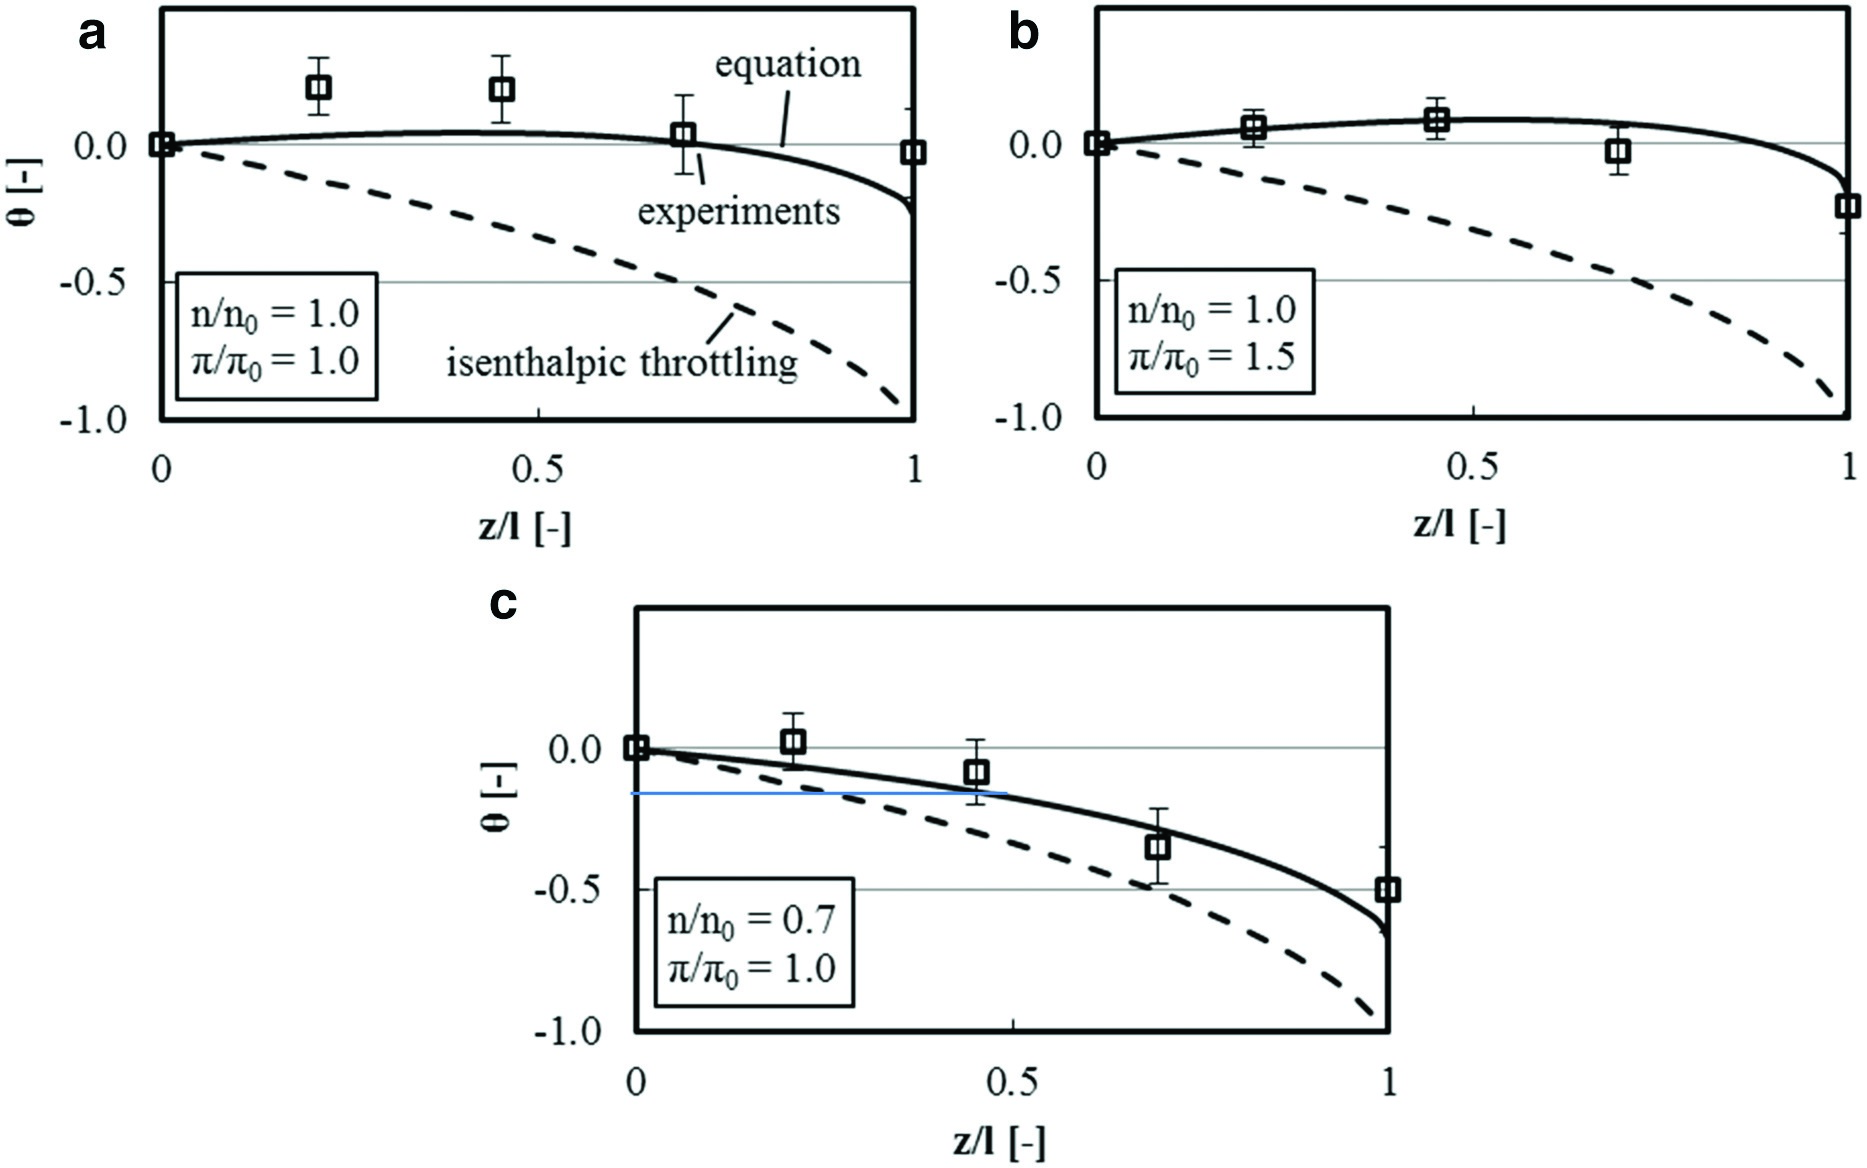
The steam temperature has been measured in front, afterwards and at three axial positions within the labyrinth. For a specific speed n0 and a pressure ratio π0 (Figure 7) the windage heating effect leads to a predicted temperature profile (solid line) with a nearly constant value compared to the theoretical dropping isenthalpic throttling temperature (dashed line). The experimental values (squares), which have been corrected due to minor insulation losses in the test stand, are in very good agreement to the predictions. Deviations originate from uncertainties in the determination of the insulation losses and reduced pre swirl in front of the labyrinth seal.
At increased pressure ratio (Figure 7), the rising mass flow leads to a stronger steam cooling capability (see ). In contrast, the elevated pressure level corresponds to a stronger windage heating effect (a larger total enthalpy increase ∆ht), which in turn leads to a similar plot compared to Figure 7.
At a rotor speed reduction to 0.7 n0 (Figure 7), the windage power is roughly half the windage power at full rotor speed (compare Figure 3) and the predicted curve gets closer to the isenthalpic throttling temperature profile. The analytical model reproduces the observed dependencies accurately in all load conditions.
Summary and conclusion
An algebraic model for predicting the windage heating effect in full labyrinth seals is developed from fundamental relations. This model accounts for the influence of varying axial and circumferential flow velocities in the labyrinth seal chambers over a wide range of Reynolds numbers. The impact of labyrinth geometry on the windage heating effect is also taken into account. This is accomplished with the help of a meta model. Since this kind of method is used to compute the geometry dependent windage coefficient, the approach can be extended to labyrinth topologies, which differ from the presented, by additional meta model training.
The comparison with experimental data from steam power plant turbines and a labyrinth seal test stand shows that the model can accurately predict the temperatures in the labyrinth seal at various load points and for different labyrinth chamber geometries.
The approach presented is a reliable method to calculate the windage heating effect in labyrinth seals. It is suitable to be used in an optimization procedure (e.g. genetic algorithm) to find the best performing labyrinth seal geometries with lowest steam temperature. The algebraic model helps turbine manufacturer to design cost effective turbines with highest efficiency and reliability in a fast and efficient manner.
Permission for use
The content of this paper is copyrighted by Siemens AG and is licensed to GPPS for publication and distribution only. Any inquiries regarding permission to use the content of this paper, in whole or in part, for any purpose must be addressed to Siemens AG directly.
NOMENCLATURE
Latin
A
area
[m2]
A
constant
[-]
B
constant
[-]
C
windage coefficient
[-]
c
velocity
[m/s]
D
diameter
[m]
h
enthalpy
[J/kg]
h
fin height
[m]
l
labyrinth length
[m]
M
torque
[Nm]
mass flow
[kg/s]
n
fin number
[-]
n
rotor speed
[Hz]
P
power
[W]
p
pressure
[Pa]
Re
Reynolds number
[-]
r
radius
[m]
s
radial clearance
[m]
T
fin distance
[m]
T
temperature
[K]
t
fin thickness
[m]
U
surface velocity
[m/s]
w
relative velocity
[m/s]
z
axial coordinate
[-]