
Introduction
The aim of this paper is to investigate the sensitivity of 3D corner separations to modelling fidelity. This is important because the 3D corner separation often controls the operating incidence range of the blade row. Two types of modelling fidelity are investigated: (i) the modelling fidelity within the blade row itself and (ii) the modelling fidelity in the multi-blade row environment.
The modelling fidelity within the blade row is investigated in two ways: First, the effect of the fidelity with which the endwall and shroud cavity geometry is modelled is investigated. Second, the effect of transition modelling is investigated. These two effects are labelled in Figure 1.
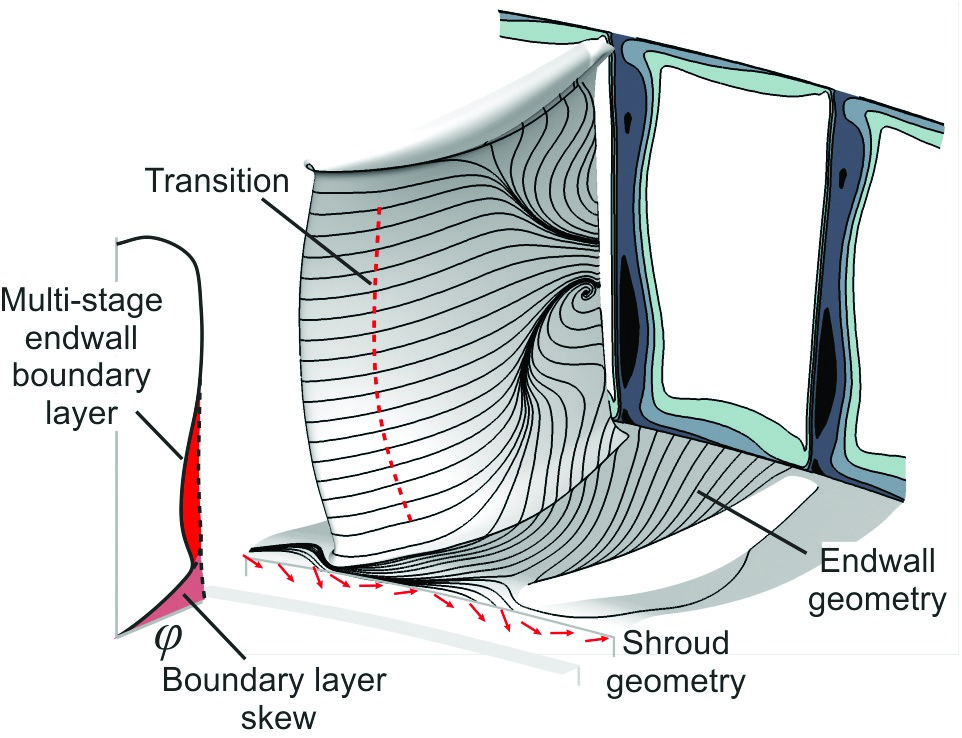
The modelling fidelity in the multi-blade row environment is also investigated in two ways: First the effect of the inlet endwall boundary layer skew close to the annulus endwall (0–5% span), due to change in frame of reference, is investigated. Second, the effect of the endwall annulus boundary layer, developed in a multi-stage compressor (5–40% span) is investigated. These two effects are labelled in Figure 1.
The compressor stage geometry used in this paper is characteristic of a modern 3D shrouded compressor in the rear stages of a high pressure compressor. The aim of the paper is not to investigate the sensitivity of 3D corner separations to blade design and so the geometry of the baseline blade will be held constant throughout the study.
The sensitivity of modelling fidelity within a blade row has already been reported in the literature 4, 5. Goodhand and Miller showed that the 3D corner separation is most sensitive to the state of the compressor suction surface boundary layer, close to the endwall. The work shows that the 3D corner separation size is very sensitive to transition on the early suction surface. Gbadebo et al. showed that the 3D corner separation is also very sensitive to roughness on the leading edge and early suction surface. The two papers were undertaken on a 2D blade design and therefore may not be representative of a modern 3D blade. It is, however, clear that corner separations are highly sensitive to transition and roughness on the early suction surface.
The sensitivity of modelling fidelity in the multi-blade row environment has also been reported in the literature 1, 11. Taylor and Miller showed that 2D compressor blades are very sensitive to small changes in the inlet profile to the stage. These small changes were not only found to cause the separation size to change but also caused its location to switch between the casing and hub wall. Auchoybur and Miller found that even in 3D compressor blades the corner separation is largely controlled by the inlet endwall annulus boundary layer, developed in a multi-stage compressor (5–40% span). The sensitivity of the 3D corner separation to the multi-stage endwall boundary layer explains why Reynolds-averaged Navier–Stokes (RANS) codes are often inaccurate at predicting multi-stage compressor matching.
The paper is split into two parts. In the first part, the sensitivity study is undertaken with a compressor that has the design intent geometry. This has been defined as a shroud clearance of 1% span and blade surfaces that are hydraulically smooth. In the second part of the paper, the sensitivity study is undertaken with a compressor that has an “end of life” geometry. This has been defined as a shroud clearance of 3% span and blade surface roughness scaled from engines after 4,000 take-off and landing cycles. The effect of blade geometry changes over life, other than roughness, have not been considered.
Methodology
Experimental
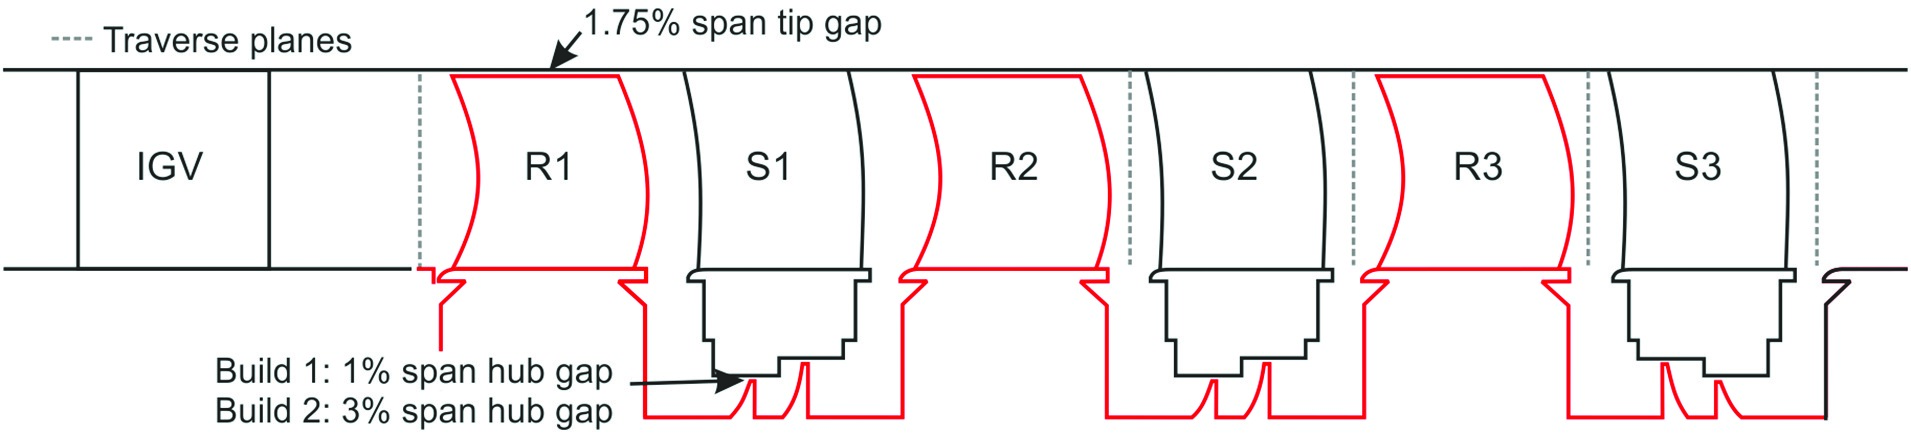
The SMURF rig 6 in the Whittle Laboratory, shown in Figure 2, has been used to conduct the sensitivity studies in this paper. The SMURF rig is a low-speed multi-stage compressor, representative of a modern high pressure compressor. Each stage has identical geometry, with shrouded stator hub endwalls. For use in this paper, experimental data has been collected from a 1% span shroud clearance build of the rig and a 3% span clearance build. The rotor tip gap for each stage is 1.75% span. The average stage Reynolds number is ~5 × 10⁵ based on chord, with blade aspect ratios of ~1 and stage reaction based on mid-span of 65%. The stage has been designed at a moderate flow and work coefficient, and contains 3D blading.
A five-hole probe, with a 2.5 mm head diameter was used to traverse downstream of stator 2. This is approximately 20% of the stator mid-span trailing edge thickness. A single straight hot-wire was used to traverse the rotor 3 exit wake.
Computational
The Computational fluid dynamics (CFD) modelling conducted in this paper uses Rolls-Royce’s in-house solver Hydra 8, operated in steady RANS mode with mixing planes. The computational results are all from simulations using Menter’s k-ω SST turbulence model 7 as it gave more accurate results that the Spalart-Allmaras model. Nonetheless, similar trends in the results were observed for both models. PADRAM 10 was used to generate the mesh, which was configured to provide a multi-block structured O-H grid topology throughout the domain with a y+ ~1 on all viscous surfaces. Shroud cavity wells are modelled using a stub cavity model and a knife-to-knife (k2k) cavity model which is based on an experimental study in the literature 12. The k2k model, which has been calibrated against rig test data, was found give more accurate results than fully meshing the cavities.
The computational studies in this paper are all performed on the embedded stator 2 of the SMURF rig. The operating point investigated in all of the sections corresponds to an off-design operating point, φ = 0.47 and ψ = 0.51. At this condition, the mid-span static pressure rise coefficient is 0.60 and diffusion factor is 0.55.
Transition and roughness modelling
In the CFD, the effect of transition on the suction surface is modelled by imposing the transition location on the stator suction surface. For the off-design operating point being considered, the transition from laminar to turbulent was estimated to finish by 15% chord length, based on a MISES 3 mid-span calculation. This transition location is specified between 5 to 95% span.
In the experiment, the effect of roughness typical of an end of life blade was modelled using the sand grain technique reported in the literature 5. The sand grain size was scaled to match the roughness Reynolds number of a real engine stator blade exposed to approximately 4,000 cycles, which was shown in the literature 2 to increase to around 34, with a roughness height of 2 μm. To match this roughness Reynolds number on the SMURF stator, the sand grain size was required to give a roughness height of 16 μm.
Validation of embedded “stage” model
The validity of the sensitivity study depends on the how well the CFD can capture the flow physics in the experimental test case. A specific embedded stage model was used in the study. The model is shown in Figure 3. The key elements are:
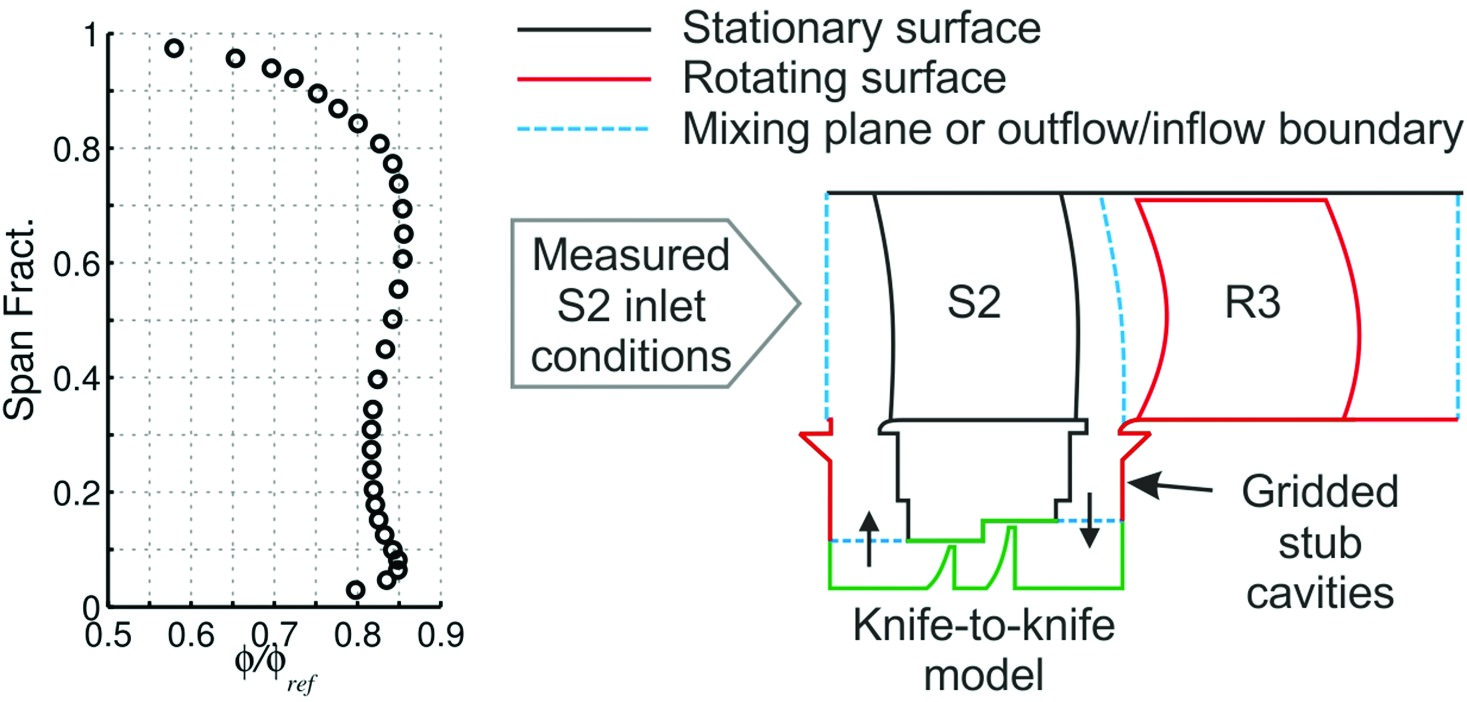
1. Experimental traverse at stator inlet — This was critical to the study. For off-design conditions, if even one row was modelled up stream of the blade row studied, the accumulative error was too large for the study to be undertaken.
2. Downstream rotor — To ensure that the 3D separation behaved correctly, a rotor downstream of the stage was required. This allowed the back pressure on the separation to behave physically.
3. Full modelling of shroud — To allow a sensitivity study to model the real endwall, the shroud cavity requires modelling. Meshing the stubs of the cavity and connecting them via a k2k model ensured that the experimental cavity mass flow was captured.
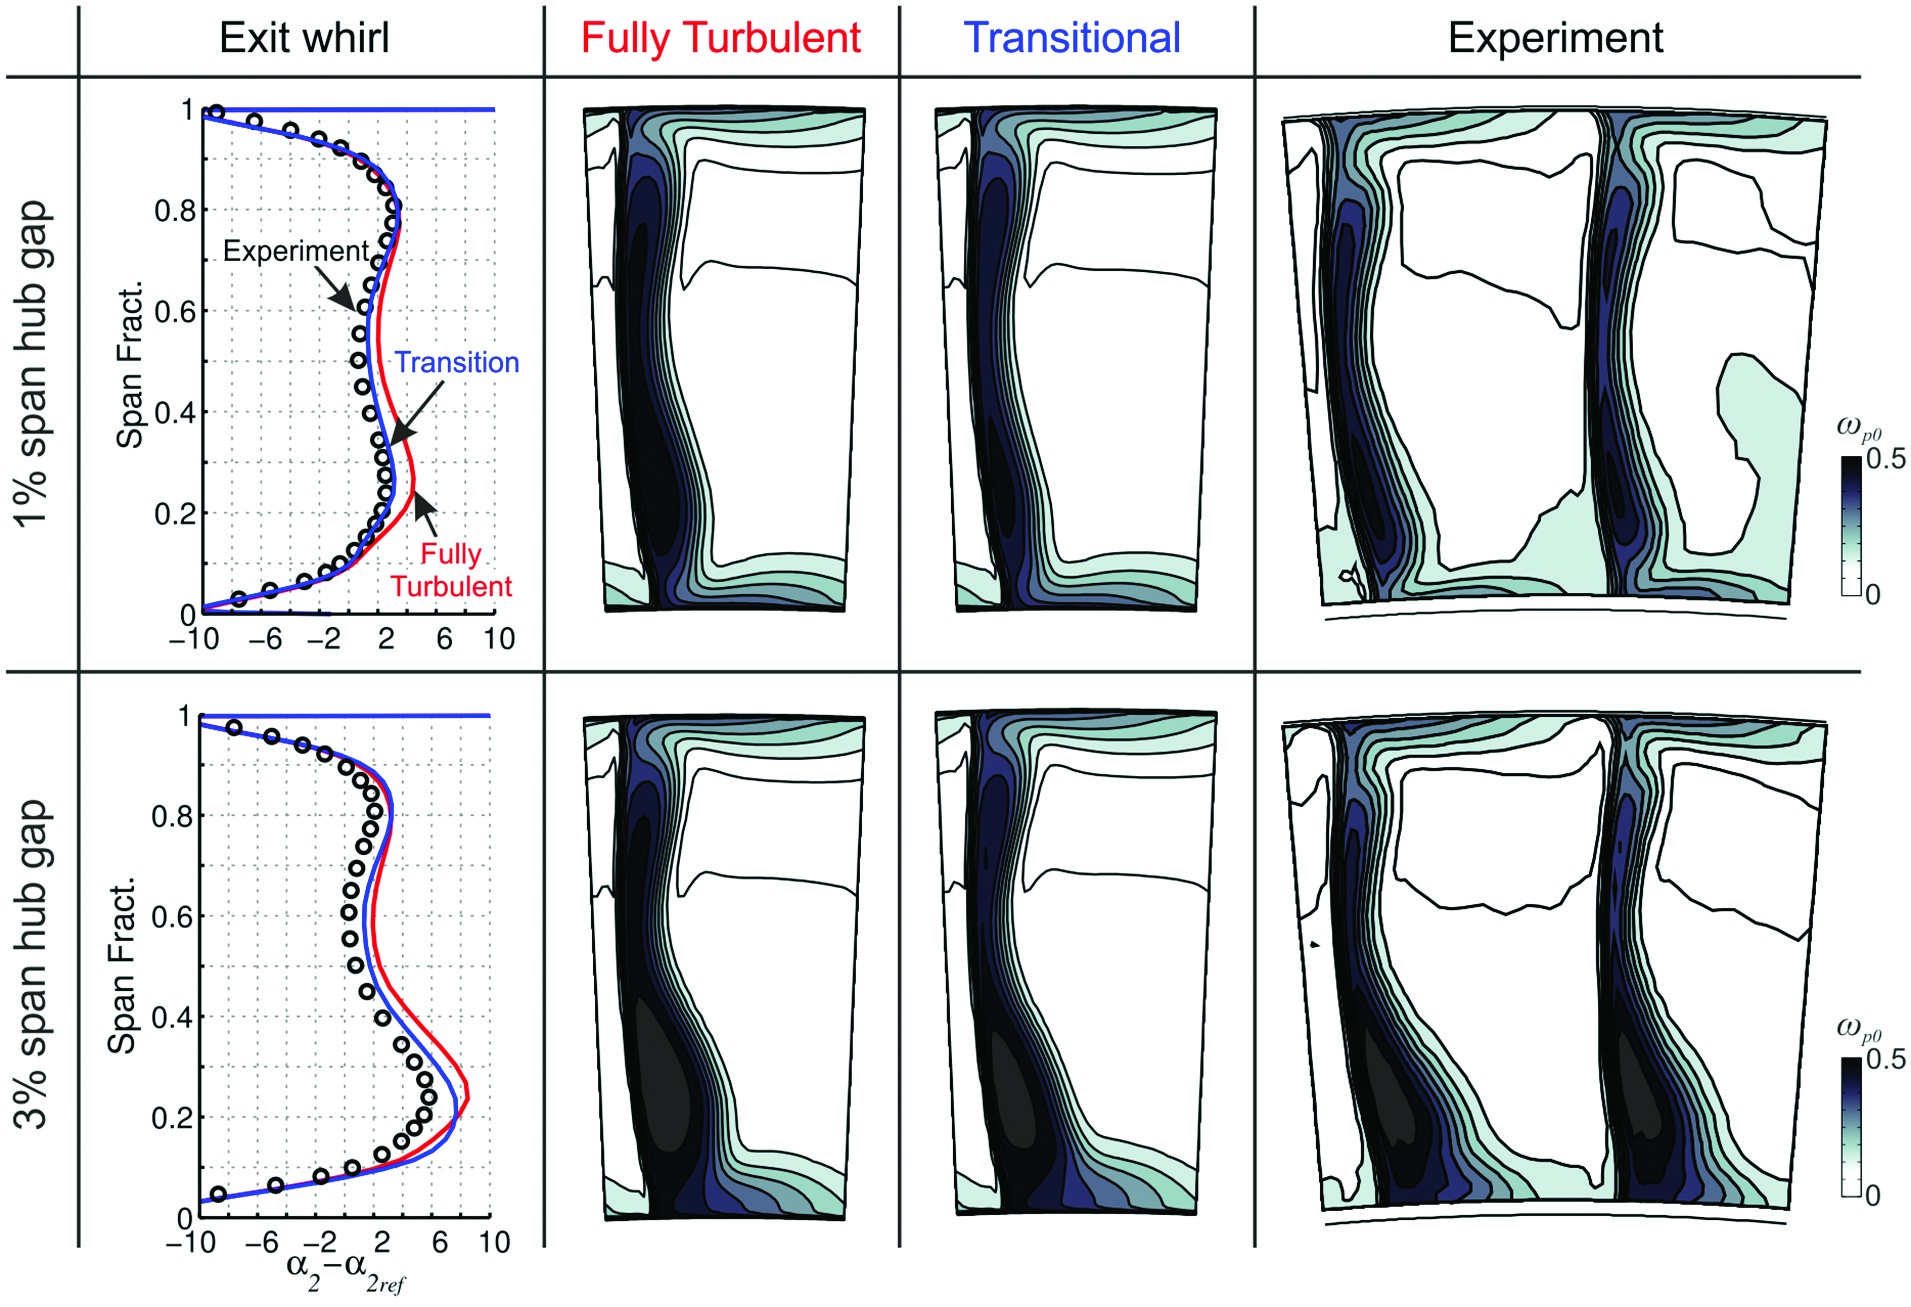
The result of the model at the two clearance gaps studied is shown in Figure 4. The results show that at both clearances, if all of the conditions above are met that the embedded stage model is extremely accurate at predicting a blade row. Despite the simplification of using a steady RANS model with circumferentially uniform inlet conditions, the magnitude and size of the stator loss cores are remarkably well captured by the CFD. This comparison demonstrates that unsteady CFD is not required for this embedded stage study.
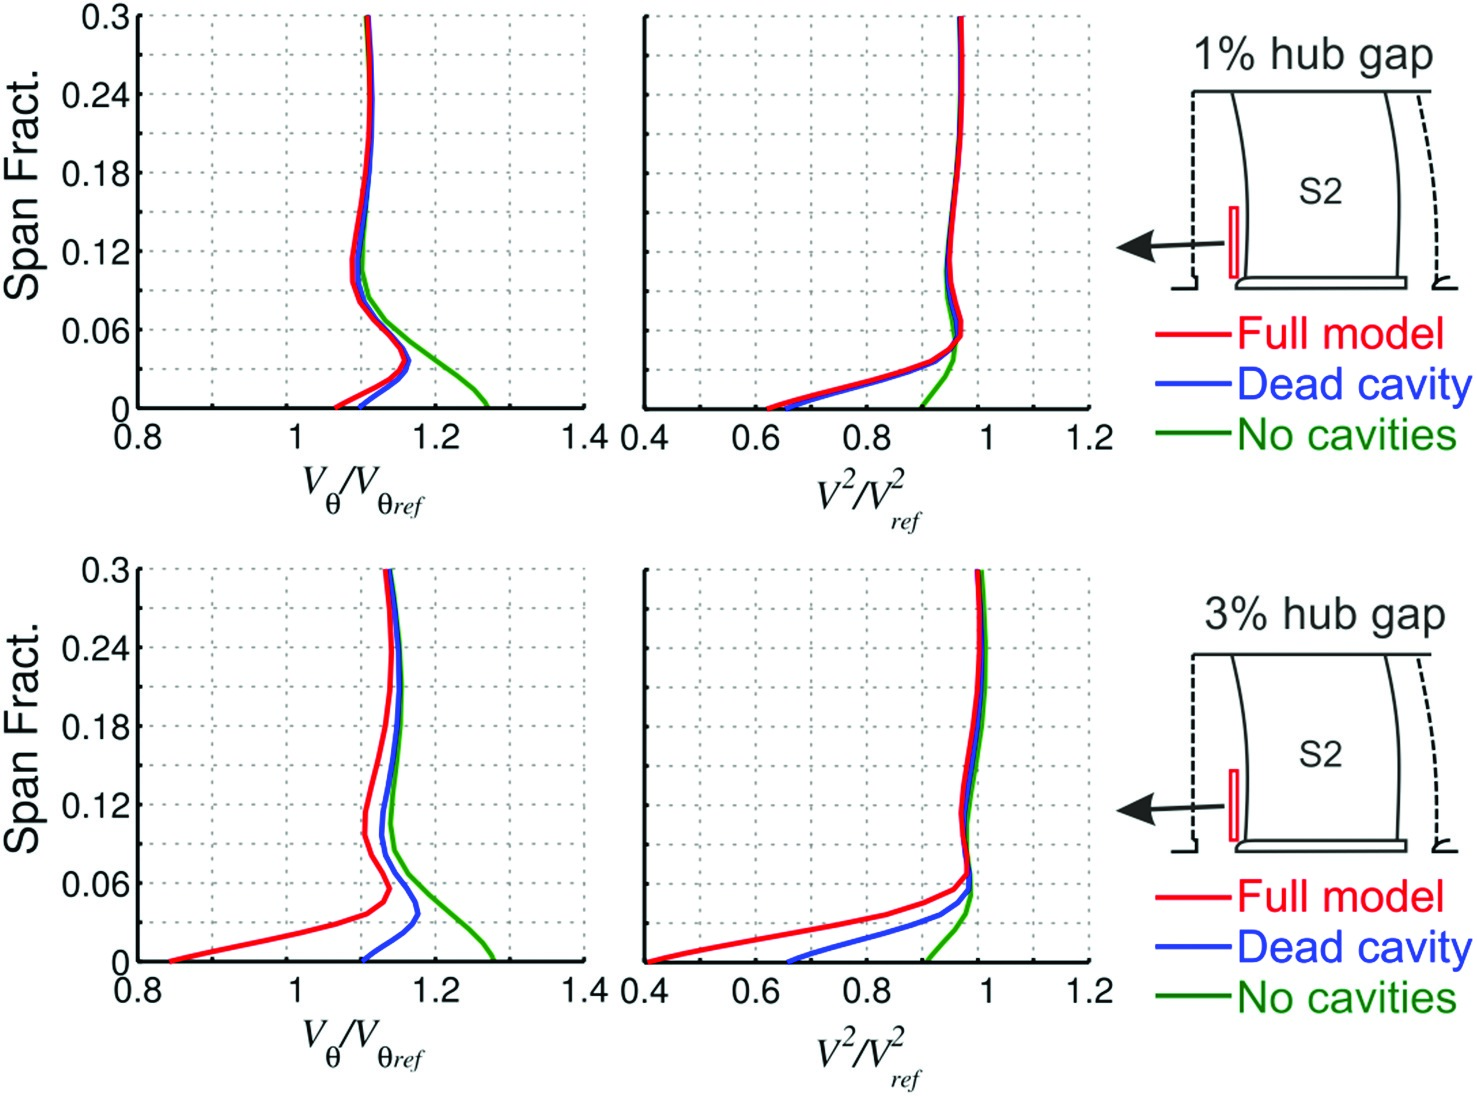
Figure 4.
Embedded stage model, stator 2 exit data compared with experiment, Top: 1% span hub clearance, Bottom: 3% span.
An understanding of why steady CFD is able to capture the main physical mechanisms of 3D separations can be learned from a study in the literature 9. Naylor performed hot-wire traverses downstream of a stator blade row and showed that the incoming rotor wakes only had a small effect on the size of the 3D separation. Similar insight is also gleaned from Goodhand and Miller who showed that by triggering a large 3D separation with a movable leading edge trip, the timescale of the growth of the separation is an order of magnitude larger than the blade passing frequency.
It should be noted that even two blade rows into a multistage CFD solution, the small errors shown in Figure 4 start to accumulate and large errors can occur. This effect was also seen in the literature 11.
Part I: Design intent geometry
A sensitivity analysis is undertaken with the compressor in its “design intent” geometry. The design intent geometry is defined as a shroud clearance of 1% span and blade surfaces that are hydraulically smooth. The sensitivity analysis was undertaken using the embedded stage model. The model was run at the off-design operating point, as defined in the methodology section.
The first two sections will describe the sensitivity of the 3D corner separation to modelling fidelity in the blade passage alone. The third sections will describe the sensitivity of the 3D corner separation to modelling fidelity in the multi-stage environment.
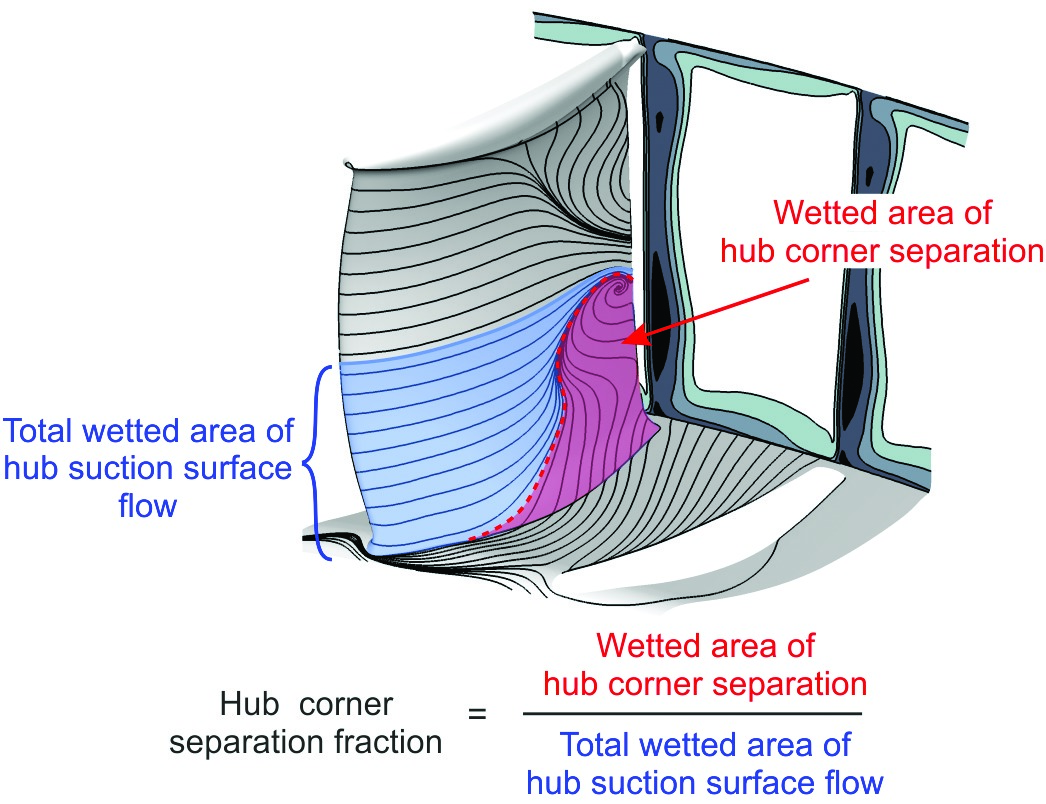
To quantify the sensitivity of 3D corner separations to modelling fidelity a metric is required that relates to the size of the 3D separation. Loss is not a good metric as clearly turning on and off a particular physical mechanism will eliminate a particular loss mechanism but will not necessarily alter the size of 3D corner separations. The metric chosen focuses on the hub called the “hub corner separation fraction,” which is defined in Figure 5. For the design intent geometry, this is measured to be 40% of the total hub wetted area.
Sensitivity to endwall and shroud modelling
Four endwall and shroud modelling methods were undertaken from the highest to the lowest fidelity. The cases include:
1. Full cavity model: The model includes the stub cavity and has a knife-to-knife model linking the bottom of the two cavities. The leakage mass flow was predicted to be 0.53% of main passage annulus flow.
2. “Dead” cavity model: This model retains the stub cavity but removes the knife-to-knife model. Furthermore, the cavity walls are set to be stationary so the stub behaves like a simple plenum.
3. No cavity: This model has the stub cavities removed, and replaced with inviscid patches.
4. Inviscid endwalls: This model makes the entire hub and casing endwalls inviscid, as well as the cavities removed and replaced with inviscid patches.
Note, due to subtle changes in blockage caused by the different modelling fidelity, the inlet mass flow was adjusted for each of the four models to ensure a consistent stator pressure rise.
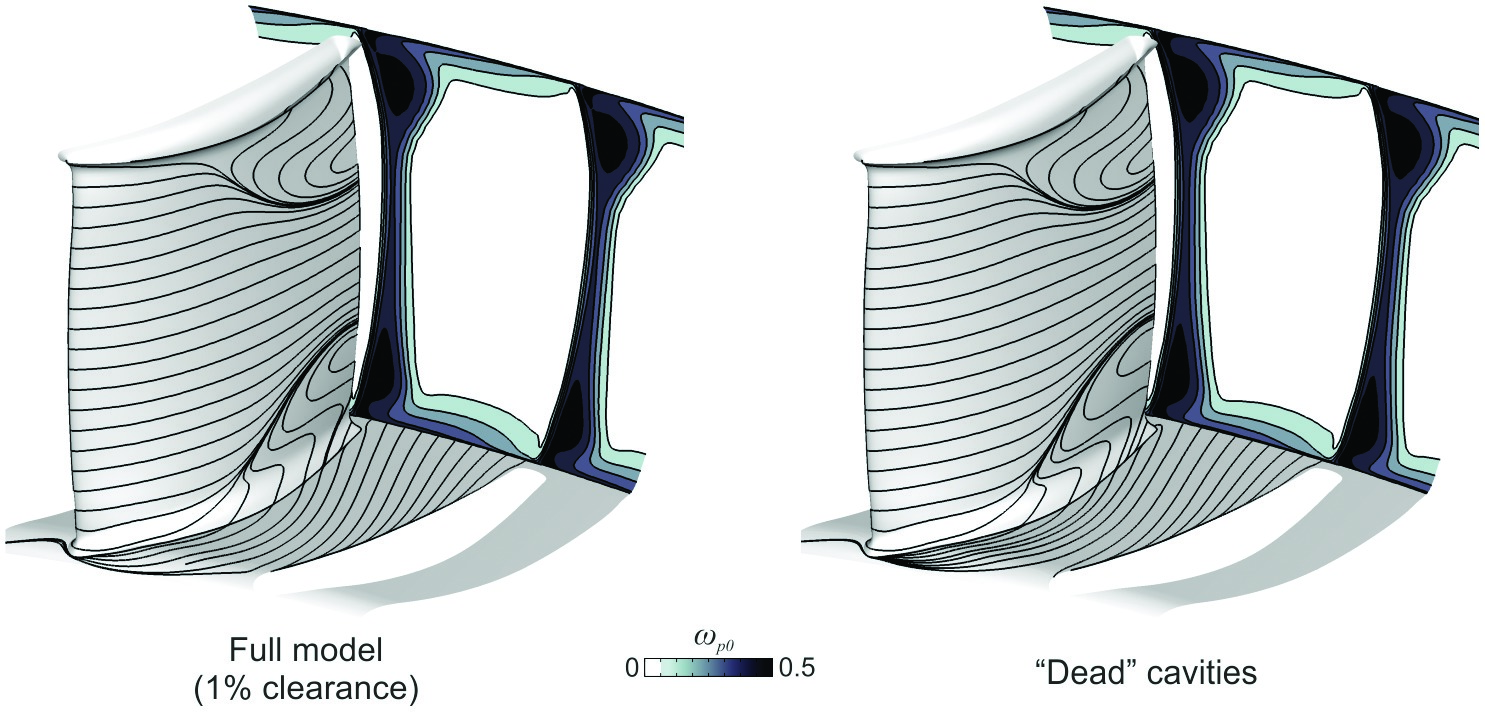
Figure 6 shows the suction and endwall surface streamlines, and the downstream loss contours for the four cases. The first and surprising finding is that the suction surface streamlines are nearly identical for each of the four cases. This indicates that the “hub corner separation fraction” is nearly identical for each of the four cases, only changing by a couple of percentage points. The second finding is that the loss contours downstream of the trailing edge are nearly identical for the first three cases but slightly lower in magnitude in the fourth case. The lower value in the fourth case is simply due to the loss generated on the stator endwall being removed.
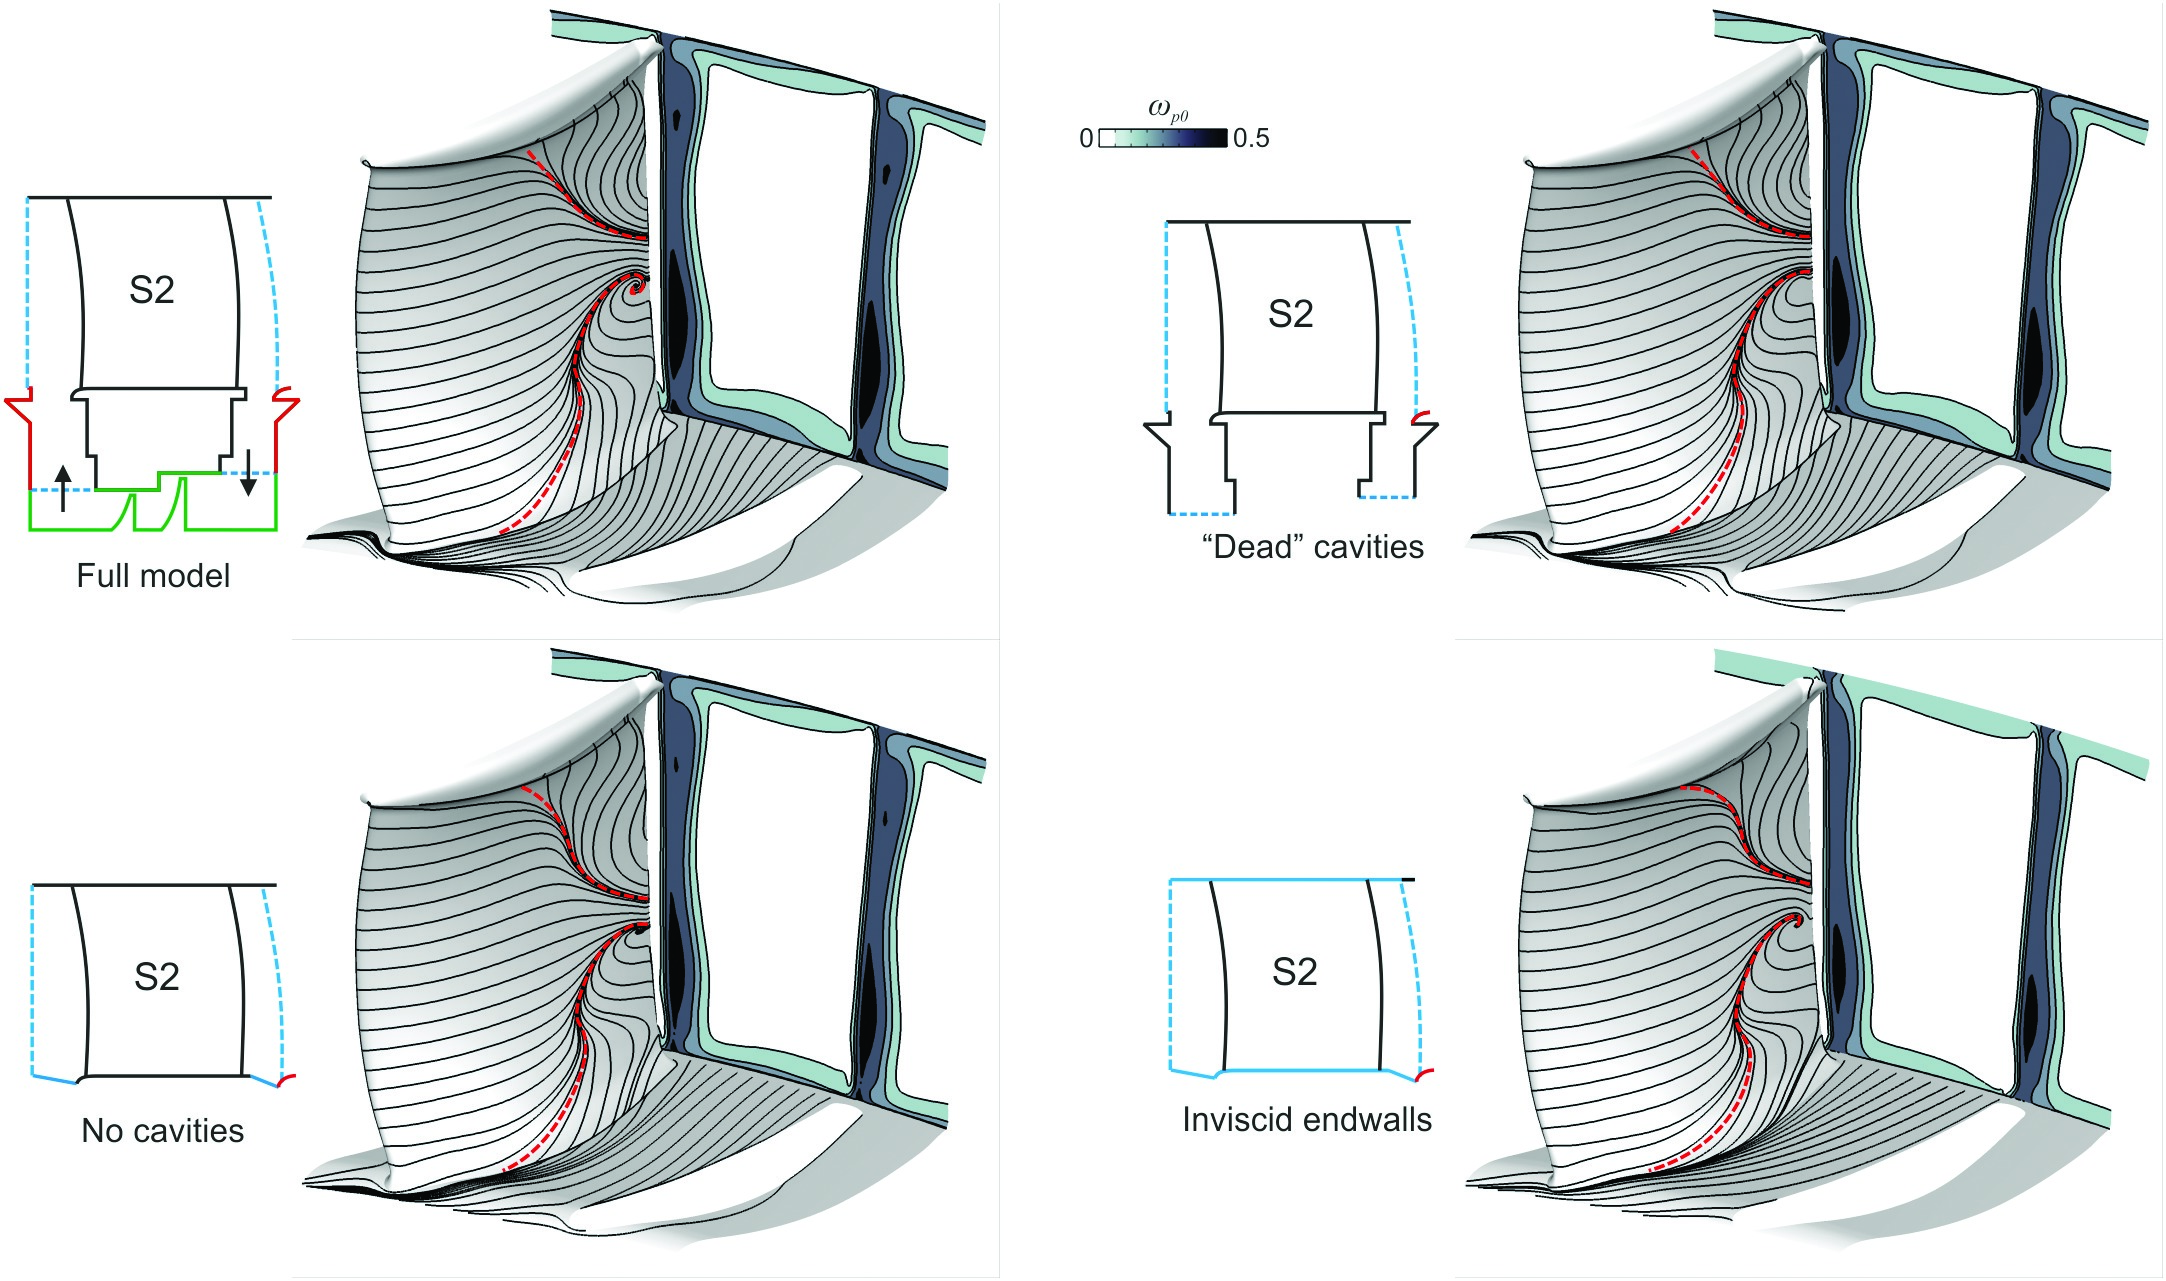
The results show that for a modern 3D compressor stator the topology of the 3D corner separation is not very sensitive to the local blade modelling fidelity of the endwall and shroud.
Sensitivity to transition modelling
Two cases were undertaken: a fully turbulent case and an imposed transition case, where point transition is imposed along a spanwise line on the blade surface, based on MISES 2D calculations of individual sections. The endwalls in both cases were fully turbulent. Figure 7 shows the two cases and the experimental flow visualisation.

The first thing to note is that when transition is modelled the suction surface boundary is not separated at the trailing edge over a small portion of the span (from 60 to 70% span). The fully turbulent case however shows separation across the whole span, with the “hub corner separation fraction” increasing by 8 percentage points. The experimental flow visualisation agrees closely with the case where transition is modelled, as shown by the suction surface boundary layer similarly not separated at the trailing edge over a small portion of the span (60–70% span). The downstream loss contours show that the change in separation size has changed the size of the downstream loss contours.
The sensitivity to transition modelling, though significant, is much smaller than the effect reported on 2D compressor blades in the literature 5. This implies that though transition modelling is important, its importance on 3D blades is much weaker than in 2D blades.
Sensitivity to modelling in the multi-stage environment
The way in which the multi-stage environment communicates with the 3D corner separation in a particular blade row is through the blade inlet profile. The inlet profile develops over multiple stages and is notoriously difficult to predict using RANS CFD. The result is that many gas turbine manufacturers predict stage matching using low order methods tuned to experimental levels of blockage, deviation and loss.
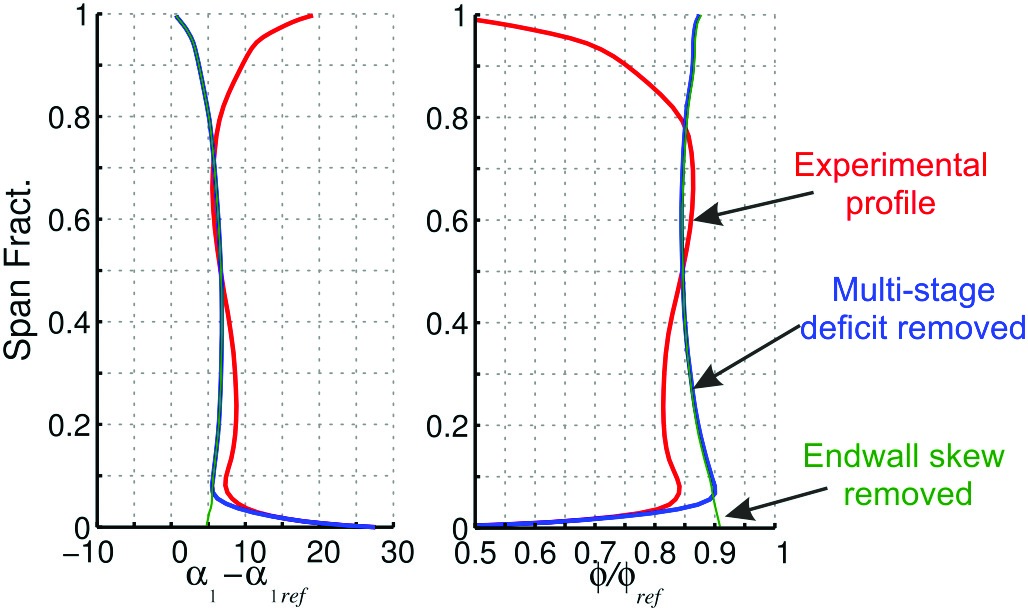
The aim of this section is to investigate the sensitivity of the 3D corner separation to errors in different regions of a blade’s inlet profile. The measured “repeating stage” inlet profile to the stator is shown in red in Figure 8. The profile is made up of three regions. From 40–60% span, the freestream region, the profile is close to that of the design intent. From 5–40% and 60–100% span, the profile is dominated by the “repeating stage” endwall boundary layers. These are the regions that develop over multiple blade rows and are difficult to predict accurately with RANS CFD. From 0–5% span, very close to the hub endwall, the profile is dominated by the highly skewed boundary layer caused by the change in frame of reference of the upstream rotor hub platform boundary layer. The blue inlet profile in Figure 8 has the radial profile from 5–40% and 60–100% replaced with a scaled “design intent” profile. The green profile in Figure 8 is the same as the blue profile but also has the 0–5% span region replaced with the scaled “design intent” profile.
The effect of the three inlet profiles on the 3D corner separations is shown in Figure 9. The first and most important thing to note is that replacing 5–40% and 60–100% of the span, the “repeating stage” endwall boundary layer region, with the scaled “design intent” profile has a very large effect on the topology and size of the 3D corner separation. Comparing the LHS and centre of Figure 9 shows that there has been a dramatic reduction in the “hub corner separation fraction” of 13 percentage points. This can also be seen from the downstream loss contours, which show that the size of the 3D corner separation has been significantly reduced.
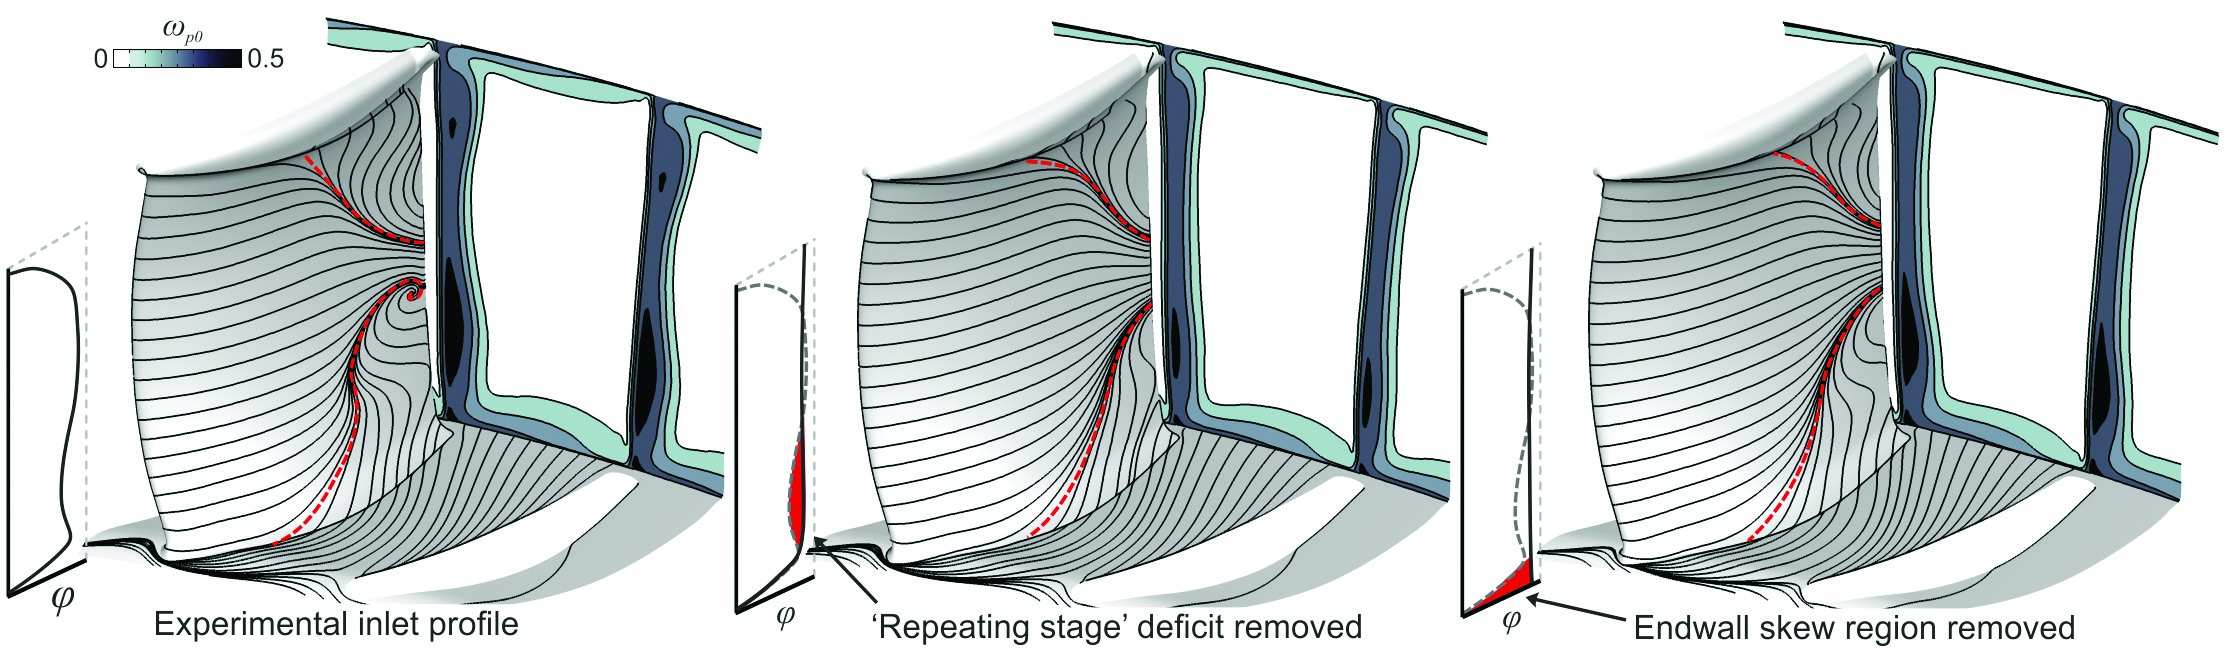
The second thing to note is the effect of the highly skewed endwall boundary layer region due to the frame of reference change, 0–5% span. Comparing the centre and RHS of Figure 9 shows that the effect of the skewed boundary layer, though modest, is not insignificant. It is clear that the presence of the skewed boundary layer is acting to reduce the size of the hub corner separation by 6 percentage points.
Conclusions of “design intent” geometry sensitivity study
The results of all the design intent geometry investigations are summarised in Figure 10. The study clearly shows that for a modern 3D compressor blade, with the “design intent” geometry, the size of the 3D corner separations was only a weakly sensitive to the modelling fidelity within the blade row. However, the size of the 3D corner separations was strongly sensitive to the modelling fidelity within the multi-stage environment. Of course, multi-stage modelling fidelity also derives from the cumulative sum of the modelling fidelity within individual blade passages, however, it is the effect of inaccuracies built up over several blade rows which is important and not the modelling accuracy in the particular blade row being studied.

This explains why many gas turbine manufacturers develop complex low order models tuned to experimental levels of blockage, deviation and loss. These models are used to predict radial profiles which are then fed into “embedded stage” CFD models such as the one described in this paper.
This work also explains why the findings on multi-stage endwall design in the literature 1 were so powerful. The authors showed that to really influence a design you need to design in the multi-stage environment, exploiting the inlet profile sensitivity identified in this study. However, this presents the designer with a dilemma. The designer must use low order models to predict the multi-stage matching accurately, but those low-order methods prevent the designer exploiting the true power of sensitivity to multi-stage design. Developing new compressor design systems that exploit this sensitivity whilst accurately predicting multi-stage matching will be one of the most important challenges facing compressor designers.
One further point is worth making. The study described above is for a shrouded stator. A similar study has been undertaken for a rotor. Despite the suction surface flow topology being very different to the stator, the same conclusions can be drawn as shown in Appendix A. The 3D separation is shown to be insensitive to local changes in endwall modelling and again, only the inter-blade row profile has any significant influence.
Part II: End of life geometry
In this part of the paper, the sensitivity study is undertaken on a blade row with “end of life” geometry. This has been defined as a shroud clearance of 3% span and blade surface roughness scaled from an engine after 4,000 take-off and landing cycles. The sensitivity analysis was undertaken using a combination of the embedded stage model and experimentation. The sensitivity to endwall and shroud modelling was undertaken computationally. The sensitivity to “end of life” roughness was undertaken experimentally. This is because it was thought that the computational roughness models available to the authors would be unlikely to capture the real effect of roughness.
Sensitivity to endwall and shroud modelling
The four endwall and shroud modelling methods were again used but this time the clearance on the shroud was raised to 3% of span. The three key cases, the full cavity model, the dead cavity and the no cavity model are shown in Figure 11. The 3% clearance was found to have a leakage mass flow rate, which is 1.1% of the inlet mass flow.

Figure 9 shows that for the 3% clearance, modelling the full cavity results in a large increase in the size of the hub corner separation (~13 percentage points). This shows that at very high clearances, the hub corner separation starts to become sensitive to the leakage flow in that blade row.
The reason for this can be observed from the dynamic pressure and tangential velocity profiles just upstream of the stator leading edge for the 1% and the 3% clearance, shown in Figure 12. As leakage flow rate is increased, the shorter residence time of the flow in the cavity results in it picking up less tangential momentum from the rotating cavity walls, hence the leakage flow exits the cavity with a lower tangential velocity and dynamic pressure.
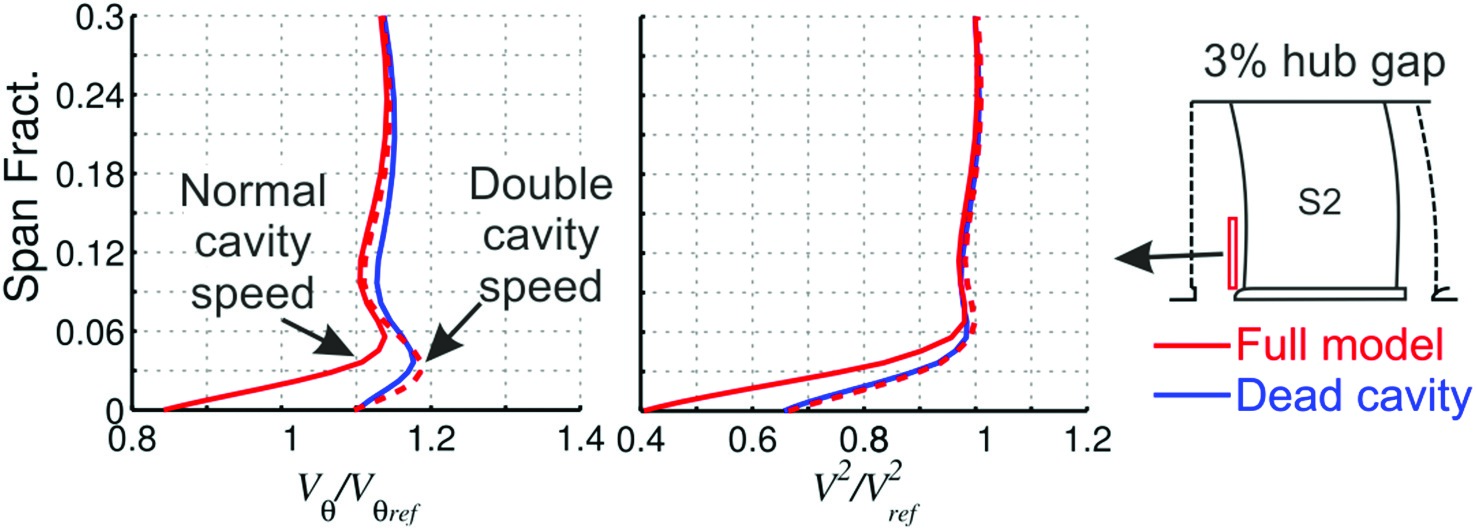
To illustrate the importance of the tangential velocity component of the leakage flow on the hub corner separation, the 3% clearance case was modelled again with double the cavity rotational speed. This acts to increase the tangential velocity of the leakage jet by 60% and eliminates most of the dynamic pressure deficit caused by the increased leakage flow rate, as shown in the radial profiles Figure 13.
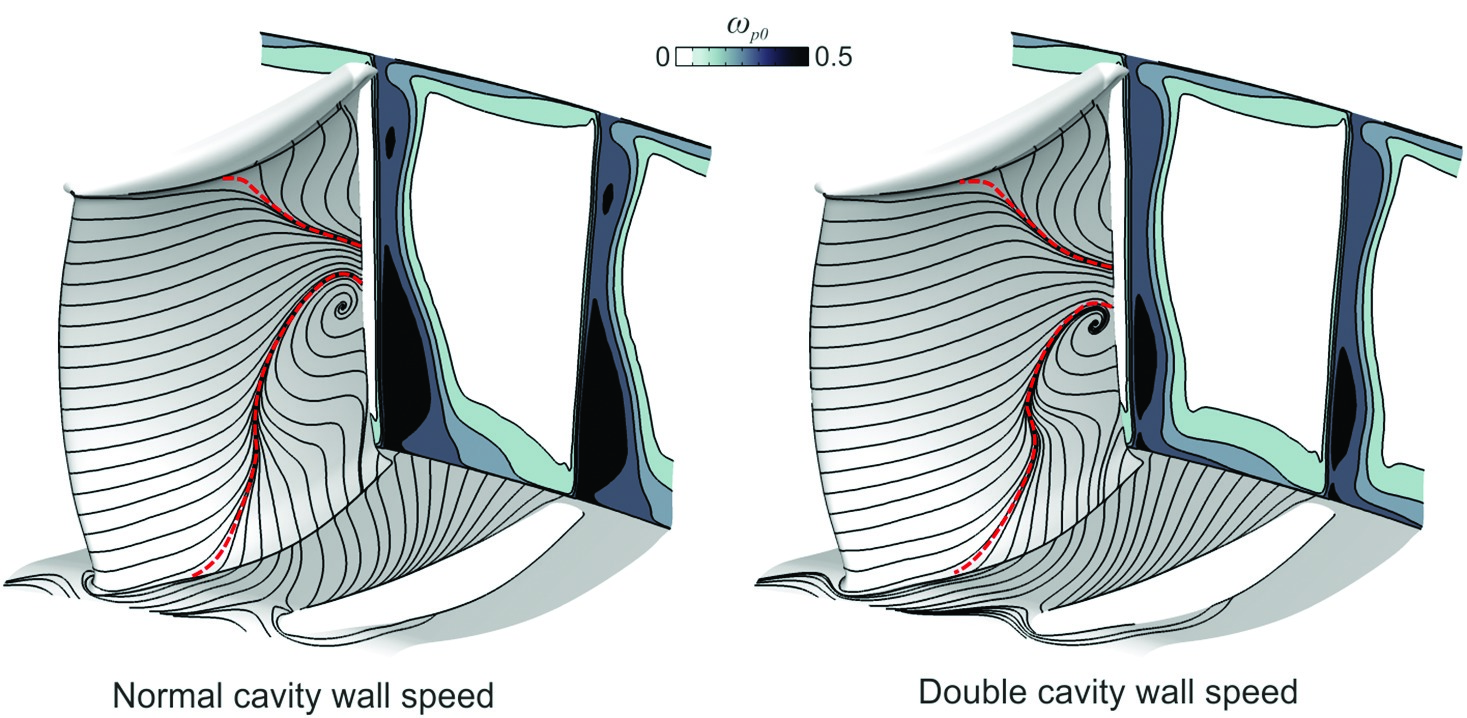
The importance of the leakage jet’s tangential velocity is shown in Figure 14. For the double cavity wall speed case, the increased tangential velocity of the leakage jet reduces the corner separation size significantly, to a size similar to that of the dead cavity case in Figure 11. This is because the increased inlet tangential velocity allows the endwall flow to overturn later in a similar way to the dead cavity case, which results in significantly less disruption to the suction surface flow.
This leakage flow tangential velocity study also explains why the removal of the 1% clearance shroud model had very little impact on the corner separation size. As evident from Figure 12, the tangential velocity of the leakage flow just upstream of the stator is virtually identical to the flow in the dead cavity case, meaning very similar endwall flow develops. Interestingly, the same leakage flow study on an equivalent 2D stacked stator blade, as shown in Figure 17 in Appendix B, gives the same insensitivity, proving that it is the leakage tangential velocity that is key to determining the sensitivity of corner separations to leakage flow.
Sensitivity to surface roughness
Two experimental roughness cases were tested. These, along with the baseline case are shown in Figure 15. Only two stators in the blades row, labelled on the contour plots, had roughness added. This was due to only having access to two removable stator blades in the multi-stage rig.

The first case has roughness located over the entire hub endwall between the two removable stators. The was done because in the computational endwall and shroud sensitivity studies earlier in the paper, it was found that making the endwall inviscid had relatively little effect on size of the hub corner separation. In this case, the opposite is done and the endwall is made extremely rough. Once again, it can be seen from Figure 15 that changes to the endwall have little effect on the size of the corner separation.
The second case has 5–95% span roughness located on leading edges of the two removable stators (2% chord along pressure surface, around the leading edge to 5% chord along the suction surface). The aim of this test was to investigate the effect of large levels of leading edge roughness on the 3D corner separation. Work in the literature 4, 5, showed that on 2D compressor blades 3D corner separation are extremely sensitive to leading edge roughness. Figure 15 shows that the effect of roughness on the 3D compressor blade in this study was extremely large, larger than the effects reported in the literature 4, 5.
The high sensitivity of the blade to leading edge roughness in the current study is very surprising. Previous tests which exhibited sensitivity 4, 5 were undertaken on two dimensional compressors blades which were designed without lean or sweep. In such blades, leading edge roughness “weakens” the blade surface boundary layer and results in a significant rise in the size of the 3D corner separation.
The design of the lean and sweep on the current blade was undertaken by “balancing” the two aerodynamic failure mechanisms (3D corner separation and trailing edge separation). This method of 3D design is described in the literature 11. Such a design is normally very insensitive to leading edge roughness. However, Figure 15 shows that above a critical roughness the “balance” design approach results in the boundary layer separating, “unzipping” across the whole span.
This finding is important because it shows that whilst 3D blades are more resistant to leading edge transition and roughness, once the leading edge roughness reaches a critical value the blade suffers from a catastrophic aerodynamic failure across the whole span.
Conclusions
The most important result in this paper is the switch in accuracy of computational codes as the compressor geometry changes from its “design intent” to its “end of life” geometry.
When a compressor has the “design intent” geometry, the computation accurately predicts the 3D corner separation size in a blade passage, on condition that the inlet flow to the blade passage is accurately known. However, computational codes typically fail to accurately predict 3D corner separations in multi-stage simulations and hence stage matching. In such simulations, small errors in the exit flow conditions from one blade row result in small errors in the inlet conditions to downstream blade rows. It is therefore the sensitivity of blades to small variations in inlet flow conditions, as shown in this paper, which causes the well-known problem of computational codes failing to accurately predict multi-stage matching.
When a compressor has its “end of life” geometry the accuracy of the computation switches. Even if a blade’s inlet flow is accurately known the computation loses its ability to accurately predict the 3D corner separation size within a passage. This finding is of significant importance to designers because it shows that current computational codes are not able to predict end of life performance.
The sudden inaccuracy of computational codes to predict the 3D corner separations accurately within a single blade passage is found to have two causes. First, the effect of leakage seems to become progressively more important as the gap opens. Second, the effect of roughness becomes very important and should be of extreme concern to designers. Modern 3D blades are designed to “balance” the aerodynamic failure mechanisms across the blade span 11. This research shows that such a design philosophy is exceptionally good at making blades aerodynamic robust to low levels of leading edge roughness. However, above a critical level of leading edge roughness this style of blade “unzips” up the whole span causing catastrophic aerodynamic failure. Gas turbine manufacturers that do not have a tolerancing metric for this critical level of roughness are running a significant risk.
Appendix A
An endwall geometry sensitivity study was performed on rotor 3 of the SMURF rig using an embedded stage rotor 3-stator 3 model with the experimentally measured inlet radial profile.
Three cases were investigated:
1. Full blade model: The model includes the tip gap and all viscous surfaces.
2. No tip gap model: This model eliminates the tip gap.
3. Inviscid endwalls: This model has both hub and casing endwalls replaced with inviscid walls.
The full model case replicates the measured hot-wire data well as shown in Figure 16. The structure of the wake is very different to the stator due to the centrifugal forces experience by the boundary layer.
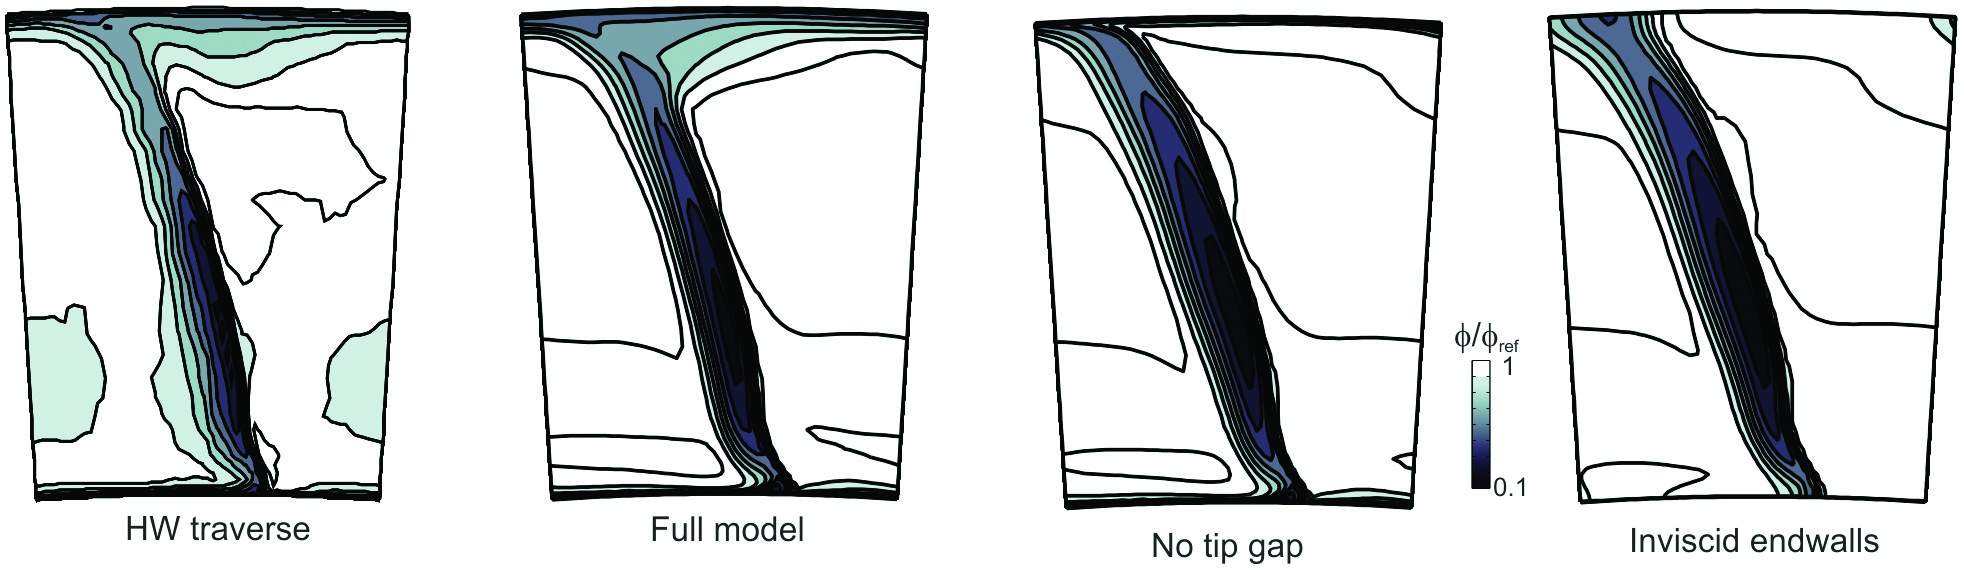
The no tip gap and inviscid endwall trailing edge wakes look very similar to the full model case. Again, this result shows that the 3D separation size is relatively insensitive to modelling fidelity within the blade passage. Although not shown here, it is the inlet profiles that have a more significant impact.