
Introduction
The cantilevered stator is a widely used structure of gas turbine compressors, which has the advantages of light weight, compact structure and easy manufacture. However, there is ahub leakage flow in the gap between the cantilevered stator and the disc. Due to the influence of pressure difference and disc rotation, the hub leakage flow interacts with the mainstream through the radial gap, which brings adverse effects on the aerodynamic performance and stability of the compressor. With the development of axial flow compressor towards high loading and low aspect ratio, the influence of the hub leakage flow becomes more and more obvious.
The factors affecting the leakage flow dynamics generally include the size of tip/hub clearance, endwall moving and blade loading. Among them, the influence of tip/hub clearance size on the leakage flow is the most studied. Tschirner et al. (Tschirner et al., 2006) conducted experimental research on medium loading cantilevered stators at different tip clearances (1.8 mm, 3.0 mm, and 4.8 mm, corresponding to 2.05%, 3.41%, and 5.45% hub chord) on the low-speed research compressor test rig. By employing 3D stacking rules and adjusting radial loading, the leakage vortex generated by the clearance was mitigated to enhance the aerodynamic stability of the compressor. Sakulkaew et al. (2013) assessed the sensitivity of compressor rotor efficiency to a range of tip gaps. The numerical simulation results of large gaps show that with the increase of the gap, the shift of the maximum loading position toward the trailing edge delays the generation of the leakage vortex, resulting in incomplete mixing with the mainstream within the passage. Ju et al. (2020, 2021a) studied the hub clearance effect in the design space of the cantilevered stator embedded in a 4-stage low-speed research compressor, and details that with the hub clearance increasing from 1.1% to 4.5% span, the loss coefficient and the total leakage momentum of the cantilevered stator correspond to the change of the blade loading near the hub. The mixing of leakage flow in 1.1% span clearance and 2.5% span clearance is basically completed in the passage, but the mixing of leakage flow in 3.5% span clearance and 4.5% span clearance is still relatively strong downstream of the cantilevered stator. In these studies, the influence of clearance variation on blade loading was discussed.
In terms of experimental research on the influence of moving endwall on the leakage flow, early studies by Doukelis et al. (1998) established a high-speed annular compressor cascade with static or moving endwalls (Mach number of 0.504). The results show that the loss of moving endwall is more sensitive to the gap size than that of static endwall. With the same gap, the endwall moves so that the position of minimum static pressure moves upstream. In Virginia Tech (Muthanna and Devenport, 2004), a moving endwall system for a low-speed linear compressor cascade (with a deflection of 12.5°) wind tunnel was designed and built to simulate the effect of the relative motion between the blade clearance and the casing on the wake. The study results show that the endwall motion leads to a more uniform and sheared distribution of turbulence intensity and mean velocity in the wake. The average helicity density maps also demonstrate that the endwall motion causes the center of the wake to stretch from a single point into a band shape. Pallot et al. (2011) and Kato et al. (2011) used a low-speed moving endwall driven by a belt wheel to study the effects of moving and static endwall on the leakage flow of a compressor rotor linear cascade. The results show that the endwall motion makes the leakage flow field significantly different. The leakage vortex is pulled to the pressure surface of the adjacent blade due to the endwall shear motion, and the leakage loss decreases. Wu and Chu (2012) observed that the high loss zone contracted and extended towards the pressure surface (PS) of the adjacent blade in the case of moving endwall. Deng et al. (2023a, 2023b) presented a novel experiment facility with a high-speed moving endwall for studying compressor leakage flow, and the results reveal that the moving endwall significantly changes the distributions of the total pressure loss and static pressure coefficient. Based on this study, Qiang et al. (2023) gave the effect of the moving endwall on the unsteadiness of the leakage flow. The tip leakage flow can impinge the adjacent PS, and build a periodic unsteady tip leakage flow by changing the blade loading if it is strong enough. Xia et al. (2023) conducted an experimental test using the same experimental equipment as above, and the results reveal that endwall movement amplifies circumferential leakage loss, increases kinetic energy, deviates the leakage flow path, and reduces the total pressure loss in the leakage core region. From these experimental studies, it can be seen that the moving endwall has a great influence on the leakage flow. Since the aero engine runs from low rotational speed to high rotational speed, the leakage flow must change greatly in the full working conditions.
In terms of the study on the influence of blade loading on leakage flow, Chen-kai et al. (2015) performed three-dimensional stacking line optimization on prototype rotors of a large low-speed compressor, finding that a certain degree of positive bow effectively reduces the flow loss in the hub region. This approach, characterized as “fore-loading”, inhibited flow separation at the blade trailing edge, reducing the total pressure loss of the rotor by approximately 19.4%. In contrast to fore-loading strategies, Tiralap et al. from MIT (Tiralap et al., 2016) proposed an aft-loading design approach to delay the generation of tip leakage vortex, and an estimated 0.15 points enhancement in stage efficiency is possible from aft-loading rotor tip only. Xu et al. (2021) and Xu et al. (2022) designed four different blade loading distributions, and the steady simulations showed that the variation of rotor blade loading distribution leads to significant change of the steady performance incorporating pressure ratio and efficiency at all mass flow conditions. Zheng and Li (2017) systematically summarized from numerical, experimental, and mechanistic perspectives that cambered blades can reduce endwall loss while increasing the mid-span loading and swept blades can control the radial migration of the boundary layer on the blade surface, reducing rotor tip leakage loss through a leading-edge unloading method. These studies pay more attention to the influence of rotor blade loading mode on tip leakage flow, but the cantilevered stator does not rotate, so there is no centrifugal force, and there is a certain difference between the hub leakage flow of cantilevered stator and the tip leakage flow of rotor. Ju et al. (2021b) investigated a 4-stage low-speed research compressor with embedded cantilever stators to increase the overall cantilevered stator loading by reducing the solidity. The diffusion factor (DF) at the midspan at the design working condition is 5.2% higher than the datum, and the results show that the blockage region becomes large and occupies the lower half of the fore blade passage because the low solidity stator could not provide enough flow turning ability at the near stall condition. This study focuses on the effect of the increase of the overall loading of the cantilevered stator, and does not study the effect of the change of loading position.
To sum up, previous studies on the hub leakage flow of cantilevered stators mainly focused on the influence of clearance size and moving endwall, and lack of detailed studies on the influence of different blade loading positions on the hub leakage flow. Therefore, this paper uses a novel experiment facility with a high-speed moving endwall (Deng et al., 2023b) and numerical simulation methods to focus on the influence of a fore-loading cantilevered cascade on the hub leakage flow and its mechanism, and compare with the typical middle-loading controlled diffusion airfoil (CDA) cascade, in order to give a new understanding of the influence of cantilevered stator loading design on the aerodynamic performance of the compressor.
Methodology
Experimental setup
A fore-loading airfoil (FLA) cascade and a middle-loading CDA cascade were studied. Figure 1 displays the schematic of the FLA, and Table 1 summarizes the main geometric parameters of the two cascades. The chord (C) of both cascades is 60 mm, the height of the blade passage (hereafter referred to as span) is 70 mm, and the solidity is essentially consistent.
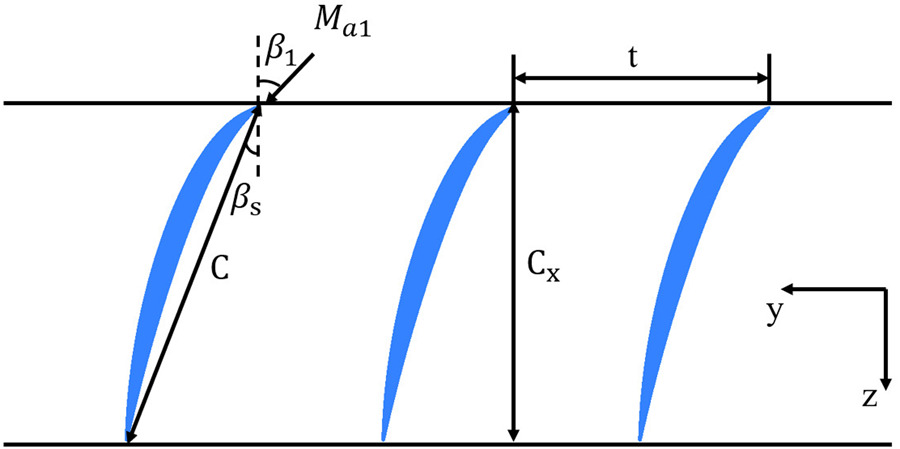
Table 1.
Parameters of compressor cascades.
| Parameter | Value of FLA | Value of CDA |
|---|---|---|
| Chord/(mm) | 60 | 60 |
| Blade pitch/(mm) | 42.8 | 41.27 |
| Inlet flow angle/(°) | 43 | 47 |
| Span/(mm) | 70 | 70 |
| Stagger angle/(°) | 20.3 | 30 |
| Gap size/(mm) | 1.5(2.14%Span) | 1.5(2.14%Span) |
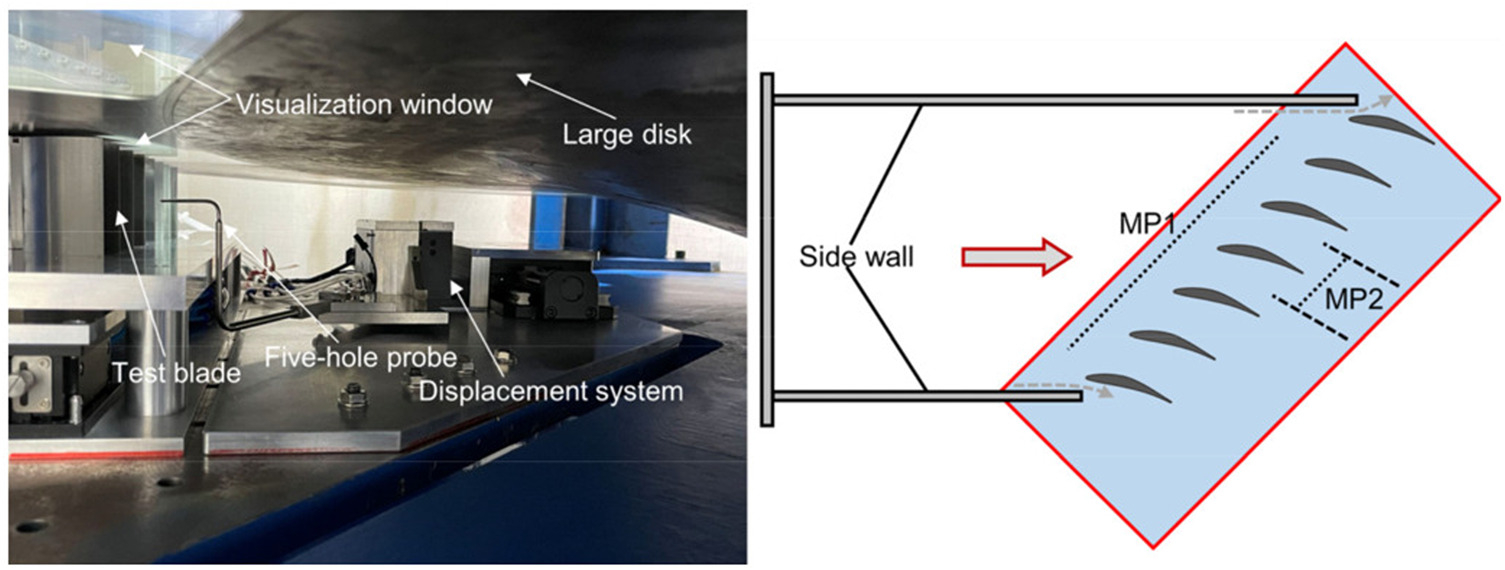
The experiments were conducted at the high-speed disk cascade wind tunnel facility of Shanghai Jiao Tong University. The air supply for the experiments is provided by a centrifugal compressor, with a design inlet volume flow of 180 m3/min and a pressure rise of 110 kPa. The exit of the compressor duct connects to an expansion section and a plenum chamber, which contains two damping screens and one honeycomb to stabilize the flow. Following the plenum, a converging section forms an outlet dimension of 300 mm × 300 mm, which connects to the cascade test section. The test section inlet is equipped with a boundary-layer suction device. Pressure taps are arranged upstream and downstream of the cascade, and static pressure ports are used to collect the static pressure distribution on the blade surfaces.
Figure 2 provides detailed information about the experimental facility. The FLA cascade, based on the width of the test section and the cascade solidity, arranged 7 blades and 6 passages. At monitoring point 1 (MP1), 0.45C upstream of the leading edge (LE), inflow conditions, including total pressure and endwall static pressure, are measured using a pitot tube and a series of pressure ports, thereby determining the inlet Mach number
Numerical methods and verification
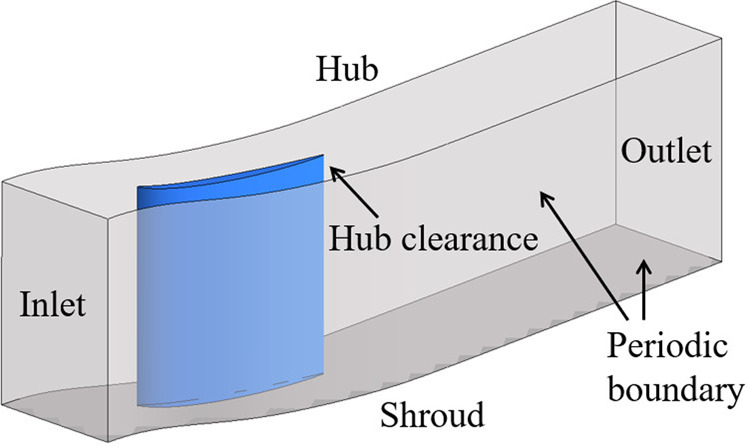
The grid generation is performed with the software NUMECA AutoGrid 5, and the numerical simulation is performed by commercial Navier-Stokes flow solver ANSYS CFX. The computational domain of the cantilevered cascade model is shown in Figure 3. For two cascades of FLA and CDA, the inlet positions are consistent with the measurement location in the experiments, situated at 0.45C upstream of the LE, and the outlet positions are located at the 2C axial position downstream of the TE.
The four cases for both FLA and CDA are established as shown in Table 2, with the case names denoted by the cascade name followed by an underscore and either “S” for static or “M” for moving endwall conditions. For example, FLA_S/M represents the case of FLA at the condition of static/moving endwall. The endwall moving speed is 106.8 m/s, calculated based on the physical rotational speed and the outer diameter of the big disc in the actual experiment. The inlet boundary conditions for the numerical simulation are given in the form of the radial total pressure distribution measured in the experiments, the average inlet flow angle, and the total temperature. The incidence is 0°, indicating the design-point condition. The outlet boundary condition is given in the form of the average static pressure, and adjusted based on experimental values to ensure the inlet Mach number of 0.5 remained unchanged.
Table 2.
Calculation cases illustration.
| Case | Name | Endwall condition |
|---|---|---|
| 1 | CDA_S | static |
| 2 | CDA_M | moving |
| 3 | FLA_S | static |
| 4 | FLA_M | moving |
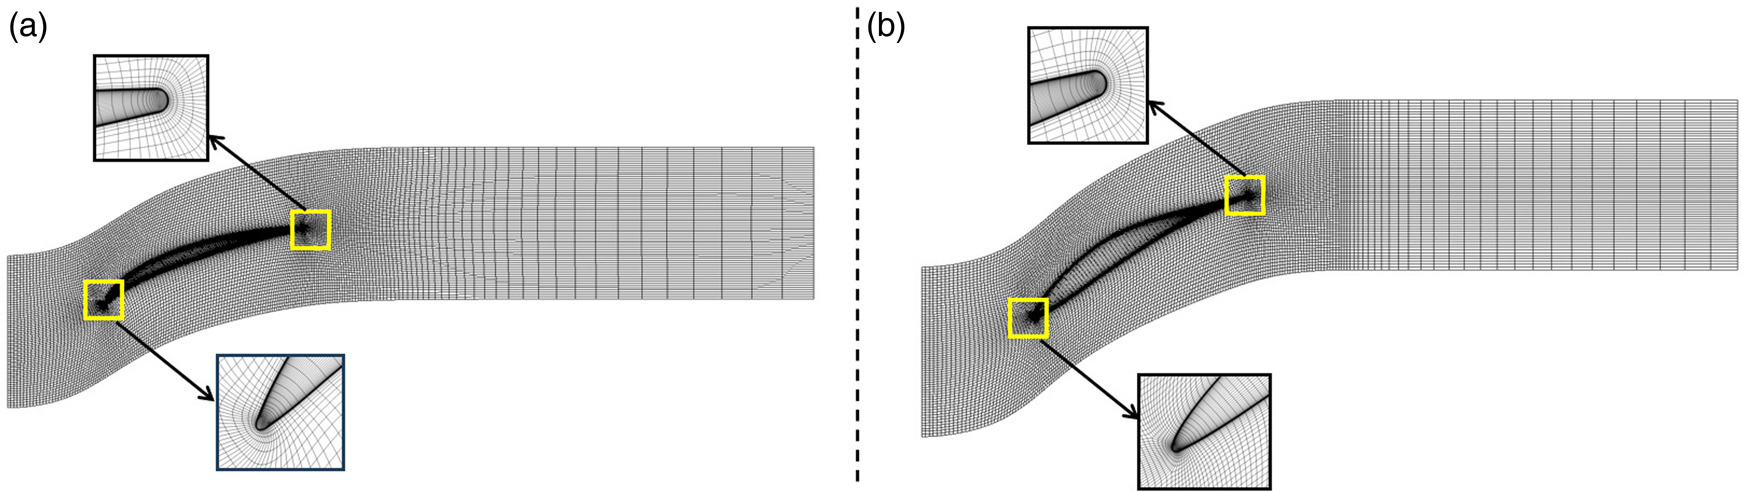
After validation of grid independence, for both cascades, a grid of 2 million nodes is found to be sufficient to meet the requirement for grid independence and is used for subsequent computations, with more details available in reference (Deng et al., 2023a). As shown in Figure 4, the computational grid of the flow domains for the two cascades employs the O4H topology, which is commonly used in turbomachinery, and a butterfly topology is used in the hub gap. The number of radial grid points for FLA and CDA is 125 and the number of radial points within the radial gap is 21. To satisfy the requirement of the turbulence model, the thickness of the first layer of the grid on the blade and endwall surfaces is set to 1 × 10⁻⁶ m, ensuring the computational accuracy of the boundary layer.
The formulas for calculating the total pressure loss coefficient
where p* represents the total pressure, p represents the static pressure, and the subscripts in and out denoting the inlet and outlet of the cascade, respectively.
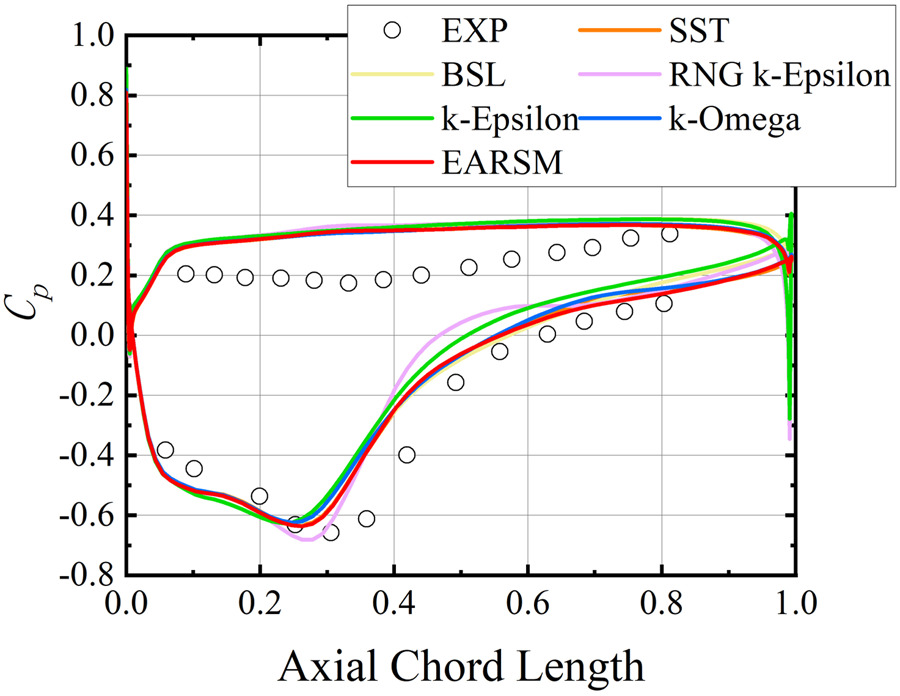
Six common turbulence models (BSL, k-Epsilon, EARSM, SST, RNG k-Epsilon, and k-Omega) are calculated and evaluated. Due to the same computational platform, grid, differential format, and boundary condition settings, the results mainly originate from the turbulence model itself, so the calculation differences of each turbulence model can be compared. For the FLA-S case, the static pressure coefficient on the blade surface at 4.28% span is selected for comparison. The results, as displayed in Figure 5, show certain variations among the different turbulence models. Compared with the experimental results, the numerical simulation overestimates the static pressure on the pressure surface. In addition, due to the large diffusion coefficient of FLA, the camber angle of airfoil is large, and the verticality error of measuring static pressure by drilling small holes on the pressure surface near the hub clearance is also large, which also leads to the test error. The comparison of the results on the suction surface shows that the computation of the EARSM model demonstrates better agreement, leading to the selection of the EARSM model for the analysis of the hub leakage flow.
Figure 5.
Comparison between numerical simulation results of different turbulence models and experimental results.
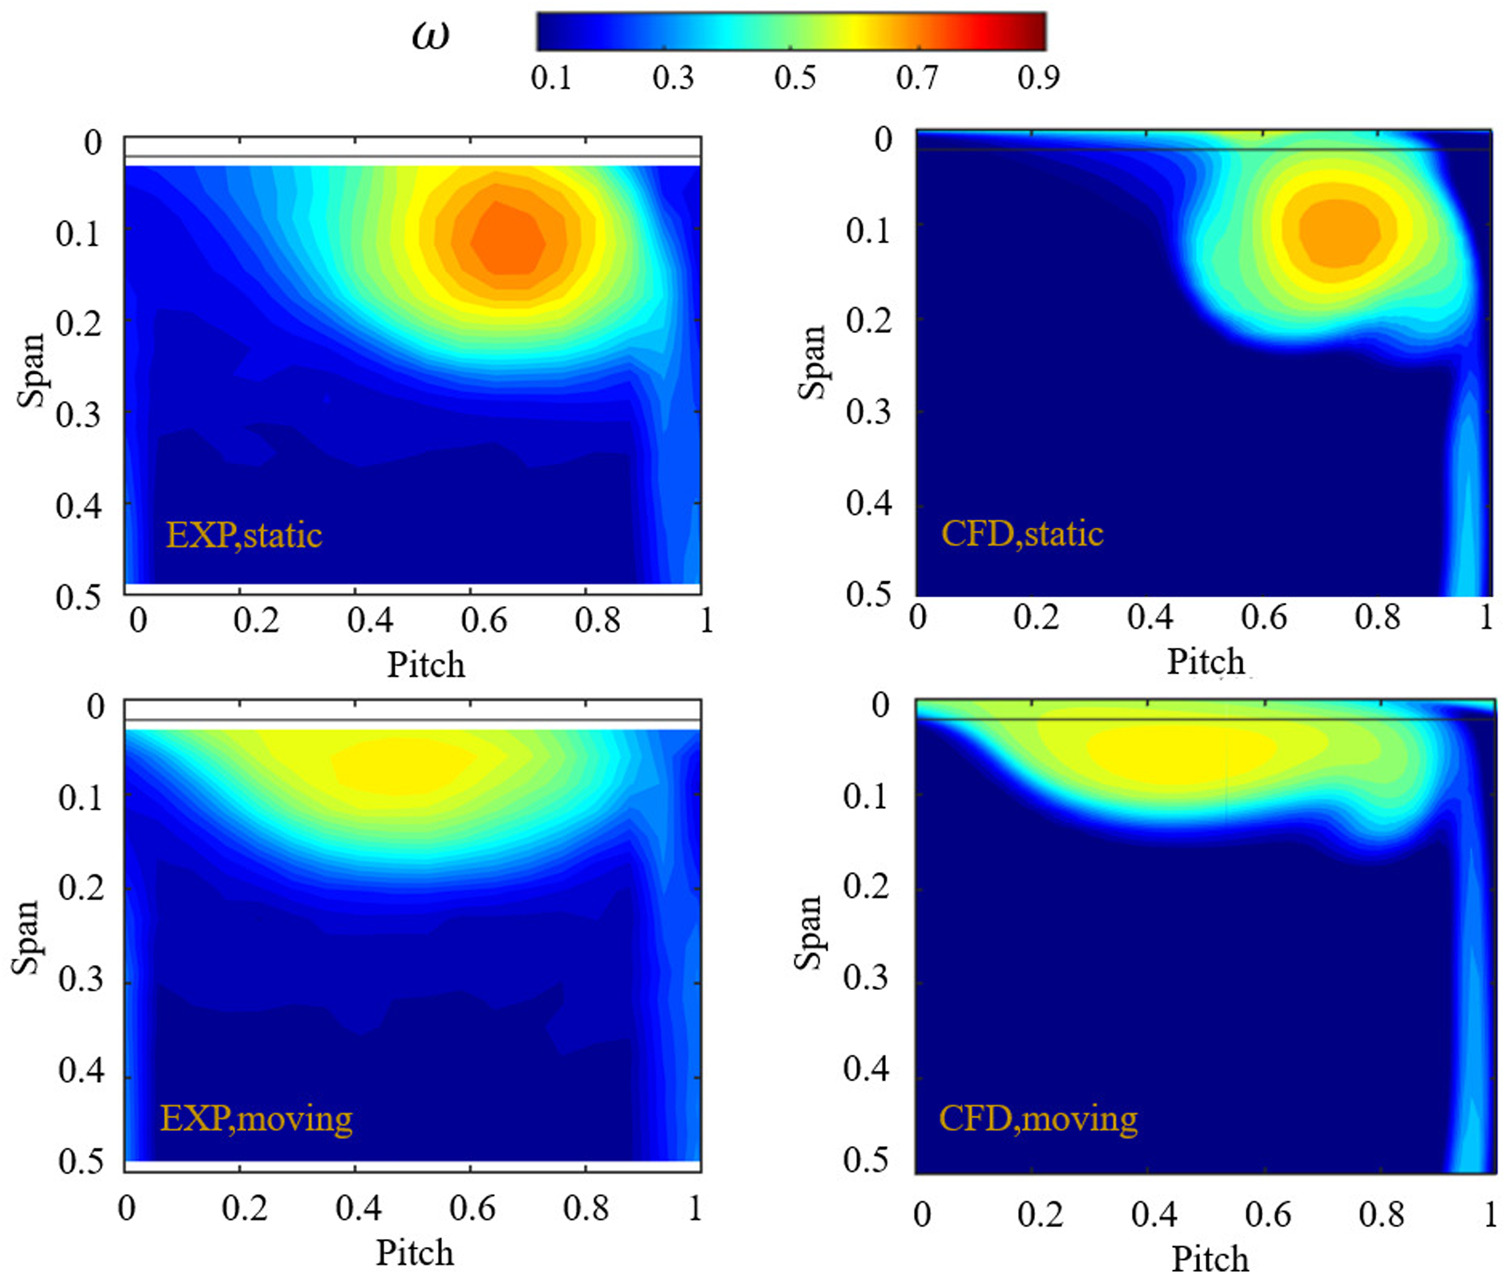
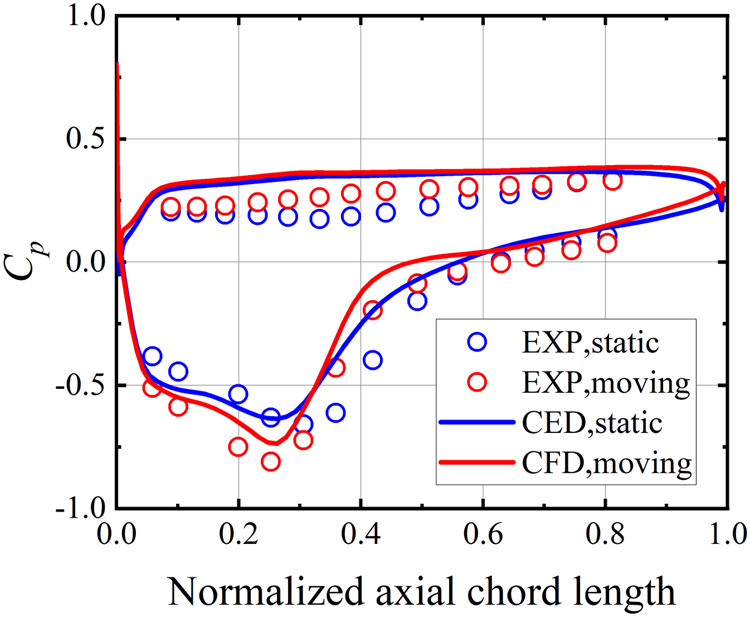
To verify the reliability of the numerical simulation results, the total pressure loss coefficient distribution at the cascade outlet plane (MP2) and the static pressure coefficient on the blade surface at 4.28% span at both static and moving endwall conditions for FLA are shown in Figures 6 and 7. The horizontal lines in Figure 6 indicate the position of the hub clearance. By comparing the experimental and simulation results, it is evident that the simulation aptly captures the core region of the total pressure loss and the trend of Cp. However, the simulation results show a smaller range of the total pressure loss near the endwall. One of the reasons why the outlet total pressure loss is underestimated obviously by the CFD for the static endwall may be that the CFD in this paper adopts a steady RANS method, and the leakage flow is an unsteady phenomenon, there will be some differences between the CFD results and the experimental results. However, the steady RANS calculation is still an important analysis method in engineering because it takes less time. Despite some differences between the CFD results and the experimental results, all following discussions and conclusions in this paper are based on the CFD results, which provides a fair comparison between different conditions. The agreement between the CFD results and the experimental results is acceptable.
Results and discussion
Comparison of overall performance
The overall performance of the two cascades is examined using the diffusion factor (DF) and the entropy loss coefficient
where
Table 3 lists the outlet entropy loss coefficients and the relative changes within the 50% span at both static and moving endwall conditions for the two cascades. At the condition of the static endwall, CDA exhibits a higher entropy loss coefficient compared to FLA, with an increase of 3.93%. At the condition of the moving endwall, the entropy loss coefficients of the two cascades are similar. Furthermore, the moving endwall can reduce the overall entropy loss at the outlet, with FLA decreasing by 4.60% and CDA decreasing by 6.64%.
Table 3.
Outlet entropy loss coefficients and the relative change.
| Case | Relative change | |
|---|---|---|
| FLA_S | 0.04736 | |
| FLA_M | 0.04518 | −4.60% |
| CDA_S | 0.04922 | |
| CDA_M | 0.04595 | −6.64% |
As shown in the figure, the moving endwall has a similar impact on the radial extent of DF and the entropy loss coefficient for both cascades, affecting approximately the top 30% span. Between approximately 30% to 13% span, the moving endwall reduces DF and the entropy loss coefficient, while above approximately 13% span, the moving endwall increases both DF and the entropy loss coefficient. As depicted in Figure 8a, DF for both cascades initially increases and then decreases. At the condition of the moving endwall, both cascades show a similar radial trend distribution, whereas, at the condition of the static endwall, the trend for CDA is closer to the endwall. Moreover, it is evident that FLA has a higher DF than CDA at both static and moving endwall conditions. Particularly at the condition of the moving endwall, the DF of FLA near the hub exceeds 0.6, indicating that FLA is a high-loading cascade. As illustrated in Figure 8b, the entropy loss coefficients for both cascades exhibit a continuously increasing trend radially over about 30% span, indicating that the entropy loss at the cascade outlet increases closer to the hub. An interesting observation is that with the moving endwall, the two cascades with different loading, i.e. fore-loading, and middle-loading, show nearly identical radial distribution of the entropy loss coefficient at the cascade outlet. The reason will be discussed in the following sections.
The influence of fore-loading on the leakage flow characteristics
Blade loading near the endwall
The hub leakage flow primarily originates from the pressure differential between the PS and SS of a blade. To investigate the influence of different blade loading distributions and moving endwalls on the leakage flow, it is essential to analyze the blade loading near the endwall. The static pressure coefficient Cp and the change in static pressure coefficient ΔCp are widely used to assess the variation in pressure on the blade surface, with the definition of ΔCp being as follows:
where the subscripts ps and ss represent the pressure surface and suction surface of the blade, respectively.
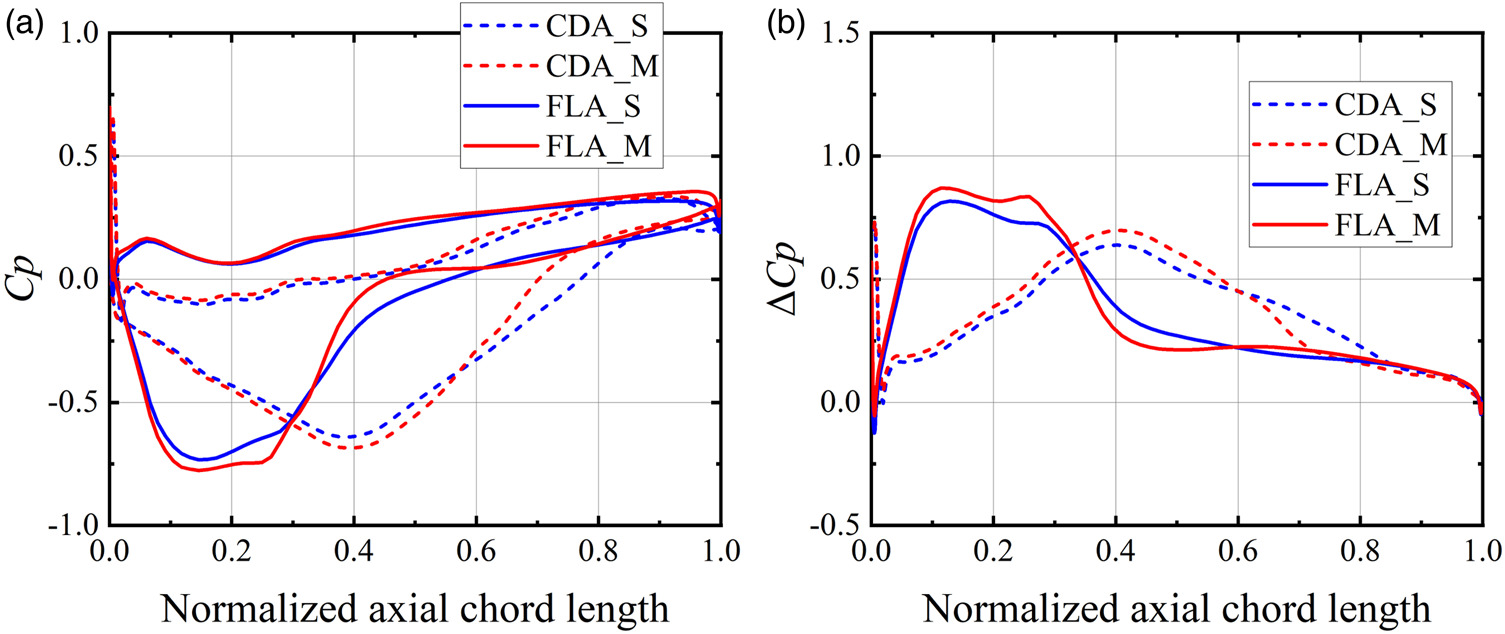
Figure 9 shows the distribution of Cp and ΔCp along the axial chord at 2.5% span. The figure illustrates the differences in maximum blade loading distribution between the two cascades. The ΔCp maximum value for FLA occurs at approximately 10% of the axial chord, whereas for CDA, the ΔCp maximum is at about 40%. The distribution of ΔCp confirms the fore-loading characteristic of FLA and the middle-loading feature of CDA. For FLA, the moving endwall increases the blade loading from approximately 5% to 35% of the axial chord and decreases it from approximately 35% to 60%. For CDA, the moving endwall increases blade loading from about 2% to 60% of the axial chord and decreases it from 60% to 90%. The impact of the moving endwall on blade loading is related to the distribution of the blade loading position. For the fore-loading cascade FLA, the moving endwall increases and then decreases the blade loading at about 35% axial position closer to the blade's LE.
Axial distribution of leakage flow rate and momentum
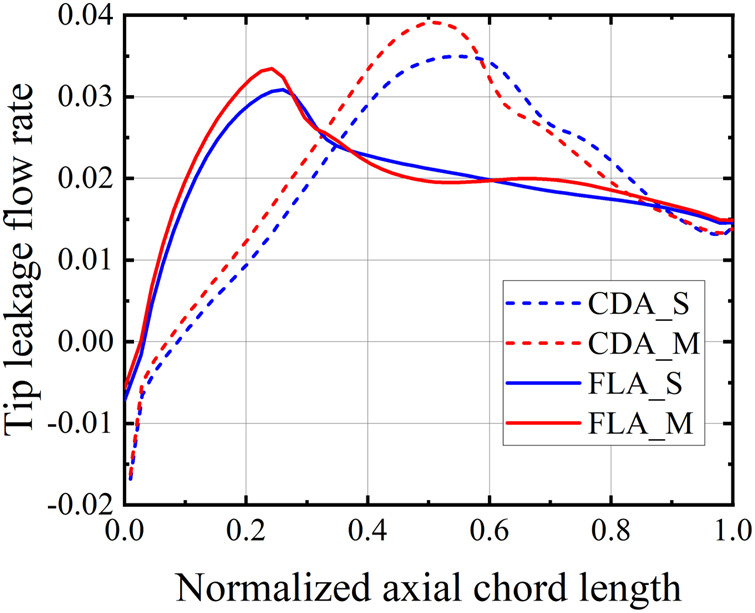
The definition for the dimensionless leakage flow per unit axial chord,
where Vn represents the velocity perpendicular to SS of the blade, C represents the chord, and the integration is carried out over the entire gap height. All parameters in the formula are taken from the position on the blade suction surface.
As shown in Figure 10, the dimensionless leakage flow rate along the axial chord exhibits an increasing and then decreasing trend, with the overall curve trend similar to the ΔCp distribution at 2.5% span. However, compared to the ΔCp at 2.5% span, the distribution of the leakage flow rate along the axial chord is generally shifted further downstream. This indicates that the position of maximum leakage flow rate relative to the position of maximum blade loading is delayed. At the condition of the moving endwall, the peak leakage flow rate for FLA occurs at 24% of the axial chord, delayed by 14% compared to the maximum blade loading position at 2.5% span. For CDA, the peak leakage flow rate occurs at 50% of the axial chord, delayed by 10% compared to the maximum blade loading position at 2.5% span.
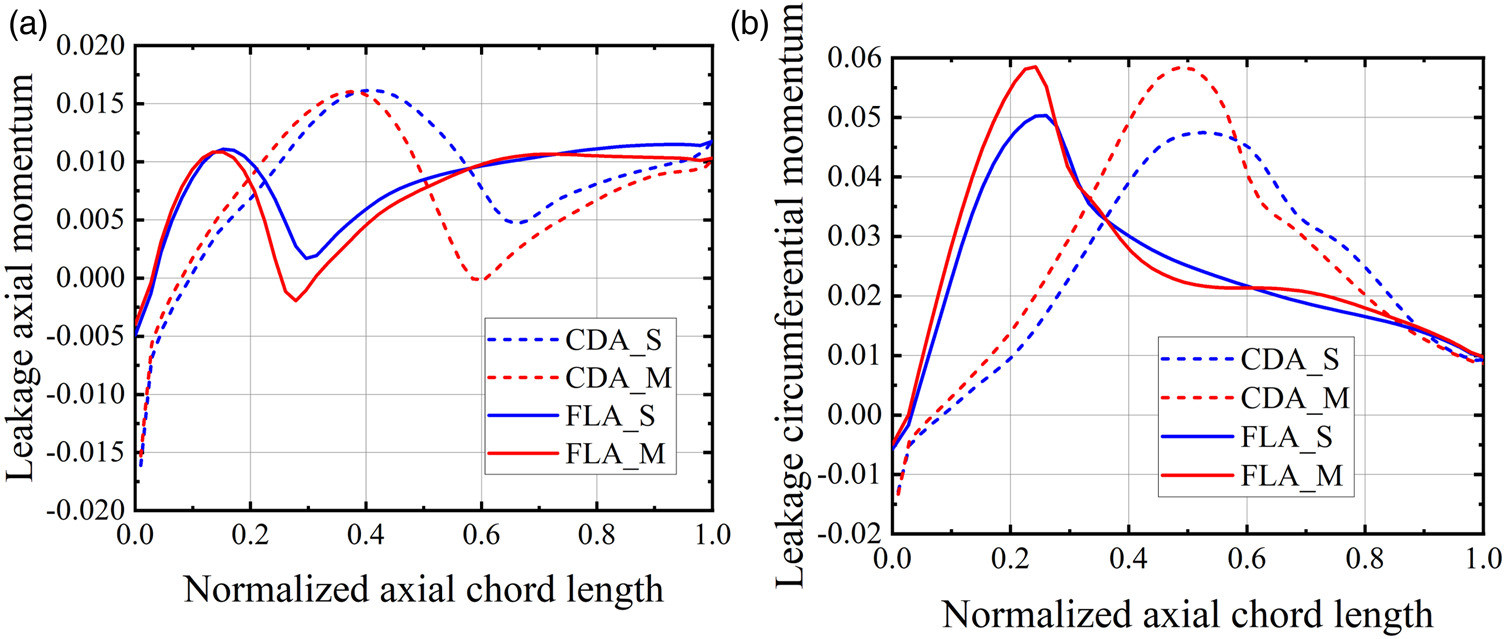
Figure 10.
Distribution of axial momentum and circumferential momentum of the leakage flow. (a) Axial momentum and (b) Circumferential momentum.
For both cascades, the moving endwall increases the peak leakage flow rate and shifts its position upstream. At the condition of the static endwall, the peak leakage flow rate for FLA occurs at 26% of the axial chord, while the moving endwall advances its position by 7.7%. For CDA, the maximum leakage flow rate occurs at 54% of the axial chord, and the moving endwall shifts its position forward by 7.4%. The leakage flow rates at the LE and TE of both cascades show almost no change at both static and moving endwall conditions. The influence of the moving endwall is primarily concentrated in the middle of the blade passage. For FLA, the moving endwall causes the leakage flow rate to exhibit a trend of first increasing, then decreasing and finally increasing again. For CDA, the moving endwall results in a leakage flow rate that initially increases and then decreases.
The definitions for the dimensionless axial and circumferential momentum of the leakage flow per unit axial chord are as follows:
where the subscripts z and y represent the axial and circumferential directions, respectively.
According to Figure 11, the peak axial momentum of the leakage flow coincides with the position of the maximum blade loading, while the peak circumferential momentum aligns with the peak leakage flow rate and lags behind the position of the maximum blade loading. As shown in Figure 11a, the effect of the moving endwall on both cascades is similar, slightly increasing the axial momentum before the peak and decreasing it after the peak, that is, the moving endwall reduces the axial momentum of the leakage flow before the maximum blade loading position and increases it afterward. In addition, the maximum axial momentum of the leakage flow of the CDA cascade is greater than that of the FLA cascade. In Figure 11b, the circumferential momentum of the leakage flow is relatively similar to the distribution of the leakage flow rate itself.
Flow field details
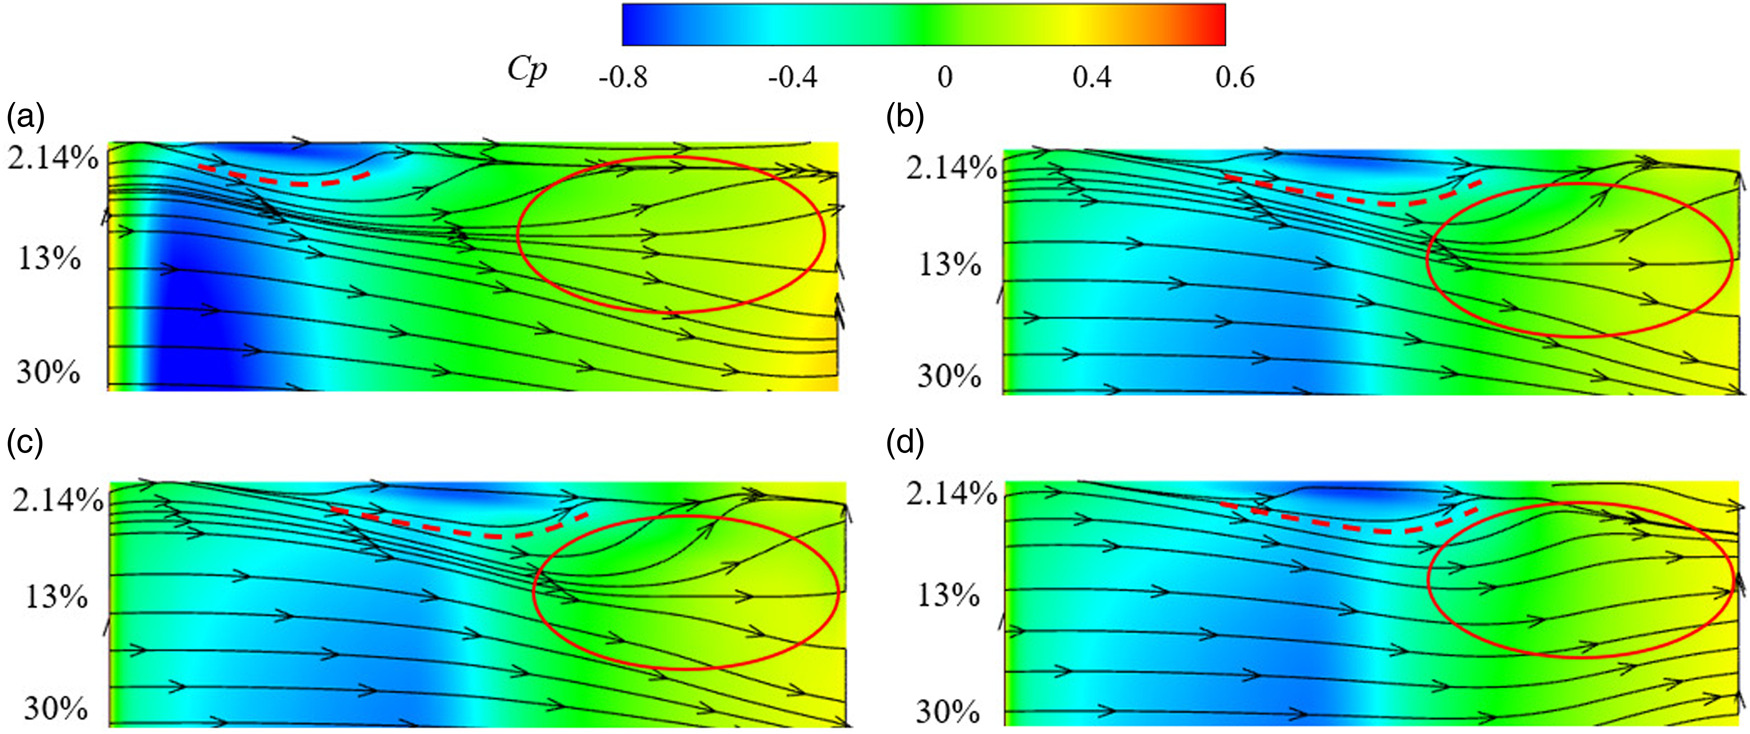
Figure 12 displays the limit streamlines and the static pressure coefficient distribution on the suction surface above 30% span for both FLA and CDA cascades at different endwall conditions. The positions where the streamlines near the hub begin to curve correspond to the locations of maximum blade loading for both cascades. The curving of the limit streamlines on SS signifies the formation of the leakage vortex close to SS. This can explain the delay of the maximum values of leakage flow rate and circumferential momentum relative to the maximum blade loading as observed in Figures 10 and 11. At the maximum blade loading, the leakage flow rolls into a vortex and develops downstream, affecting the hub gap flow. Referring to the characteristics in Figure 11, at the maximum blade loading position, the axial momentum of the leakage flow reaches its peak while the circumferential momentum continues to increase. Consequently, this leads to the phenomenon that the position of the maximum leakage flow rate lags behind the position of the maximum blade loading. In addition, at the static endwall condition, the direction of the streamlines near TE of both cascades are not uniform, with velocities directed towards the hub gap, indicating that leakage vortex at TE develops close to SS, which affects the evolution of the limit streamlines on the blade surface. At the moving endwall condition, the direction of the streamlines for both cascades is more uniform with a greater proportion of axial direction, suggesting that the moving endwall pushes the vortex development away from SS, reducing the influence of the leakage vortex on the development of the limit streamlines on the blade surface. In addition, about 13% span is taken as a critical position, where the difference in streamline distribution for two cascades at static and moving endwalls also corresponds to the radial distribution of the entropy loss coefficient described in Figure 8.
Figure 12.
Hub leakage flow trajectory on the suction surface above 30% span. (a) FLA_Ş (b) CDA_S, (c) FLA_M and (d) CDA_M.

Figure 13 shows the projection of the three-dimensional hub leakage flow on the suction surface, with the white line representing the location at 13% span. It is evident that at the static endwall condition, for both cascades, the radial influence range of the leakage flow in the cascade exceeds 13% span, hence leading to a larger radial range of entropy loss. However, the shearing action brought by the high-speed moving endwall mainly increases the circumferential velocity of the leakage flow, thereby reducing the radial distribution of the leakage flow, and the radial range of the leakage flow basically falls less than 13% span.
Figure 13.
Leakage flow trajectories and entropy loss distributions at axial sections. (a) FLA_S, (b) CDA_S, (c) FLA_M and (d) CDA_M.
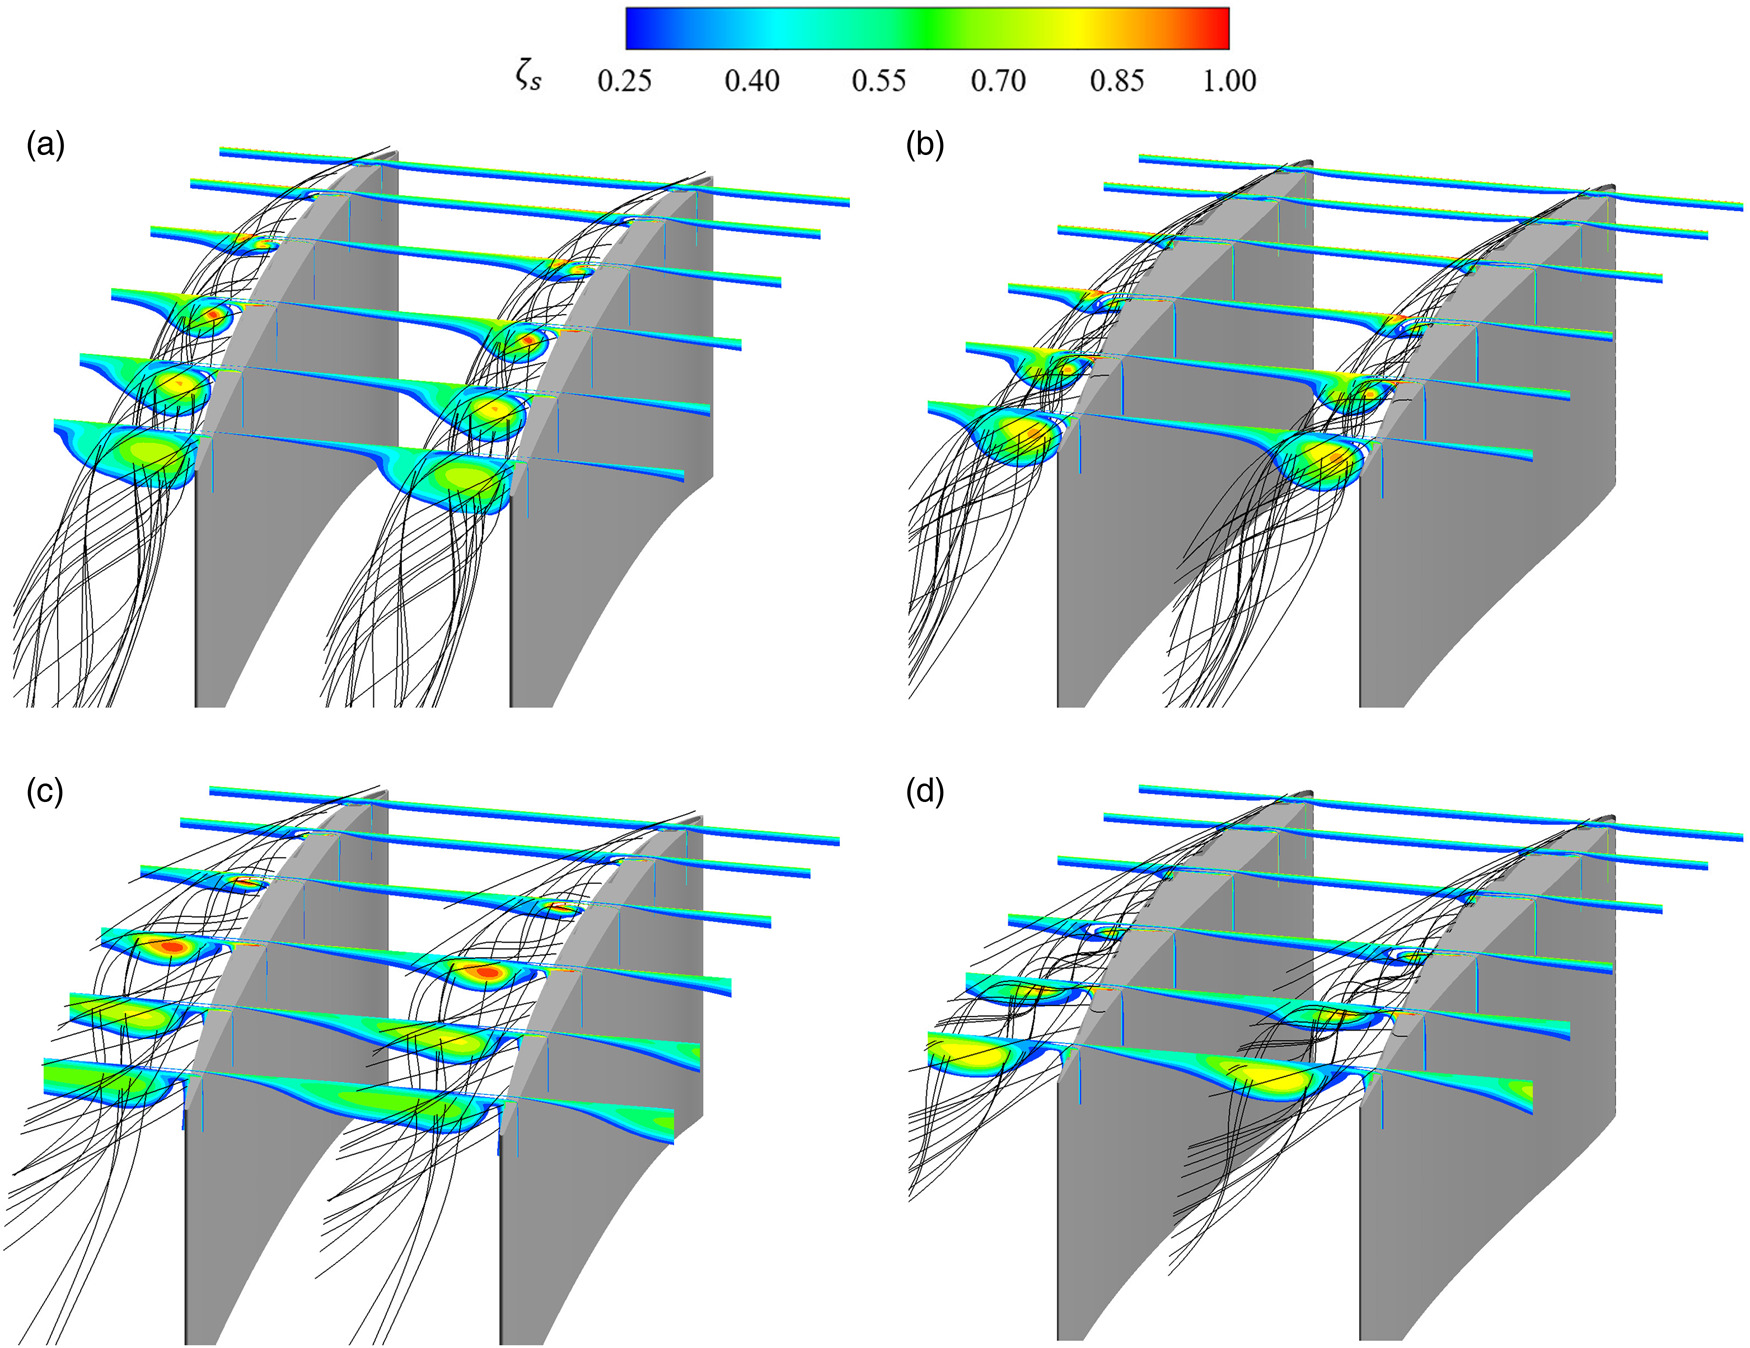
Figure 14 presents the trajectories of leakage flow along with the entropy loss distributions at different axial sections, where the axial sections are situated at 5%, 15%, 30%, 50%, 70%, and 90% of the axial chord, respectively. As indicated in the figure, the majority of the leakage flow is concentrated within areas of high entropy loss. Based on the analysis in Figure 13, it is evident that the radial distribution of the entropy loss coefficient is predominantly influenced by the radial extent of the leakage flow. Moreover, as shown in Figure 14, upstream of the passage, the entropy loss near the endwall is almost identical for both cascades. However, FLA exhibits significant entropy loss in the cascade passage starting from about 30% of the axial chord, while CDA shows significant entropy loss starting from about 50% of the axial chord. At about 90% of the axial chord, FLA has less entropy loss, but the range of loss in the passage is more extensive. In contrast, CDA possesses a higher entropy loss, but with a more confined range in the passage.
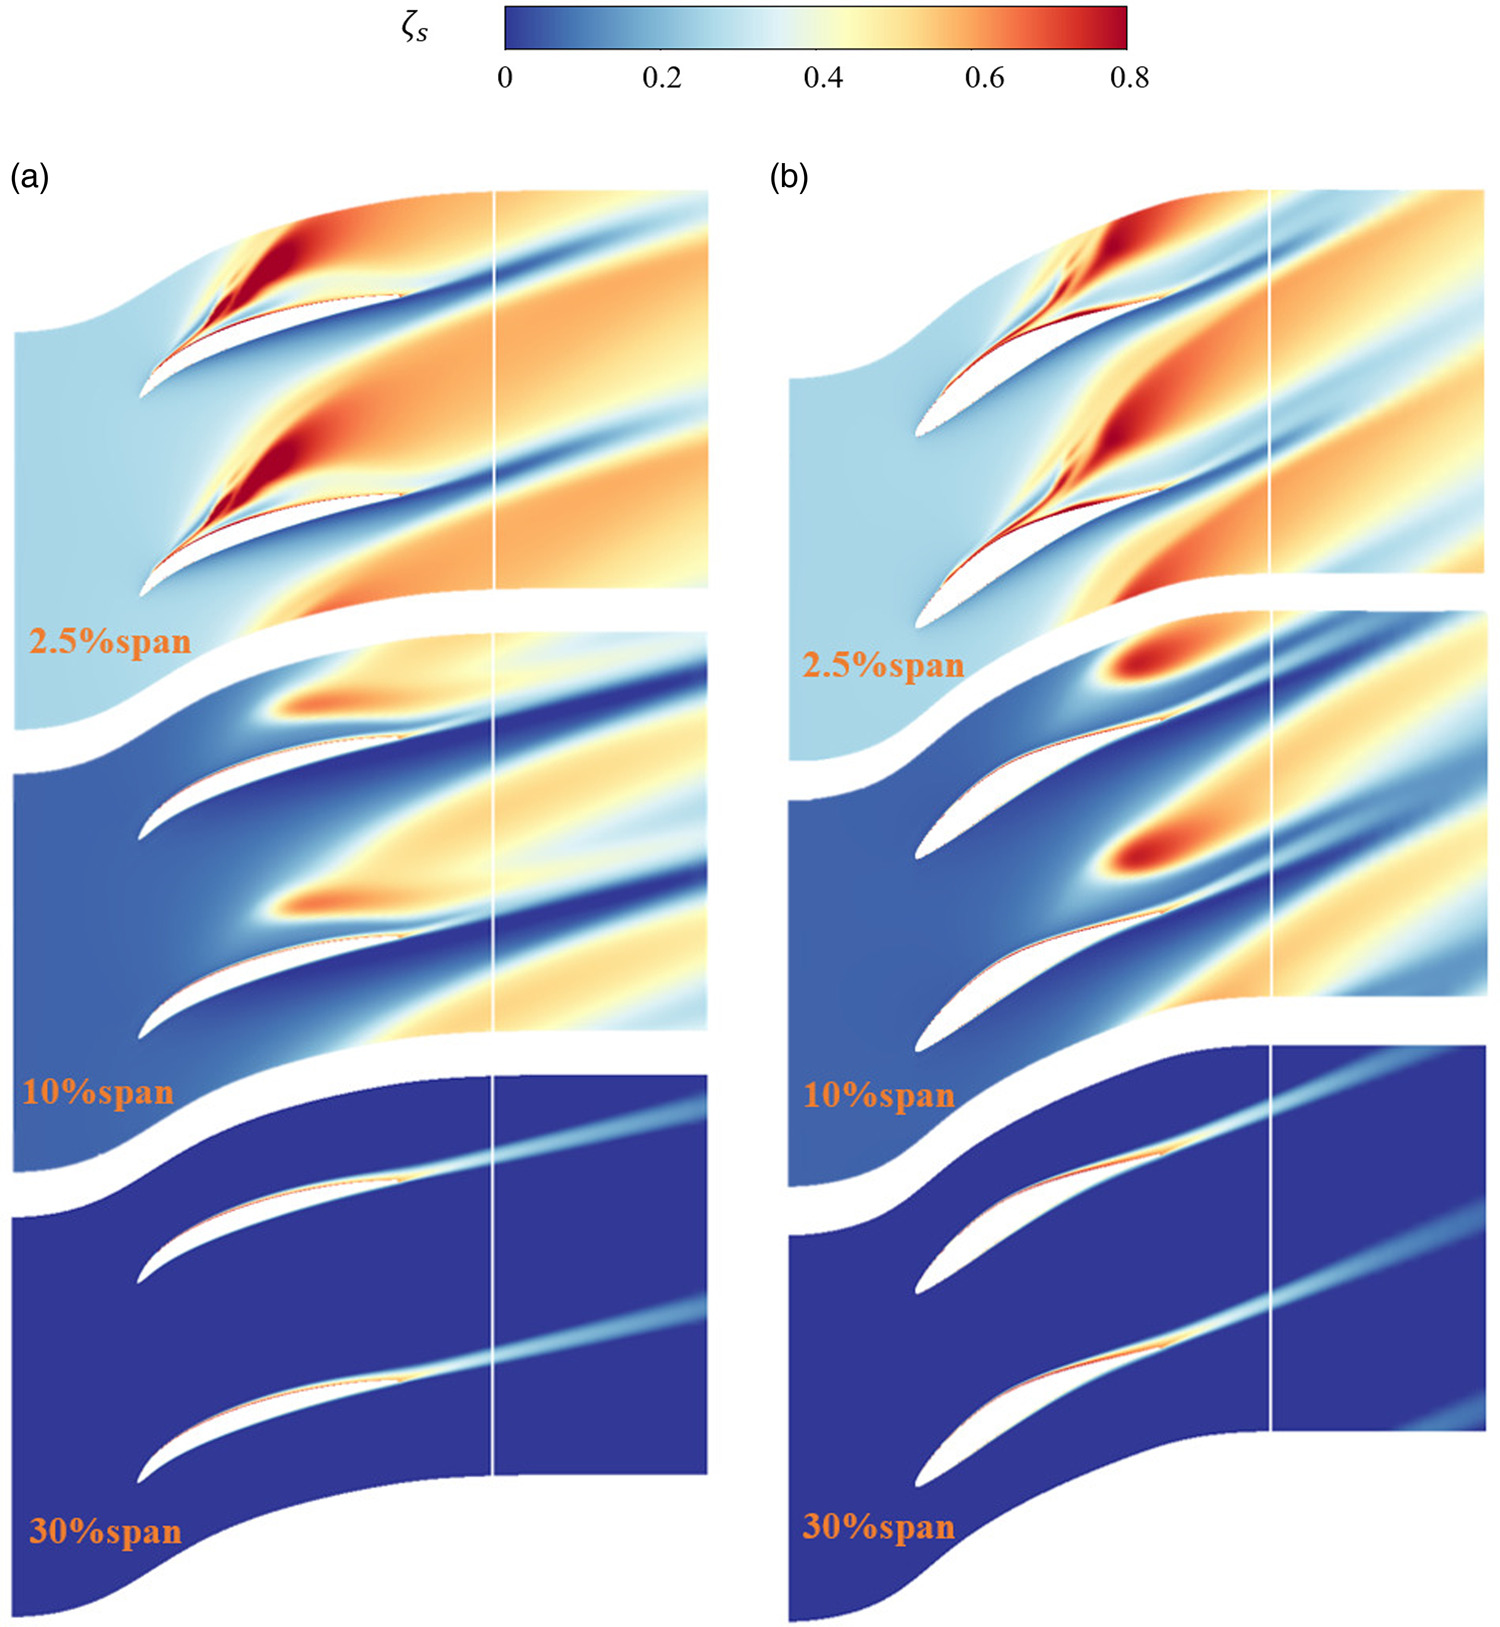
Figure 15 exhibits the distributions of the entropy loss coefficient for FLA and CDA at 2.5% span, 10% span, and 30% span of the blade-to-blade (B2B) section at the condition of the moving endwall, with white vertical lines marking the cascade outlet plane MP2. As shown in the figure, at 2.5% and 10% spans, the region of high entropy loss for FLA develops closer to the LE of the blade, whereas for CDA, the analogous region evolves closer to the TE. The mixing of secondary flow, such as the hub leakage flow, with the main flow leads to entropy losses, and the mixing degree at different positions results in different entropy loss coefficients. The fore-loading airfoil FLA causes the leakage flow to begin to mix near the LE of the blade, whereas, for the middle-loading CDA, the leakage flow starts to mix closer to the TE of the blade. Therefore, when reaching the same outlet MP2, FLA has a longer mixing development path, leading to a broader mixing range between the leakage flow and the main flow, while the mixing intensity in the core area is smaller. This means that FLA has a larger high entropy loss region, but the entropy loss coefficient in the core area is lower than that of CDA. The mixing development path of CDA is relatively shorter, hence the mixing range between the leakage flow and the main flow is smaller, and the mixing intensity in the core area is greater. At 30% span, any significant difference in entropy loss coefficient at MP2 between the two cascades has dissipated. The above analysis explains the phenomenon observed in Figure 8 that at the condition of moving endwall, the two cascades with different loading, i.e. fore-loading and middle-loading, show the nearly identical radial distribution of the entropy loss coefficient at the cascade outlet.
Entropy loss mechanism
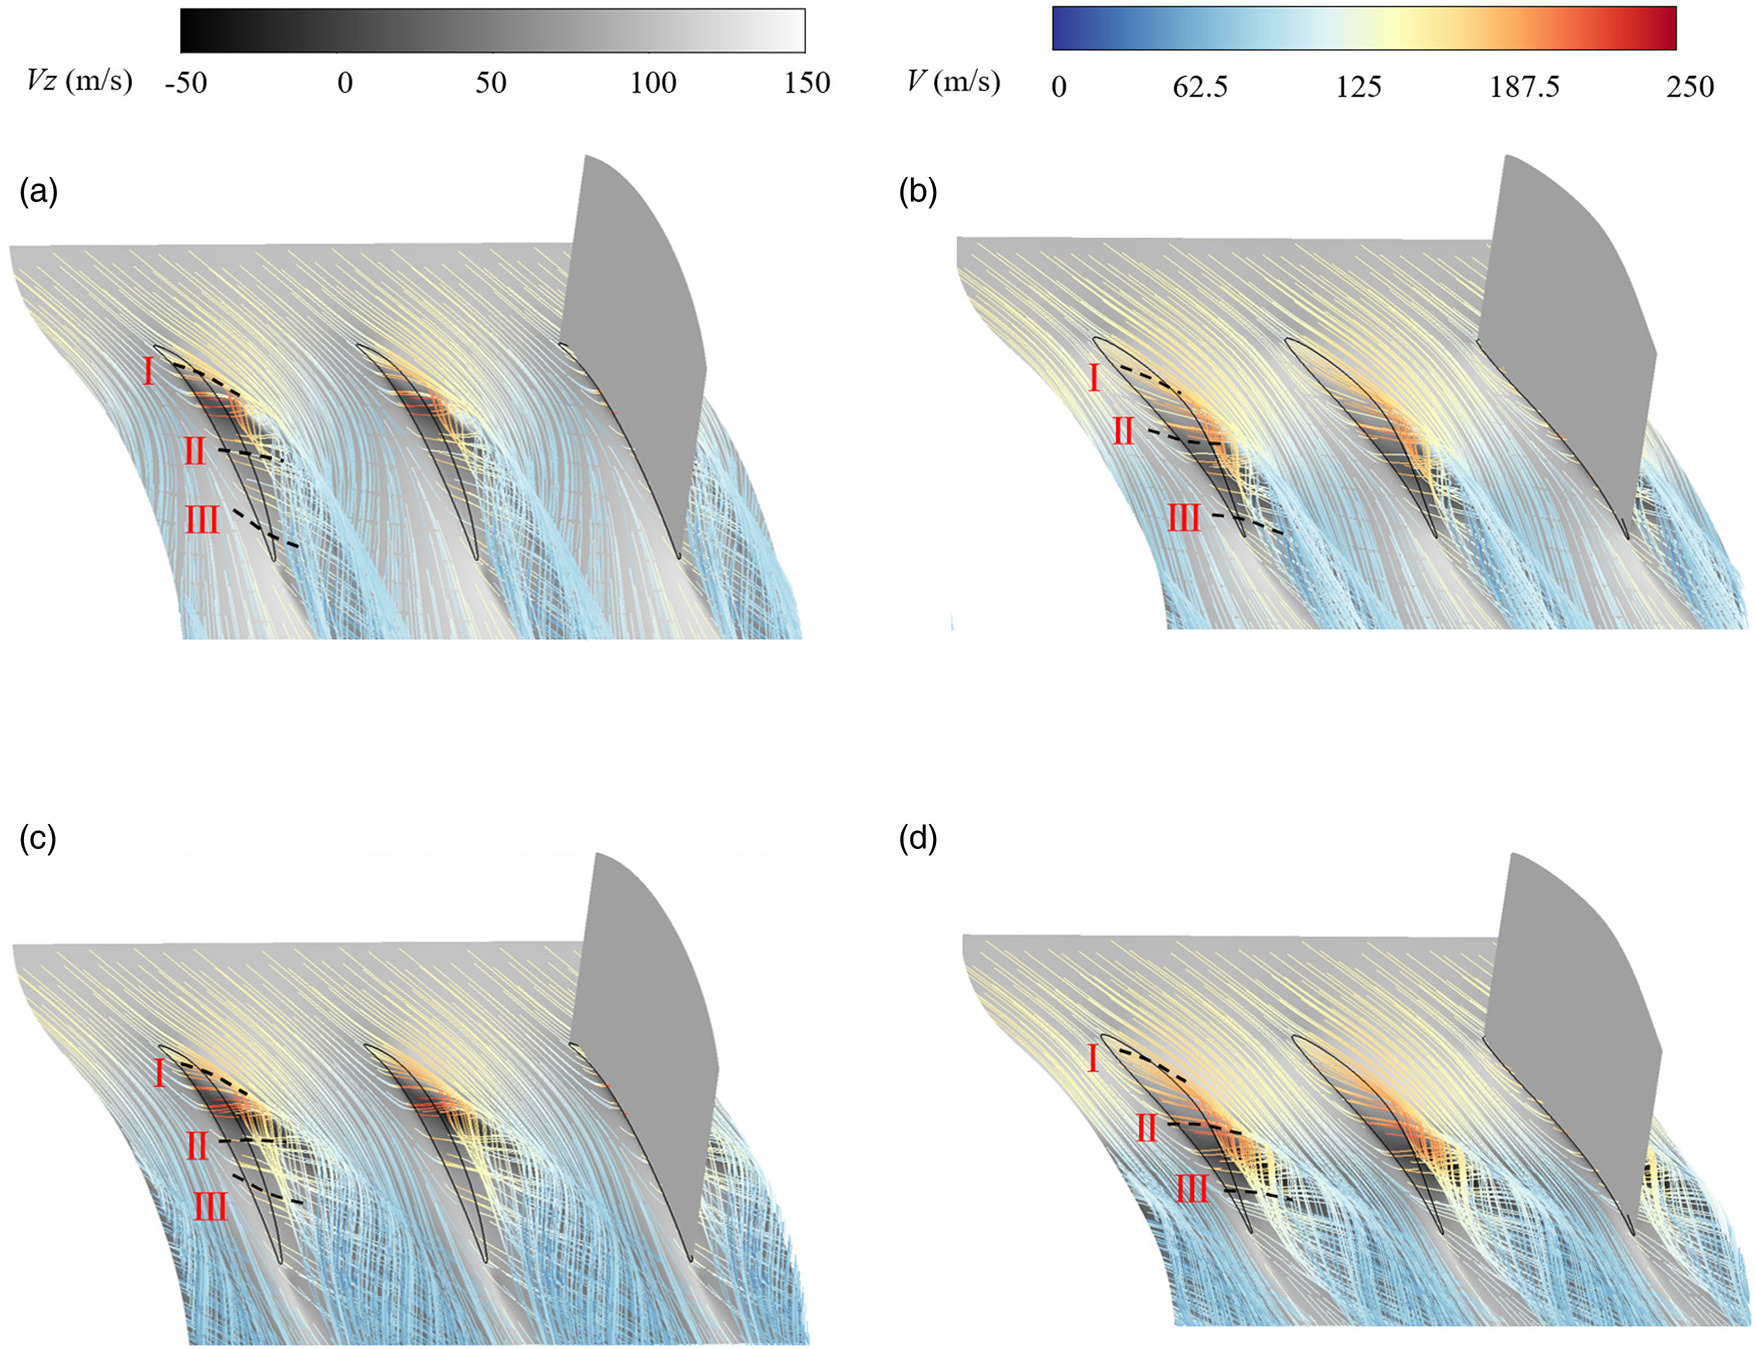
The mechanism of entropy loss of the cantilevered stator is analyzed from the mixing loss of hub leakage flow. Figure 16 presents the 3D streamlines and axial velocity distributions at 0.5% span for both FLA and CDA cascades at static and moving endwall conditions, and the 3D streamlines are colored with absolute velocity. As shown in the figure, based on the distinct characteristics of leakage streamlines at various chordwise positions, the streamlines can be categorized into three types. The first type, streamlines I, quickly roll up on the SS after exiting the gap to form the leakage vortex, continuously occupying the core region of the vortex. These vortices are small and compact, and move away from the SS down the passage, eventually merging into the main flow. The second type, streamlines II, does not immediately enter the leakage vortex upon exiting the gap but maintains its direction while progressing downstream to be subsequently rolled into the outer periphery of the leakage vortex. The third type, streamlines III, mostly refrains from being drawn into the vortex as it moves downstream, flowing outside of the vortex core formed by the previous two types of streamlines, and is unable to enter the core region of the vortex. It is evident that at the condition of the static endwall, the second type of streamlines for both cascades is similarly positioned chordwise. However, for CDA, the first and third types of streamlines are closer to the TE of the blade. At the condition of the moving endwall, all three types of streamlines for FLA are positioned further upstream in the chordwise direction.
As three types of leakage flow evolve in the cascade passage, regions in the passage exhibit axial velocities Vz less than or equal to zero (the dark grey region), indicative of low axial speed areas suggesting intense mixing of leakage flow at these locations. Comparing the axial velocity distributions and streamline velocities of the two cascades, it can be seen that the low axial velocity region of FLA is closer to the blade LE and is located between the first and second types of leakage streamlines. In this region, the leakage flow velocity and the mainstream velocity entering the blade passage are mixed through the coupling effect of the absolute value and velocity angle, resulting in a relatively small influence area of low axial velocity. The low axial velocity region of CDA is near the blade TE and is located between the second and third types of leakage streamlines. In this region, also due to the coupling effect of the absolute value and velocity angle between the leakage flow velocity and the mainstream velocity, the influence area of the low axial velocity is relatively large.
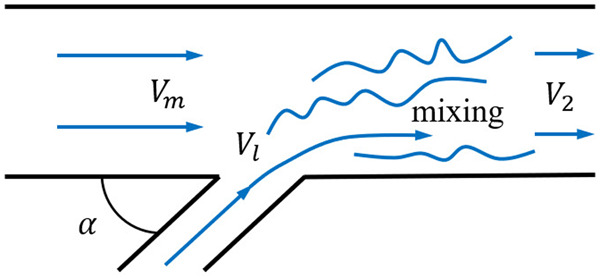
The mixing of hub leakage flow with the mainstream leads to entropy loss, and different degrees of mixing result in different entropy losses. The simplified formula of Denton (1993) is used to further analyze the rate of entropy creation:
where T represents static temperature,
A great simplification of the theory is possible for the case when the flow rate of one of the steams is small, as illustrated in Figure 17. It can be seen that the main factor affecting the entropy creation rate is the difference between
Conclusions
The paper employs experimental and numerical simulation methods to focus on the study of the effects of fore-loading cantilevered stator on hub leakage flow, comparing it with a typical middle-loading controlled diffusion airfoil (CDA) stator whose radial distribution of the entropy loss coefficient is the same as that of the fore-loading airfoil (FLA) stator at the condition of moving endwall. The effects of two different cantilevered stator loading designs on hub leakage flow are analyzed, and the reason for the same radial distribution of the entropy loss coefficient is discussed. The conclusions obtained are as follows:
The maximum loading position of FLA is about 10% of the axial chord, while the maximum loading position of CDA is about 40% of the axial chord. FLA is a fore-loading and high-loading cascade with a diffusion factor significantly greater than CDA. However, the radial distribution trend of the entropy loss coefficient is consistent between the two cascades, especially at the condition of moving endwall, the radial distribution of the entropy loss coefficient of FLA and CDA is almost identical. For the distribution trend of the entropy loss of both cascades, from about 30% to 13% span, the entropy loss is greater at the condition of static endwall, whereas above 13% span, the entropy loss is greater at the condition of moving endwall. In other words, the critical point between the static endwall and the moving endwall effect is about 13% of the blade height.
The position of the maximum leakage flow rate lags behind the position of the maximum blade loading. At the condition of moving endwall, the maximum value of leakage flow for FLA is delayed by 14% of the axial chord relative to the position of maximum blade loading, and for CDA, it is delayed by 10%. This lag is related to the development of leakage vortex in the passage. At the location of maximum blade loading, the leakage vortex that rolls up in the cascade passage makes the circumferential momentum of the leakage flow continue to increase, resulting in the maximum value of leakage flow lagging behind the maximum blade loading position. Based on the leakage flow characteristics, the leakage flow streamlines are classified into three types. The fore-loading cascade causes three types of streamlines closer to the inlet, and consequently, the development and mixing position of leakage flow within the passage is also closer to the inlet.
In the cascade passage, the initiation of hub leakage flow development for FLA is closer to the inlet, yielding a longer developmental path. Therefore, at the outlet, the high entropy loss region of FLA is larger due to sufficient mixing, but the entropy loss coefficient of FLA is lower in the core region. In comparison, the initiation of hub leakage flow development for CDA is late, with a smaller high entropy loss region, but higher entropy loss coefficient in the core area. Thus, after accounting for these differences, the radial distribution of the average entropy loss coefficient of the two cascades at the outlet is basically the same at the condition of the moving endwall. Additionally, the radial distribution of the entropy loss coefficient at different endwall conditions is mainly determined by the radial extent of the leakage flow. The main cause for the entropy loss is the coupling effect between the product of the leakage flow velocity and injected angle and the mainstream velocity.